Engineering monitoring of rockfall hazards along transportation ...
Engineering monitoring of rockfall hazards along transportation ...
Engineering monitoring of rockfall hazards along transportation ...

You also want an ePaper? Increase the reach of your titles
YUMPU automatically turns print PDFs into web optimized ePapers that Google loves.
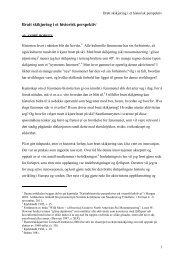
940 M. Lato et al.: Using mobile terrestrial LiDAR for <strong>rockfall</strong> hazard analysisFig. 8. Manual identification <strong>of</strong> structural features in LiDAR data using PolyWorks. These stereonets show a comparison between mappingusing high resolution Leica HDS 6000 data and lower-resolution TITAN data. Results indicate a strong agreement between the data sets.multiple LiDAR datasets and detailed human mapping andanalysis, this section <strong>of</strong> track is an excellent case history siteto assess how LiDAR can augment the data collected by askilled engineer.The scanning <strong>of</strong> the ACR with TITAN was an innovativeuse <strong>of</strong> both a high-rail truck (a truck designed to drive on railtracks) and mobile terrestrial LiDAR equipment. The datacollection did not impede or disrupt scheduled traffic <strong>along</strong>the ACR. The TITAN data were collected <strong>along</strong> the 20 kmstretch <strong>of</strong> the ACR illustrated in Fig. 7. The total collectiontime was 5 h, including 3.5 h for deployment.The rate <strong>of</strong> LiDAR data collection from TITAN is40 000 pts/s – a measure that is independent <strong>of</strong> truck speed.In order to produce data <strong>of</strong> sufficient density to extract discretegeological features, sections <strong>of</strong> track known to be <strong>of</strong>high <strong>rockfall</strong> hazard potential, based on ratings determinedusing the BGC system, were driven at a slower speed thanthe non-hazardous locations <strong>along</strong> the ACR.The most significant operational issue encountered whileplanning and collecting the data was quality <strong>of</strong> GPS signals.Due to the location <strong>of</strong> the ACR within a canyon, sky visibilityis typically poor. Using high sampling and high precisionINS alleviated this limitation. The global accuracy <strong>of</strong> theTITAN data collected <strong>along</strong> the ACR is ±15 cm and the localaccuracy <strong>of</strong> the data for any given section is approximately±3 cm. Following collection, data was delivered in a timestamped globally referenced X, Y, Z, I point-cloud format.The file size is 15 Gb.3 Mobile terrestrial feature extractionMobile terrestrial LiDAR data collected by TITAN can beused to measure features such as joints and fractures. However,before the measurements can be used for engineeringevaluation and design, the accuracy <strong>of</strong> the extracted featuresmust be assessed. In order to achieve this, a reference roadcut(in the Ottawa area) was scanned using both the TITAN andthe Leica HDS 6000 LiDAR systems. The results <strong>of</strong> thisevaluation are illustrated in Fig. 8. Previous work by Lato etal. (2009) has demonstrated that the use <strong>of</strong> data generated bystatic LiDAR equipment is viable for geomechanical evaluation<strong>of</strong> structural features. The data were evaluated usingDips (RocScience, 2006), a stereographic projection analysistool. As can be seen in Fig. 8, the data from mobile andstatic sources is compatible.The processing workflow for structural features measuredfrom both the TITAN data and the Leica HDS 6000 werecompleted using PolyWorks s<strong>of</strong>tware, a state-<strong>of</strong>-the-art Li-DAR processing tool. All planes were identified in thesame manual manner to avoid user bias as recommended bySturzenegger et al. (2007b). The extraction time per featureis roughly 20 s, allowing an individual <strong>rockfall</strong> zone to bestructurally evaluated in roughly 15–20 min. To facilitatethis process a macro was written in PolyWorks to automatethe creation <strong>of</strong> a plane based on selected points by the userthat visually lie on the same structural surface. The minimumarea <strong>of</strong> a joint detectable is dependent on the density <strong>of</strong>the LiDAR data. As data density increases, smaller featuresbecome apparent and their orientations can be extracted. Thedensity <strong>of</strong> the TITAN data in regions <strong>of</strong> interest <strong>along</strong> theACR is roughly 500 pts/m 2 and the minimum discontinuitysize detectable is thus roughly 20 cm×20 cm. The ability toidentify a discontinuity surface depends on both its size andorientation with respect to the scanning equipment. As theangle between the scanner and the surface increases toward90 ◦ the feature is occluded from the point cloud. There arecurrently no mathematical solutions to resolve this issue, socare is taken with evaluation <strong>of</strong> the LiDAR data and timeshould be reserved to explore the data to look for structuresat suspect orientations.Once the LiDAR data has been evaluated for structural features,the orientation <strong>of</strong> the measured surface is convertedNat. Hazards Earth Syst. Sci., 9, 935–946, 2009www.nat-<strong>hazards</strong>-earth-syst-sci.net/9/935/2009/