Pioneer Fund Story - Pioneer Investments
Pioneer Fund Story - Pioneer Investments
Pioneer Fund Story - Pioneer Investments
- No tags were found...

Create successful ePaper yourself
Turn your PDF publications into a flip-book with our unique Google optimized e-Paper software.
Stock Investing Does Require SkillDid you pick the winners? Of course, a little hindsight may have beenall you needed to do well in this game. However, back in 1928 no onecould predict which of these companies would prosper, or to what degree.The same holds true today – that’s why <strong>Pioneer</strong> investment professionalsrely on the value of fundamental research as the basis of their stockselection process.How would you have done if you had invested $1,000 in <strong>Pioneer</strong> <strong>Fund</strong> in 1928?See answer at right...(Turn to the fold-out chart for complete performance information.)The Value of ResearchIndependent research is the cornerstone of investing at <strong>Pioneer</strong>. Overthe years, our research capabilities have expanded to one of the mostcomprehensive in the industry. Since 1928, we’ve maintained a staff ofsector-specific analysts who conduct ongoing dialogue with management,assess industry statistics, calculate target stock prices, and estimate corporateearnings. <strong>Pioneer</strong> believes that individuals with career histories in varioussectors are among the best sources of company and industry information,and we target these professionals for analyst positions.StockTickerSymbolGrowth in Valueof $1,000by 12/31/10Chevron Texaco CVX $2,652,676Coca-Cola KO $1,399,484Hershey Foods HSY $827,170Sears SHLD $441,314General Electric GE $176,576Goodyear Tire GT $139,585DuPont DD $64,150Fortune Brands FO $45,457Eastman Kodak EK $8,067<strong>Pioneer</strong> <strong>Fund</strong> A PIODX $10,116,799Source: Bloomberg and Morningstar; The securities discussedmay or may not be holdings in any of the <strong>Pioneer</strong> funds andshould not be considered recommendations to purchase or sell aparticular security. Past performance does not guarantee futureresults. An investment in an individual security may involve morerisk and provide a lower return than an investment in a mutualfund due to the diversification benefits of a mutual fund.However, an investment in a portfolio of individual securities mayperform as well or better than an investment in a mutual fund.Call 1-800-225-6292 or visit pioneerinvestments.com forthe most recent month-end performance results. Currentperformance may be lower or higher than the performancedata quoted.The performance data quoted represents past performance,which is no guarantee of future results. Investment returnand principal value will fluctuate and shares, when redeemed,may be worth more or less than their original cost.* <strong>Fund</strong> performance reflects the deduction of the 5.75%maximum sales charge for Class A shares and assumesreinvestment of all distributions at net asset value.Performance results reflect any applicable expense waiversin effect during the periods shown. Without such waivers fundperformance would be lower. Waivers may not be in effectfor all funds. Certain fee waivers are contractual through aspecified period. Otherwise, fee waivers can be rescinded atany time. See the prospectus and financial statements formore information.3 <strong>Pioneer</strong> <strong>Fund</strong>s | <strong>Pioneer</strong> <strong>Fund</strong> <strong>Story</strong>
What Makes a Good Value?<strong>Pioneer</strong> <strong>Fund</strong> offers individuals the benefits of basic value investing –a conservative method of analyzing stocks, which searches for certainattributes of well managed companies who are leaders in their industries.The strengths we look for include:Solid assets, low debt Companies that must have something unique, suchas an innovative strategy, a franchise, patent, plant or equipment that givesit a competitive edge – without too much debt.Management ownership Before <strong>Pioneer</strong> owns shares of a company, welike to see that its senior officers are shareholder-minded and have largepersonal stakes in the business.Market leadership We favor companies that stay “ahead of the curve”in competitive market situations.Favorable price Because of market fluctuations, even companies withsignificant potential may have stock trading at prices we consider agood value.Our goal is to closely scrutinize leadersin every industry to find those who offerthe most attractive valuations relativeto the longer-term industry outlookand the outlook for that company.Solid Companies for Basic ValueEvery generation produces companies with enduring stature that oftenbecome household names. Here are a few examples of companies in which<strong>Pioneer</strong> <strong>Fund</strong> has invested during its history.CompanyExxonMobilFirst held by the<strong>Fund</strong> in 1928PACCARFirst held by the<strong>Fund</strong> in 2001TargetFirst held by the<strong>Fund</strong> in 1995WalgreenFirst held by the<strong>Fund</strong> in the 1980sColgate-PalmoliveFirst held by the<strong>Fund</strong> in 1997Profile/AttributesThis company’s global oil and gas exploration/production capabilities,coupled with its refining, marketing and chemicals business, offerstability despite commodity cycles.Leading manufacturer of heavy-duty trucks. Attractive cost structurein a cyclical industry.Highly profitable discount retailer. Continued business expansionthrough store openings.Most successful drug retailing company in the U.S., with anexcellent record of self-funded growth, outstanding managementand strong finances.A worldwide leader in personal care and other consumer products,including toothpaste and detergents. Excellent management withconsistent profitability.Source: <strong>Pioneer</strong> Research. The companies listed should not be considered recommendations to purchase orsell a particular security. Holdings represented 8.58% of <strong>Pioneer</strong> <strong>Fund</strong> portfolio as of 12/31/10.The portfolio is actively managed and holdings may vary for other periods and do not indicate an investmentpolicy commitment to a company or sector. Companies may not have been held continuously from date ofinitial purchase.<strong>Pioneer</strong> <strong>Fund</strong>s | <strong>Pioneer</strong> <strong>Fund</strong> <strong>Story</strong> 4
Research and ProfessionalManagement Can Makea Difference<strong>Pioneer</strong> <strong>Fund</strong> as a Core InvestmentExperienced professional management combined with fundamental,bottom-up research helps to make <strong>Pioneer</strong> <strong>Fund</strong> an attractive candidatefor the cornerstone of a diversified asset allocation. The <strong>Fund</strong> searchesfor value among a diverse range of securities. This broad exposure helpsreduce the effects of volatility on the portfolio, while positioning the <strong>Fund</strong>to benefit from potential market appreciation across industries.“We’re proud to say that <strong>Pioneer</strong><strong>Fund</strong> has outpaced common stocksand other types of investments sinceits inception in 1928.”— John Carey, Portfolio ManagerAverage Annual Total Returns of Popular <strong>Investments</strong>March 1, 1928 - December 31, 2010Investment Stylevalue blend growth<strong>Pioneer</strong> <strong>Fund</strong> at POP 11.81%CapitalizationlargemediumsmallCommon Stocks 9.55%Corporate Bonds 6.26%Long-Term Government Bonds 5.26%U.S. Treasury Bills 3.86%Inflation 3.11%The performance data quoted represents past performance, which is no guarantee of future results. This hypotheticalchart was prepared by <strong>Pioneer</strong> for illustrative purposes only. It does not represent the results of an investor’s actual experiencewith the <strong>Fund</strong>. <strong>Fund</strong> performance reflects the deduction of the 5.75% maximum sales charge for Class A shares, andassumes reinvestment of all distributions at net asset value. The performance data quoted represents past performance,which is no guarantee of future results. This hypothetical chart was prepared by <strong>Pioneer</strong> for illustrative purposes only. Itdoes not represent the results of an investor’s actual experience with the <strong>Fund</strong>.Performance results reflect any applicable expense waivers in effect during the periods shown. Without such waivers <strong>Fund</strong>performance would be lower. Waivers may not be in effect for all funds. Certain fee waivers are contractual through aspecified period. Otherwise, fee waivers can be rescinded at any time. See the prospectus and financial statements formore information.Corporate bonds offer a fixed principal value and a fixed rate of return if held to maturity. Government bonds and Treasurysecurities are guaranteed as to the timely payment of interest and principal; corporate bonds are not.Chart Source: <strong>Pioneer</strong> <strong>Fund</strong> and S&P 500 data prepared using TowersData and <strong>Fund</strong>Station. All other data from Zephyr Style Advisor. Commonstocks are represented by the S&P 500 Index; corporate bonds by the U.S. AAA Corporate Bond Index; government bonds by the U.S. Long-TermGovernment Bond Index; treasuries by the U.S. 30-Day T Bill Index and inflation by the Consumer Price Index which is a general measure of inflation.All market indices are unmanaged. It is not possible to invest directly in an index.<strong>Pioneer</strong> <strong>Fund</strong>s | <strong>Pioneer</strong> <strong>Fund</strong> <strong>Story</strong> 5
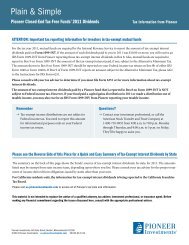
Total value of investment assuming dividends andcapital gains reinvested as of December 31, 2010$10,116,799S&P 500 Index$1,910,500Corporate Bonds $152,820Government Bonds $70,037T-bills $23,053Inflation $12,677Iran defies United Nations on nuclear programSubprime Mortgage CrisisCongress passes historic bailout planGeneral Motors files for bankruptcyTrapped Chilean miners rescued after 69 days1983 1984 1985 1986 1987 1988 1989 1990 1991 1992 1993 1994 1995 1996 1997 1998 1999 2000 2001 2002 2003 2004 2005 2006 2007 2008 2009 2010
<strong>Pioneer</strong> <strong>Fund</strong> Performance –A Closer Look<strong>Pioneer</strong> <strong>Fund</strong> has built a strong performance recordin its long history.But how has the <strong>Fund</strong> performed during shortertime frames – periods more realistic to long-terminvestors?The tables at right show how a $1,000 investmentmade at the maximum offering price would havefared, with all distributions reinvested, for every10-, 20- and 30-year calendar period in the<strong>Fund</strong>’s history.The performance data quoted represents past performance,which is no guarantee of future results.<strong>Fund</strong> performance reflects the deduction of the 5.75%maximum sales charge for Class A shares and assumesreinvestment of all distributions at net asset value.Source: TowersData and <strong>Fund</strong>station6 <strong>Pioneer</strong> <strong>Fund</strong>s | <strong>Pioneer</strong> <strong>Fund</strong> <strong>Story</strong>Impressive Results Over Time10-year periodsPeriod Ending Value1928-37 1,2371929-38 1,2201930-39 1,4731931-40 2,2421932-41 3,4771933-42 3,4321934-43 4,3001935-44 4,9331936-45 5,3361937-46 4,4621938-47 8,0311939-48 6,6271940-49 6,4441941-50 7,8501942-51 7,6131943-52 7,0361944-53 4,7991945-54 4,6001946-55 3,6111947-56 3,5751948-57 3,1761949-58 4,4691950-59 4,4371951-60 3,6371952-61 3,8291953-62 3,2061954-63 3,4861955-64 2,8221956-65 3,0221957-66 2,5841958-67 3,9091959-68 3,5531960-69 2,6131961-70 2,5981962-71 2,3551963-72 2,9151964-73 2,4581965-74 1,7431966-75 1,9391967-76 2,7811968-77 2,0911969-78 1,8201970-79 2,7711971-80 3,5861972-81 3,0661973-82 3,0171974-83 3,8981975-84 4,7561976-85 4,3131977-86 3,5121978-87 3,5731979-88 3,7661980-89 3,6321981-90 2,4871982-91 3,1481983-92 3,1511984-93 2,8811985-94 2,8891986-95 2,9041987-96 3,1181988-97 4,0931989-98 4,4661990-99 4,1821991-00 4,6781992-01 3,3881993-02 2,3781994-03 2,5931995-04 2,9121996-05 2,4461997-06 2,3781998-07 1,7981999-08 9142000-09 9832001-10 1,13620-year periodsPeriod Ending Value1928-47 11,3391929-48 9,0661930-49 10,6531931-50 19,8431932-51 30,4791933-52 25,5141934-53 21,8331935-54 24,0931936-55 20,4721937-56 16,9201938-57 27,0351939-58 31,3901940-59 30,3581941-60 30,2791942-61 30,9261943-62 23,9091944-63 17,7311945-64 14,0661946-65 11,5821947-66 9,8011948-67 13,1721949-68 16,8481950-69 12,3021951-70 9,9871952-71 9,5661953-72 9,9181954-73 9,0961955-74 5,3271956-75 6,2141957-76 7,6281958-77 8,6691959-78 6,8601960-79 7,6851961-80 9,8511962-81 7,6591963-82 9,3331964-83 10,1671965-84 8,7941966-85 8,8701967-86 10,3651968-87 7,9271969-88 7,2691970-89 10,6781971-90 9,4641972-91 10,2411973-92 10,0861974-93 11,9171975-94 14,5801976-95 13,2881977-96 11,6171978-97 15,5211979-98 17,8441980-99 16,1151981-00 12,3481982-01 11,3141983-02 7,9481984-03 7,9271985-04 8,9241986-05 7,5361987-06 7,8681988-07 7,8261989-08 4,3401990-09 4,3701991-10 5,649* * *Rolling calendar year periods30-year periodsPeriod Ending Value1928-57 38,1681929-58 42,9421930-59 50,1891931-60 76,5401932-61 123,8161933-62 86,7031934-63 80,7641935-64 73,6691936-65 65,6561937-66 46,3861938-67 112,1121939-68 118,3491940-69 84,1641941-70 83,1371942-71 77,2691943-72 73,9751944-73 46,2711945-74 25,9971946-75 23,8141947-76 28,9291948-77 29,2111949-78 32,5311950-79 36,1761951-80 37,9971952-81 31,1141953-82 31,7531954-83 37,6181955-84 26,8811956-85 28,4341957-86 28,4331958-87 32,8691959-88 27,3981960-89 29,6191961-90 25,9961962-91 25,5851963-92 31,2041964-93 31,0841965-94 26,9611966-95 27,3281967-96 34,2841968-97 34,4301969-98 34,4471970-99 47,3791971-00 46,9851972-01 36,8051973-02 25,4441974-03 32,7871975-04 45,0411976-05 34,4851977-06 29,3141978-07 29,4881979-08 17,2321980-09 16,7411981-10 14,820Period Since Inception1928-10** $10,116,799* Beginning March 1, 1928** Ending December 31, 2010
<strong>Pioneer</strong> <strong>Fund</strong> Has Outperformedin Down MarketsNo one can predict when a down market will hit or how long it willlast, but choosing the right investments can help you better prepareyour portfolio for whatever the market may have in store.Since 1928, the U.S. stock market has endured 21 corrections wherethe S&P 500 declined 13% or more. <strong>Pioneer</strong> <strong>Fund</strong>, which has experienceda broad range of investment environments since 1928, outperformedthe S&P 500 in 19 of those 21 corrections.Call 1-800-225-6292 or visit pioneerinvestments.com for the most recentmonth-end performance results. Current performance may be lower or higherthan the performance data quoted.The performance data quoted represents past performance, which is no guarantee of futureresults. Investment return and principal value will fluctuate and shares, whenredeemed, may be worth more or less than their original cost. <strong>Fund</strong> performance reflectedin the chart does not take into account the deduction of the 5.75% maximum salescharge for Class A shares which would have lowered returns. Assumes reinvestmentof all distributions at net asset value. Other share classes are available for whichperformance and expenses will differ. <strong>Pioneer</strong> prepared this chart for illustrativepurposes only. Each investor’s experience with the <strong>Fund</strong> will differ.<strong>Pioneer</strong> <strong>Fund</strong>’s Record in Down MarketsPeriods in which the <strong>Pioneer</strong> <strong>Fund</strong> outperformed the S&P 500 IndexDate of Down Markethihhhhihhhhhhhhhhhhhh<strong>Pioneer</strong> <strong>Fund</strong>(A Shares at NAV)S&P 50010/9/07-3/9/09 -53.53 -55.253/19/02-10/9/02 -33.44 -33.021/14/00-9/21/01 -23.37 -32.737/17/98-8/31/98 -18.41 -19.197/16/90-10/11/90 -18.32 -19.188/25/87-10/19/87 -25.51 -32.934/27/81-8/12/82 -25.13 -18.499/21/76-2/28/78 2.79 -13.361/11/73-12/6/74 -24.49 -41.8712/3/68-5/26/70 -26.34 -32.372/9/66-10/7/66 -17.03 -20.2212/13/61-6/26/62 -18.74 -26.774/6/56-10/22/57 -7.12 -15.416/15/48-6/13/49 -7.59 -15.485/29/46-5/17/47 -6.43 -24.199/12/39-4/28/42 47.09 -32.7511/12/38-4/8/39 23.22 -20.873/10/37-3/31/38 -43.17 -51.337/18/33-3/14/35* 54.95 -29.299/7/32-2/27/33* 34.76 -34.999/7/29-6/1/32* -50.31 -83.85Past performance is no guarantee of future results. Chart source: *TowersData asnoted. All other periods Ned Davis Research. The S&P 500 Index is an unmanagedmeasure of the U.S. stock market and does not represent the performance of anyfund. Indices are unmanaged and their returns assume reinvestment of dividendsand, unlike mutual fund returns, do not reflect any fees or expenses associated witha mutual fund. It is not possible to invest directly in an index.<strong>Pioneer</strong> <strong>Fund</strong> <strong>Story</strong> | <strong>Pioneer</strong> <strong>Fund</strong>s 7
Earning Profits over Shorter Time PeriodsAll periods ended 12/31/1033%82 One-year periodsPositive periods 5567%Negative periods 2715%80 Three-year periodsPositive periods 6885%Negative periods 1287%13%78 Five-year periodsPositive periods 68Negative periods 10A Track Record of Earning Profitsfor InvestorsWhile <strong>Pioneer</strong> <strong>Fund</strong>’s lifetime record of performance may beimpressive, your own investment goals are more likely linked to ashorter time horizon. The charts here offer a look at the <strong>Fund</strong>’srecord of earning profits over rolling 1-, 3-, 5-, 10- and even 15-yearperiods. The <strong>Fund</strong>’s consistent, value-oriented approach to investingin large-cap stocks has helped it build a record of earning profits overshorter time periods as well as throughout its 80-plus year history.3%73 Ten-year periods97%Positive periods 71Negative periods 268 Fifteen-year periods100%Positive periods 68Negative periods 0The performance data quoted represents past performance, which is no guaranteeof future results.<strong>Fund</strong> performance reflects the deduction of the 5.75% maximum sales charge for Class Ashares and assumes reinvestment of all distributions at net asset value.8 <strong>Pioneer</strong> <strong>Fund</strong> <strong>Story</strong> | <strong>Pioneer</strong> <strong>Fund</strong>s
We can help you pursue your financial goalsWe’ve been here since the beginningAs one of the oldest and most experienced money managers in theUnited States, <strong>Pioneer</strong> <strong>Investments</strong>® has been a leading innovator in theinvestment management industry for over 80 years. Today, our organizationis worldwide. <strong>Pioneer</strong> Global Asset Management S.p.A. and its subsidiariesmanage $294.4 billion (as of December 31, 2010) under the name<strong>Pioneer</strong> <strong>Investments</strong>, including $64.5 billion managed in the U.S.<strong>Pioneer</strong> manages a wide range of mutual funds designed for any numberof investors – from those who seek current income today, to those withfinancial goals that are years down the road. In addition, <strong>Pioneer</strong> offers avariety of retirement plans and services for both individuals and businesses.For information on any <strong>Pioneer</strong> fund, call1-800-225-6292 or visit our web site atpioneerinvestments.com.A Word About RiskAt times, the <strong>Fund</strong>’s investments may represent industries or industry sectorsthat are interrelated or have common risks, making it more susceptible to anyeconomic, political, or regulatory developments or other risks affecting thoseindustries and sectors. These risks may increase share price volatility.Learn MoreBefore investing, consider the product’s investments objectives, risks,charges and expenses. These risks may increase share price volatility.Contact your advisor or <strong>Pioneer</strong> <strong>Investments</strong> for a prospectuscontaining this information. Please read it carefully.Neither <strong>Pioneer</strong>, nor its representatives are legal or tax advisors. Inaddition, <strong>Pioneer</strong> does not provide advice or recommendations. Theinvestments you choose should correspond to your financial needs,goals, and risk tolerance. For assistance in determining your financialsituation, please consult an investment professional.After the performance period indicated here, the most recent quarterlyfact sheet must accompany this piece.“Investment management relies primarily on very basic techniques: the search for value, patiencein the attempt to acquire securities at reasonable prices, and patience in giving them ample timeto reflect in market prices the value that we identified. The pursuit of profits in this straightforwardmanner has helped investors pursue their goals consistently for generations.”Philip L. Carret (1896–1998)Founder of <strong>Pioneer</strong> <strong>Fund</strong><strong>Pioneer</strong> <strong>Fund</strong> <strong>Story</strong> | <strong>Pioneer</strong> <strong>Fund</strong>s 9
Securities offered through <strong>Pioneer</strong> <strong>Fund</strong>s Distributor, Inc.60 State Street, Boston, Massachusetts 02109Underwriter of <strong>Pioneer</strong> mutual funds, Member SIPC©2011 <strong>Pioneer</strong> <strong>Investments</strong> • pioneerinvestments.com 16029-14-0111