Aquatic Microbial Ecology 51:77
Aquatic Microbial Ecology 51:77
Aquatic Microbial Ecology 51:77

Create successful ePaper yourself
Turn your PDF publications into a flip-book with our unique Google optimized e-Paper software.
Vol. <strong>51</strong>: <strong>77</strong>–86, 2008doi: 10.3354/ame01184AQUATIC MICROBIAL ECOLOGYAquat Microb EcolPublished April 24OPENACCESSTemperature-related phenotypic plasticity in thegreen microalga Micrasterias rotataJiří Neustupa*, Jan 2t’astný, Ladislav Hoda
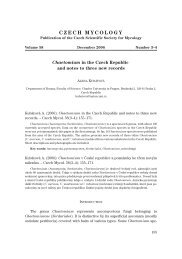
78Aquat Microb Ecol <strong>51</strong>: <strong>77</strong>–86, 2008Fig. 1. Micrasterias rotata. Morphology of vegetative cells andpositions of landmarks. (A) The standard haploid cell withpositions of 31 landmarks (indicated by numbers) on theadult semicell. (B) The vegetative diploid cell from the 30°CpopulationHowever, the effect of higher temperatures on phenotypicplasticity at levels that would not completely disruptthe morphogenetic processes was not investigated.Landmark-based geometric morphometrics (Bookstein1991) can be used to precisely characterize patternsof morphological variation and quantify the plasticitylevels using morphological disparity measures ofindividual species or populations (Zelditch et al. 2004).In contrast to conventional morphometric methods,geometric morphometric data are able to representvariation in shape as a whole in an investigated dataset. The higher statistical power of geometric morphometricmethods compared with traditional measurementsto discriminate biological objects has beendemonstrated many times in different organisms (e.g.Rohlf 2000, Monteiro et al. 2002), including microalgae(Beszteri et al. 2005). These methods have been usedincreasingly in algal and protist research in both taxonomic(Beszteri et al. 2005, Neustupa & Němcová2007) and ecological studies (Potapova & Hamilton2007). In desmids, correct infrageneric discriminationof populations belonging to 14 central European speciesof the genus Micrasterias was demonstrated byNeustupa & 2t’astný (2006) on the basis of geometricmorphometric data. In addition, patterns of plasticityspanned by principal component analysis (PCA) ofgeometric morphometric data in 5 Micrasterias speciespopulations were closely correlated with molecularphylogenetic data of the genus (Neustupa & 2kaloud2007).In the present study, species-specific variation inmorphology relative to temperature level and the possibleincrease in phenotypic plasticity as a result ofeventual stress-related morphogenetic disturbances inhigher temperatures were investigated. In addition,using the comparative generic data set of Neustupa &2t’astný (2006), the Micrasterias rotata data were comparedwith other species of the genus to illustrate infraspecificplasticity in relation to infrageneric differentiation.We asked whether the different experimentaltemperature conditions can shift resulting morphologyso that the morphometric analysis would then not beable to unambiguously separate the M. rotata populationsfrom other species of the genus. Finally, morphologicalvariation in the cultured M. rotata strain withseasonal variation of natural populations of the samespecies was compared. We asked which temperaturelevels produced morphotypes most similar to thosefound in natural populations and whether the morphologyof natural populations varied significantly duringthe season.MATERIALS AND METHODSThe strain of Micrasterias rotata used in this study(CAUP K604) was originally obtained as a single cellisolate from benthos of flooded quarry pools near Cepvillage, South Bohemia, Czech Republic, in October2005. Cultures were initiated with an inoculum of 15cells and grown for 2 wk in 250 ml Erlenmeyer flasks
Neustupa et al.: Phenotypic plasticity in Micrasterias rotata79containing liquid oligotrophic medium developed bythe Culture Collection of Algae of Charles Universityof Prague (CAUP) (http://botany.natur.cuni.cz/algo/caup.html). Cultures were maintained at temperaturesof 10, 15, 20, 25 and 30°C and illuminated at 40 µmolm –2 s –1 from 18 W cool fluorescent tubes (Philips TLD18W/33), at a light:dark regime of 12:12 h. Micrographswere taken on an Olympus BX<strong>51</strong> light microscopewith Olympus Z5060 digital microphotographicequipment. As a comparative set of natural populations,6 samples of phytobenthos dominated by Micrasteriasrotata were collected from the benthos of asingle 10 to 15 cm shallow peat bog pool in BorkovickáBlata Nature Reserve in South Bohemia, Czech Republic,altitude 410 m above sea level (a.s.l.), pH 5.75 to6.10. Samples were taken on 22 April, 19 May, 15 June,26 July, 9 October and 7 December 2004.For each temperature level and for each naturalsample, 50 adult semicells were randomly chosen andphotographed. On each semicell, 31 structurally correspondinglandmarks were depicted (Fig. 1A, Table 1).For most of the geometric morphometric analyses theTPS-series software (Rohlf 2006) was used. Landmarkpositions, length and width of the cells and depth of theincisions were digitized in TpsDig, ver. 2.05. The incisiondepth was measured between landmark nos. 13and 14 for the main incision between the polar and laterallobes and between landmark nos. 6 and 7 for theincision between the lateral lobules. The landmarkconfigurations were superimposed by generalized Procrustesanalysis (GPA). This widely used method standardizesthe size of the object and optimizes the rotationand translation so that the distances betweencorresponding landmarks of investigated objects areminimized (Bookstein 1991, Zelditch et al. 2004). TheTable 1. Micrasterias rotata. Position of landmarks for the geometric morphometricanalysis as illustrated in Fig. 1A. Terminology follows Prescott et al. (19<strong>77</strong>)Landmark nos.Position1, 31 Margins of isthmus2, 30 Lower extremities of lower lateral lobules3, 29 Upper extremities of 2nd order lower lateral lobules4, 28 Bases of incisions in lower lateral lobules5, 27 Lower extremities of 2nd order lower lateral lobules6, 26 Upper extremities of lower lateral lobules7, 25 Bases of incisions between lateral lobules8, 24 Lower extremities of upper lateral lobules9, 23 Upper extremities of 2nd order upper lateral lobules10, 22 Bases of incisions of upper lateral lobules11, 21 Lower extremities of 2nd order upper lateral lobules12, 20 Upper extremities of upper lateral lobules13, 19 Bases of incisions between polar and lateral lobes14, 18 Lateral margins of the polar lobes15, 17 Inner tooth of marginal extremities of the polar lobes16 Central incision of the polar lobeTpsRelw, ver. 1.42, was used for GPA of our data set.Correlation between Procrustes and the Kendall tangentspace distances was assessed using TpsSmall,ver. 1.20, to ensure that the variation in shape wassmall enough to allow subsequent statistical analyses(Zelditch et al. 2004). The correlation of Procrustes andthe Kendall shape spaces was very high (r = 0.999 to1.000 in all analysed data sets), so we proceeded withfurther analyses. As Micrasterias semicells are bilaterallysymmetrical and anterior and posterior sides donot differ, cells were symmetrized prior to analysisfollowing the standard formula of Klingenberg et al.(2002). This involved reflecting the cells (by multiplyingthe x-coordinates in all landmarks by –1), then relabellingthe paired landmarks in the reflected copy oflandmark configurations and averaging the originaland mirrored configurations in the Procrustes superimposition(GPA). The averages of original andreflected/relabelled cells are ideal symmetric shapes,where each half, together with landmarks lying onmedian axis, bears all the information on the shape ofa symmetric object averaged from its halves. Consequently,further analyses were done using symmetricalconfigurations and the asymmetric component wasomitted (Klingenberg et al. 2002). The PCA of geometricmorphometric shape data was conducted on all cellsgrown at different temperature levels (10 to 30°C).Scores of the objects on the first 15 principal component(PC) axes (spanning 96.7% of the total variation)were used for canonical variate analysis (CVA) inPAST, ver 1.74 (Hammer et al. 2001), to test for and tovisualize the differences between individual temperaturelevels. In addition, using scores on the first 15 PCaxes the 2-group multivariate permutation tests (with10 000 permutations) on Mahalanobis distance betweenall pairs of temperature levelswere conducted. The number of PCaxes chosen was estimated so that allthe axes with eigenvalues higher thanthe Jolliffe cut-off value (Jolliffe 1986)were included and they spanned atleast 95% of the total variation torobustly represent variation in theoriginal data set. Shape configurationstypical for individual temperaturelevels were visualized as thin-platesplines of group centroids from theoverall consensus configuration.Multivariate regression of shapedata on size was done in TpsRegr, ver.1.31, using length, width and centroidsize (CS) as measures of size in individualobjects. This analysis wasaimed to investigate the shape-to-sizerelationship representing the allomet-
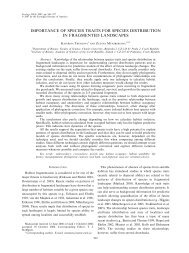
80Aquat Microb Ecol <strong>51</strong>: <strong>77</strong>–86, 2008ric component of morphological variation. CS, the mostcommon size measure in geometric morphometricstudies (Zelditch et al. 2004), is defined as the squareroot of the sum of squared distances from the landmarksto their centroid (Bookstein 1991). In addition,multivariate regression of shape data on the temperaturelevel was conducted. In both cases, significance ofregression models was evaluated using permutationtests (with 1000 permutations) on Wilk’s λ andGoodall’s F-ratio (Zelditch et al. 2004, Rohlf 2006). Thesignificance of size differences between individualgroups was assessed using permutation t-test (10 000permutations) on centroid sizes of individual objects inPAST, ver. 1.74. Morphological disparity of a populationrepresents the quantitative measure of morphologicalvariation. In geometric morphometric studiesthis morphological disparity is mostly used with theProcrustes distance as a measure of a distance in morphospace.In the present study, morphological disparity(M) of populations cultured in individual temperaturelevels was evaluated using a formula withProcrustes shape data from superimpositions of individualgroups (Zelditch et al. 2004):N2∑ ( Di i )= 1M =( N −1)where D i is the Procrustes distance of an individualobject (semicell) to a consensus (mean) shape and N isthe number of objects. The contribution of each objectto the overall morphological disparity of the set can beexpressed as partial morphological disparity index(PM):DPM =N −i 2 1The sum of PM values of all objects equals the valueof morphological disparity index M of a set as a whole.Differences in morphological disparity between individualgroups were evaluated by a permutation testwith 10 000 permutations using partial morphologicaldisparity PM based on Procrustes distances. For thispermutation test the R 2.3.1. routine (R Core DevelopmentTeam 2006) was used (Neustupa & Němcová2007).The data set of 14 central European Micrasteriasspecies of Neustupa & 2t’astný (2006) and 6 additionalnatural samples of M. rotata were used for morphologicalcomparisons with cultured M. rotata shapes fromdifferent temperatures. In total, 17 structurally homologouslandmarks that can be delimited in all species(Neustupa & 2t’astný 2006) were used. Thus, we compileda data set consisting of 5 M. rotata mean configurationsfrom different temperatures, 6 M. rotata meanconfigurations from natural samples taken at differentdates and 13 configurations of other Micrasterias species.The PCA was done with this data set (using lefthalves of symmetric configurations, thus consisting of 9landmarks) and the shape similarities of individualobjects were illustrated by ordination diagrams. Withscores from the first 12 PC axes (spanning 97.9% of thetotal variation), the Euclidean distances, based on theunweighted pair group method with arithmetic meancluster analysis (UPGMA) of our data set, were thencalculated and the resulting tree was bootstrappedusing 10 000 repetitions. For illustration of shape similaritiesin M. rotata populations and in 2 other mostsimilar species (M. papillifera and M. fimbriata), theprincipal coordinates analysis (PCoA) based on Euclideandistances was conducted on a limited dataset of 13objects using scores on 12 PC axes. Ordination andcluster analyses were done in TpsRelw, ver. 1.42, andin PAST, ver. 1.74.RESULTSMicrasterias rotata strain CAUP K604 grew at temperaturesof 10, 15, 20, 25 and 30°C and more than500 cells were present after 2 wk of cultivation at alltemperature levels. However, in the 30°C cultures~28% of cells were teratogenic vegetative diploidswith multiple lateral lobules (Fig. 1B) as demonstratedby Kallio (1953). The morphology of these cells differedprofoundly from the standard haploid morphotypeof the species, and the landmarks in lower laterallobules of diploid cells could not be homologized withthe standard morphotype. Therefore, these cells werenot analyzed and further analyses were conductedonly on standard haploid vegetative cells with typicalM. rotata morphology that includes 2 asymmetric laterallobules (Fig. 1A).The CVA revealed highly significant differentiationbetween cultured populations from individual temperatures(Wilk’s λ = 0.0132, p < 0.0001), with individualpopulations roughly grouped along the first CV axis(Fig. 2A). All group pairs significantly differed in shapewith permutation p = 0.0001 in all 2-group multivariatecomparisons. Mean landmark configurations of populationsfrom different temperatures are illustrated inFig. 3. The low temperature cells were characterizedprimarily by protruding polar lobes and deep incisionsbetween lobes and lobules. These features were mostprominent in 10 and 15°C groups. The cells growing at20°C and higher temperatures had other distinct shapecharacteristics. The polar lobes were flatter and did notprotrude over adjacent lateral lobes. In addition, theincisions in semicells were about 15 to 20% shallowerin highest levels than in the low temperature groups(Table 2) and their depth decreased gradually inrelation to increasing temperature (Fig. 4A,B). The
Neustupa et al.: Phenotypic plasticity in Micrasterias rotata81those of smallest size values and vice versa (Fig. 5).The general shape trend was very similar to that visiblein consensus configurations of temperature groups(Fig. 3). The shape-to-size regression trends withinindividual temperature groups and natural samplesFig. 2. Micrasterias rotata. Discrimination of shapes from differenttemperature levels. (A) The CVA ordination plot ofshape data according to temperature groups (CV = canonicalvariate). Positions of individual cells are indicated bytheir temperature group (i.e. 10, 15, 20, 25 and 30°C). (B) TheUPGMA tree based on Procrustes distances of meanconfigurations of individual temperature groupsUPGMA tree of the matrix of Procrustes distancesbetween consensus configurations of temperaturegroups demonstrated a pattern similar to the CVAordination diagram (Fig. 2B). The low temperature10 and 15°C groups clustered closely together. Thegroups from higher temperatures formed a loose clusterincluding the closely similar 20 and 25°C groupsadjacent to the more distant 30°C group. The individualcell size measurements (length and width of thecells and the CS of landmark configurations) weretightly correlated (r = 0.94 to 0.97, p < 0.0001) in allpairs. Therefore, further shape-to-size analyses wereconducted using CS as a single measure. The populationsof Micrasterias rotata from different temperaturesdiffered in size that continually decreased at temperature-levelshigher than 15°C (Fig. 4C–E). However, the10°C population had significantly smaller cells thanthe 15°C group (permutation p = 0.0119). A decrease insize between individual temperature groups from 15°Cwas significant in all pairs with the permutation p =0.0001, except in 20 and 25°C pairs with p = 0.0082.The relation of shape data and CS was highly significant(Wilk’s λ = 0.207, permutation p = 0.001; Goodall’sF-ratio = 148.7, permutation p = 0.001, 62.5% of variationunexplained by the regression model). Cell shapealso differed significantly with temperature (Wilk’s λ =0.106, permutation p = 0.001; Goodall’s F-ratio = 163.1,permutation p = 0.001, 60.4% of variation unexplainedby the regression model). The shapes reconstructed bythe multivariate regression models characteristic forhighest temperature levels were markedly similar toFig. 3. Micrasterias rotata. The shapes of mean configurationsof individual temperature groups illustrated by thin-platesplines from the overall consensus configuration
82Aquat Microb Ecol <strong>51</strong>: <strong>77</strong>–86, 2008Table 2. Micrasterias rotata. Size measurements of cells cultured at different temperature levels. P/L = the incision between polarand lateral lobes, L/L = the main incision between the pair of lateral lobules. Values are mean, with coefficient of variationin bracketsTemp. (°C) P/L (µm) L/L (µm) Length (µm) Width (µm) Centroid size10 70.2 (0.165) 53.2 (0.160) 261.2 (0.038) 221.9 (0.032) 1023 (0.034)15 67.2 (0.162) <strong>51</strong>.4 (0.165) 266.3 (0.053) 228.5 (0.052) 1046 (0.048)20 62.2 (0.108) 47.7 (0.106) 229.5 (0.06) 203.2 (0.079) 928 (0.066)25 60.9 (0.106) 46.8 (0.103) 225.9 (0.036) 197.6 (0.039) 914 (0.042)30 56.7 (0.071) 44.4 (0.086) 219.9 (0.035) 187.1 (0.032) 862 (0.039)Fig. 4. Micrasterias rotata. Size and disparity measurements versus experimental temperature. (A) Depth of the incision betweenthe polar and lateral lobes (P/L) in cells from different temperatures. (B) Depth of the incision between the 2 lateral lobules (L/L)in cells from different temperatures. (C) Length of the cells from individual temperature levels. (D) Width of the cells from individualtemperature levels. (E) Centroid size of cells in different temperatures. (F) Partial morphological disparities indicating quantitativeextent of morphological variation based on the common superimposition of cells from individual temperature groups.×: outlying values
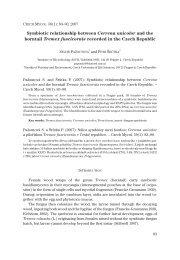
Neustupa et al.: Phenotypic plasticity in Micrasterias rotata83Fig. 5. Micrasterias rotata. Shapes of marginal configurations reconstructed bythe regression models of shape data on size and on temperature(not shown) consistently revealed the same and singlemorphological dynamics that were very similar to thatof the complete data set. The smallest cells typicallyhad deep incisions between lobes and lobules. Conversely,the largest cells generally had much shallowerincisions within all temperature groups. All shape-tosizemultivariate regressions in individual temperaturegroups were significant with permutation p = 0.001 forboth Wilk’s λ and Goodall’s F-ratio.Tests on morphological disparities of different temperaturesets revealed that the 10°C population wassignificantly less variable than all the other sets (permutationp = 0.0002 to 0.0115). The values of morphologicaldisparity (M) indicating the quantitative measureof plasticity in each population (Zelditch et al.2004) were 5.8 × 10 –4 for the 10°C population and 9.5 ×10 –4 to 1.2 × 10 –3 in other temperature levels (Fig. 4F).Differences between populations from 15 to 30°Clevels were not significant.All of the Micrasterias rotata objectswere tightly grouped together, butshapes of M. fimbriata and M. papilliferawere also close to the M. rotata cluster inthe ordination plot of first and second PCaxes (PC1: 70.9%, PC2: 13.6%) fromPCA of the combined data set of culturedM. rotata populations, natural populationsof the same species and 13 othercentral European Micrasterias species(Fig. 6A). M. rotata objects had the lowestmutual Procrustes distances (i.e. weremost similar to each other) in comparisonwith all the other species of the genuswith the exception of the 30°C populationwhose shape was less similar to thenatural samples and to the low temperature10 and 15°C cultured populations ofM. rotata than to shapes of M. papilliferaand M. fimbriata. The UPGMA clusterdendrogram demonstrated a similar pattern(Fig. 7) and all the natural samples of M. rotatagrouped together with 10 and 15°C cultured populations,whereas cells grown at higher temperaturesFig. 6. Micrasterias spp. Ordination analyses of shape data ofM. rotata populations combined with 13 other central Europeanspecies illustrated by (A) the ordination plot of PCA involvingall the investigated M. rotata cultured and naturalpopulations and 13 other Micrasterias species (RW = relativewarp), and (B) the ordination plot of PCoA of a data set comprisingthe M. rotata populations and 2 other most similar species(PCo = principal coordinate). AM = Micrasterias americana,AP = M. apiculata, BR = M. brachyptera, CM = M.crux-melitensis, DC = M. decemdentata, DE = M. denticulata,FI = M. fimbriata, FU = M. furcata, JE = M. jenneri, PA = M.papillifera, RA = M. radiosa, RO = M. rotata, TH = M.thomasiana, TR = M. truncata. Months associated with RO indicatenatural population samples; numbers associated withRO represent culture temperatures; the 10 and 15°C M. rotatapopulations are nested inside the natural samples
84Aquat Microb Ecol <strong>51</strong>: <strong>77</strong>–86, 2008Fig. 7. Micrasterias spp. UPGMA tree of shape data of M. rotata populationsand 13 other Micrasterias species. – –: bootstrap values lower than 50%.Sample designations are as defined for Fig. 6were less similar to the natural samples. In the ordinationdiagram of the first 2 axes of PCoA that spanned74.1% of the total variation (PCo1: 42.4%, PCo2:31.7%) a tight cluster of natural samples together withcultured 10 and 15°C populations is evident (Fig. 6B).DISCUSSIONSimilar to other protists, the size of Micrasteriasrotata cells cultured at different temperatures decreasedconsistently from 15 to 30°C. However, the10°C temperature group had significantly larger cellsthan the 15°C group, which corresponded with Atkinsonet al. (2003), who proposed that cell size increasesat very low temperatures below the range where thetemperature-related size reduction rule applies. Byaccepting this model, we would have to admit that constanttemperatures of about 10°C are below this limit inthe investigated M. rotata strain. Cells cultured at 10°Calso were less variable in cell shape than the othertemperature groups as demonstrated by their significantlylower morphological disparity. This quantitativefeature indicating the extent of plasticity did not differin the 15°C and 30°C temperature groups, but the 30°Cgroup contained about 28% of teratogenic vegetativediploid cells with multipled lateral lobules. Kallio(1953) reported 2 profoundly different experimentalmechanisms that lead to development of vegetativediploids in Micrasterias — centrifugation and the shorttermcold shocks. The long-term cultivation at 30°Cevidently leads to similar disruption of mitotic processin haploid vegetative cells. Presence of these teratogeniccells at 30°C could, thus, be interpreted as anindicator of stressing conditions that lead to disruptionsin ontogenesis of semicells. Shapesof all temperature groups differed significantly,but the cells cultured at 10 and15°C clustered close to each other, as didthose cultured at 20 and 25°C, whereas30°C cells were more distant. Thus, thehigh temperature group cultured at 30°Cwas most dissimilar from all othergroups, even when only the standardhaploid vegetative cells were taken intoaccount in the morphometric analysis.Both temperature and size explainedsimilar patterns of shape change in theinvestigated data set. This phenomenonis not surprising given the fact that CSand temperature were closely andnegatively correlated as a result of the‘temperature-size rule’ (Atkinson 1994,Atkinson et al. 2003). The high temperaturemorphotypes were distinctly smallerand their morphology with shallower incisions wasgenerally less elaborate than in low temperature cells.In addition, this pattern of size to shape relation wassignificant in all the temperature groups and naturalsamples. The plasticity trend of the incisions becomingshallower in M. rotata cells with decreasing cell sizecan, thus, probably be considered as a general featureof size-to-shape dynamics in this species. This morphologicaltrend should be related primarily with sizechange as almost identical size-related morphologicalchanges were observed within the individual temperaturegroups. Different temperature results in the sizedifferences between populations and these, consequently,drive their morphological differentiation.Two explanations were suggested for temperaturesizerule in protists (Atkinson et al. 2003). The surface:volume(S:V) ratio of cells increases with theirdecreasing size. The consumption of resources (carbondioxide, nutrients) is known to be reduced at highertemperatures and an increase in the S:V ratio bydecreasing the cell size can then be considered anadaptive response (Margalef 1954, Spijkerman &Coesel 1998, Cornet-Barthaux et al. 2007). The secondhypothesis, however, presumes that population growthusually increases in protist populations as a consequenceof a higher temperature that lies within therange of normally encountered values (Atkinson 1994,Atkinson et al. 2003). Selection pressure for earlierreproduction — one that is facilitated by earlier completionof the cell cycle and results in the smaller sizeof adult cells — is higher in rapidly growing populationsbecause the offspring of smaller maternal cellsthen would constitute a larger fraction of the total population.This model is applicable especially in populationswith low densities and, consequently, with abun-
Neustupa et al.: Phenotypic plasticity in Micrasterias rotata85dant resources (Atkinson et al. 2003). Thus, a decreasein size related to temperature may be a result of plasticadaptive response connected with increased populationgrowth.Densities of our investigated populations were low,and the distinct size decrease with increasing temperaturecould correspond instead to the temperaturerelatedfaster cell cycle completion model. Moreover,the higher S:V ratio of smaller cells is compensated bytheir shallower incisions (Figs. 3 & 5) and this trendacts against increasing the S:V ratio, which wouldeventually have to facilitate better consumption ofresources according to the first hypothesis. Acceleratedreproduction driven by smaller cell sizes correlateswith their less elaborate shape. These morphologicalcharacteristics are probably a result of fastermorphogenetic processes that lead to generally lessaccented shape features. Thus, our data better correspondto the hypothesis presuming plastic response toselection pressure for earlier reproduction in highertemperatures. However, this hypothesis could only beevaluated using growth rate data of populations fromindividual temperature levels. The positive correlationof the growth rate, temperature and, consequently,size of the cells would decisively support the idea thatthe faster cell cycle completion model provides aplausible explanation of temperature-related plasticityin Micrasterias.The infraspecific shape differences were small inrelation to interspecific differences within the genus asa whole (Fig. 6A). However, the consensual shapes ofindividual temperature groups did not form a clearlyseparated cluster from all the other species as theywere intertwined with Micrasterias papillifera and M.fimbriata. Both of these species belong to a singleclade together with M. rotata in molecular phylogenetictrees, and M. fimbriata is the species most closelyrelated to M. rotata on the basis of molecular data(Neustupa & 2kaloud 2007). The 30°C population waseven more similar to M. papillifera and M. fimbriatathan to the low temperature and natural M. rotata setswhich, again, illustrates its deviation from standardmorphological patterns of the species. All of the naturalM. rotata samples that were collected from Aprilto December were closely similar to shapes of low temperature10 and 15°C cultured populations (Figs. 6B &7). Even if the maximum daily temperatures reached atleast 25°C in 40 d during the summer season of 2004,the average temperature of the warmest month was17.3°C and the lowest daily temperatures were neverhigher than 16°C in the Tábor station, which is theclosest weather station to the sampling locality (15 kmand altitude 430 m a.s.l. [Czech HydrometeorologicalInstitute 2007]). Thus, temperature-related morphologicalvariation in natural populations reflected the averageand lowest night air temperatures instead of themaximum daily levels. Desmids reproduce primarilyduring dark periods by dividing the vegetative cells inthe isthmus plane (Brandham & Godward 1965). Wepropose that night and early morning temperatures ofa shallow pool correlating with air temperature fluctuations(Jacobs et al. 1997) are probably most related tosize and shape properties of cells as they directlyinfluence the morphogenetic processes following thevegetative cells division. Primary wall formation thatprecedes deposition of a rigid cellulose secondary walllasts about 4 to 5 h in Micrasterias (Meindl 1993). Thisperiod probably is crucial for morphological characteristicsof a developing semicell. Resulting morphologythen reflects primarily the actual environmental conditionsof the coldest day period, and the daily maximumtemperatures reaching up to 30°C in June to Augustdid not influence the morphological characteristics ofinvestigated natural populations, whose shapes wereconsistently close to those of low temperature shapesof the 10 and 15°C cultured populations (Fig. 6B). Thisassumption could be evaluated further in experimentalpopulations cultured in controlled fluctuating temperaturesand is a challenge for future research.Micrasterias rotata is a widely distributed freshwaterspecies and has been reported also from tropical wetlandhabitats (e.g. Krieger 1939, Prescott 19<strong>51</strong>) whereyear-long average water temperatures are about 25°C.The morphometric patterns of populations from suchhabitats would especially be of interest for a comparisonwith patterns of cultured high temperature populations.Eventual shape similarity of natural high temperaturepopulations that grow in nutrient-limited andspecies-rich benthic tropical communities with thehigh temperature cultured populations would supportthe hypothesis of universal relevance of temperaturelevels in patterns of morphological differentiation ofthis species.Acknowledgements. This study was supported by grant no.206/05/P139 of the Czech Science Foundation and by theresearch project of the Czech Ministry of Education no.0021620828. We thank the anonymous reviewers for theirrecommendations that led us to the improvements of themanuscript.LITERATURE CITEDAtkinson D (1994) Temperature and organism size — a biologicallaw for ectotherms? Adv Ecol Res 25:1–58Atkinson D, Ciotti BJ, Montagnes DJS (2003) Protistsdecrease in size linearly with temperature: ca. 2.5% °C –1 .Proc R Soc Lond B Biol Sci 270:2605–2611Beszteri B, Ács E, Medlin L (2005) Conventional and geometricmorphometric studies of valve ultrastructural variationin two closely related Cyclotella species (Bacillariophyta).Eur J Phycol 40:89–103Bookstein FL (1991) Morphometric tools for landmark data:
86Aquat Microb Ecol <strong>51</strong>: <strong>77</strong>–86, 2008geometry and biology. Cambridge University Press, CambridgeBrandham PE, Godward MBE (1965) Mitotic peaks andmitotic time in the Desmidiaceae. Arch Microbiol <strong>51</strong>:393–398Cornet-Barthaux V, Armand L, Quéguiner B (2007) Biovolumeand biomass estimates of key diatoms in the SouthernOcean. Aquat Microb Ecol 48:295–308Czech Hydrometeorological Institute (2007) Climate atlas ofCzechia. CHMI, PragueDe Boer MK, Koolmees EM, Vrieling EG, Breeman AM, VanRussel M (2005) Temperature responses of three Fibrocapsajaponica strains (Raphidophyceae) from differentclimate regions. J Plankton Res 27:47–60Gächter E, Weisse T (2006) Local adaptation among geographicallydistant clones of the cosmopolitan freshwaterciliate Meseres corlissi. I. Temperature response. AquatMicrob Ecol 45:291–300Hammer Ø, Harper DAT, Ryan PD (2001) PAST: paleontologicalstatistics software package for education and dataanalysis. Palaeont Electr 4:1–9Jacobs AFG, Jetten TH, Lucassen DC, Heusinkveld BG,Nieveen JP (1997) Diurnal temperature fluctuations in a naturalshallow water body. Agric For Meteorol 88: 269–2<strong>77</strong>Jolliffe IT (1986) Principal component analysis. Springer,New YorkKallio P (1953) On the morphogenetics of the desmids. BullTorrey Bot Club 80:247–263Klingenberg CP, Barluenga M, Meyer A (2002) Shape analysisof symmetric structures: quantifying variation amongindividuals and asymmetry. Evolution 56:1909–1920Krieger W (1939) Die Desmidiaceen Europas mit Berücksichtigungder aussereuropäischen Arten. Dr. L. Rabenhorst’sKryptogamen-Flora von Deutschland, Österreich und derSchweiz. Band 13, Abteilung 1, Teil 2, Lieferung 1.Akademische Verlagsgesellschaft MBH, LeipzigKristensen TN, Pertoldi C, Andersen DH, Loeschcke V (2003)The use of fluctuating asymmetry and phenotypic variabilityas indicators of developmental instability: a test of anew method employing clonal organisms and high temperaturestress. Evol Ecol Res 5:53–68Margalef R (1954) Modifications induced by different temperatureson the cells of Scenedesmus obliquus (Chlorophyceae).Hydrobiologia 6:83–94Editorial responsibility: Patricia Glibert,Cambridge, Maryland, USAMeindl U (1993) Micrasterias cells as a model system forresearch on morphogenesis. Microbiol Rev 57:415–433Monteiro LR, Diniz JAF, dos Reis SF, Araujo ED (2002)Geometric estimates of heritability in biological shape.Evolution 56:563–572Neustupa J, Němcová Y (2007) A geometric morphometricstudy of the variation in scales of Mallomonas striata(Synurophyceae, Heterokontophyta). Phycologia 46:123–130Neustupa J, 2kaloud P (2007) Geometric morphometrics andqualitative patterns in the morphological variation of fivespecies of Micrasterias (Zygnemophyceae, Viridiplantae).Preslia 79:401–417Neustupa J, 2t’astný J (2006) The geometric morphometricstudy of Central European species of the genus Micrasterias(Zygnematophyceae, Viridiplantae). Preslia 78:253–263Potapova M, Hamilton PB (2007) Morphological and ecologicalvariation within the Achnanthidium minutissimum(Bacillariophyceae) species complex. J Phycol 43:561–575Prescott GW (19<strong>51</strong>) <strong>Ecology</strong> of Panama Canal algae. TransAm Microsc Soc 70:1–24Prescott GW, Croasdale HT, Vinyard WC (19<strong>77</strong>) A synopsis ofNorth American desmids, Part II. Desmidiaceae: Placodermae,Section 2. Univ Nebraska Press, Lincoln, NER Core Development Team (2006) R: a language and environmentfor statistical computing. R Foundation for StatisticalComputing, ViennaRohlf FJ (2000) Statistical power comparisons among alternativemorphometric methods. Am J Phys Anthropol 111:463–478Rohlf FJ (2006) Tps series. Department of <strong>Ecology</strong> and Evolution,State University of New York at Stony Brook,New YorkSpijkerman E, Coesel PFM (1998) Ecophysiological characteristicsof two planktonic desmid species originatingfrom trophically different lakes. Hydrobiologia 369/370:109–116Weiss D, Lütz C, Lütz-Meindl U (1999) Photosynthesis andheat response of the green alga Micrasterias denticulata(Desmidiaceae). Z Naturforsch 54C:508–<strong>51</strong>6Zelditch ML, Swiderski DL, Sheets DH, Fink WL (2004) Geometricmorphometrics for biologists: a primer. ElsevierAcademic Press, LondonSubmitted: November 12, 2007; Accepted: February 8, 2008Proofs received from author(s): April 1, 2008
![[Cr(urea)6]Cl3](https://img.yumpu.com/47220263/1/184x260/crurea6cl3.jpg?quality=85)