Manly Lagoon Dredging Project - Manly Council - NSW Government
Manly Lagoon Dredging Project - Manly Council - NSW Government
Manly Lagoon Dredging Project - Manly Council - NSW Government
- No tags were found...
You also want an ePaper? Increase the reach of your titles
YUMPU automatically turns print PDFs into web optimized ePapers that Google loves.
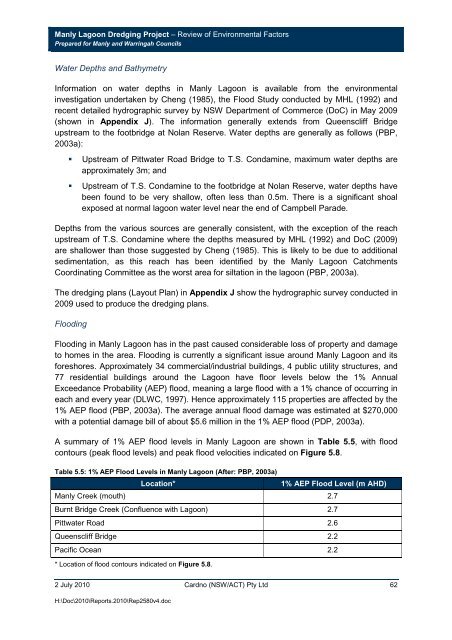
<strong>Manly</strong> <strong>Lagoon</strong> <strong>Dredging</strong> <strong>Project</strong> – Review of Environmental FactorsPrepared for <strong>Manly</strong> and Warringah <strong>Council</strong>sWater Depths and BathymetryInformation on water depths in <strong>Manly</strong> <strong>Lagoon</strong> is available from the environmentalinvestigation undertaken by Cheng (1985), the Flood Study conducted by MHL (1992) andrecent detailed hydrographic survey by <strong>NSW</strong> Department of Commerce (DoC) in May 2009(shown in Appendix J). The information generally extends from Queenscliff Bridgeupstream to the footbridge at Nolan Reserve. Water depths are generally as follows (PBP,2003a):Upstream of Pittwater Road Bridge to T.S. Condamine, maximum water depths areapproximately 3m; andUpstream of T.S. Condamine to the footbridge at Nolan Reserve, water depths havebeen found to be very shallow, often less than 0.5m. There is a significant shoalexposed at normal lagoon water level near the end of Campbell Parade.Depths from the various sources are generally consistent, with the exception of the reachupstream of T.S. Condamine where the depths measured by MHL (1992) and DoC (2009)are shallower than those suggested by Cheng (1985). This is likely to be due to additionalsedimentation, as this reach has been identified by the <strong>Manly</strong> <strong>Lagoon</strong> CatchmentsCoordinating Committee as the worst area for siltation in the lagoon (PBP, 2003a).The dredging plans (Layout Plan) in Appendix J show the hydrographic survey conducted in2009 used to produce the dredging plans.FloodingFlooding in <strong>Manly</strong> <strong>Lagoon</strong> has in the past caused considerable loss of property and damageto homes in the area. Flooding is currently a significant issue around <strong>Manly</strong> <strong>Lagoon</strong> and itsforeshores. Approximately 34 commercial/industrial buildings, 4 public utility structures, and77 residential buildings around the <strong>Lagoon</strong> have floor levels below the 1% AnnualExceedance Probability (AEP) flood, meaning a large flood with a 1% chance of occurring ineach and every year (DLWC, 1997). Hence approximately 115 properties are affected by the1% AEP flood (PBP, 2003a). The average annual flood damage was estimated at $270,000with a potential damage bill of about $5.6 million in the 1% AEP flood (PDP, 2003a).A summary of 1% AEP flood levels in <strong>Manly</strong> <strong>Lagoon</strong> are shown in Table 5.5, with floodcontours (peak flood levels) and peak flood velocities indicated on Figure 5.8.Table 5.5: 1% AEP Flood Levels in <strong>Manly</strong> <strong>Lagoon</strong> (After: PBP, 2003a)Location*1% AEP Flood Level (m AHD)<strong>Manly</strong> Creek (mouth) 2.7Burnt Bridge Creek (Confluence with <strong>Lagoon</strong>) 2.7Pittwater Road 2.6Queenscliff Bridge 2.2Pacific Ocean 2.2* Location of flood contours indicated on Figure 5.8.2 July 2010 Cardno (<strong>NSW</strong>/ACT) Pty Ltd 62H:\Doc\2010\Reports.2010\Rep2580v4.doc


