Mega Millions Lottery
Mega Millions Lottery
Mega Millions Lottery

You also want an ePaper? Increase the reach of your titles
YUMPU automatically turns print PDFs into web optimized ePapers that Google loves.
<strong>Mega</strong> <strong>Millions</strong> <strong>Lottery</strong>Minitab Project 1The <strong>Mega</strong> <strong>Millions</strong> game is a lottery game that is played by picking 5 balls between 1and 52 and additional megaball between 1 and 52. The cost per game is $1. The currentversion of <strong>Mega</strong> <strong>Millions</strong> began on May 17, 2002. Use only data from May 17, 2002 orlater for this project. Since the lottery is played twice a week, the longer you wait to getstarted on this, the more data you will have to collect. Once you start answering thequestions, stop gathering data.Each person in your team should pick one lottery number. Pick your numbers BEFOREyou gather the information. This information will be used later to see how well youwould have done if you would have played the <strong>Mega</strong> <strong>Millions</strong> <strong>Lottery</strong> twice a weeksince May 17, 2002.Name Ball 1 Ball 2 Ball 3 Ball 4 Ball 5 <strong>Mega</strong>ballInformation about the <strong>Mega</strong> <strong>Millions</strong> game can be found athttp://www.biggamelottery.com/Gathering the data (10 points)Visit the "Prior Results" page and enter the winning numbers into Minitab.You can really speed this up if you will use Internet Explorer on the same computer asMinitab and follow these directions. Open both Minitab and Internet Explorer.In Internet Explorer, highlight the 26 drawings it gives you at a time, copy it (control-Cor Edit/Copy), switch to Minitab, and then paste it (control-V or Edit/Paste). When youpaste, make sure you are in the data section and not the variable name section (make sureyou start in row 1) and tell it to "use spaces as delimiters". Switch back to InternetExplorer and get the next set of data. Repeat this process until you have all of theinformation back through May 17, 2002.
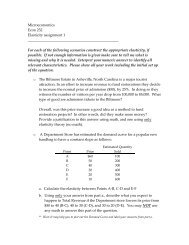
When you are all done pasting in the information, then highlight the columns you don'tneed (by clicking on the column name at the top [example: C1-T] and hitting delete.Finally label the variables as ball1, ball2, ball3, ball4, ball5, and megaball.Label a blank column as "classes". Right click the mouse button on the column andchoose Format Column / Text. In this column, enter the class limits for thirteen classesof width four, starting at 1 and ending at 52. The first few would be 1-4, 5-8, 9-12 andthe last would be 49-52.Save your data into the R:\01\LOTTERY folder. Pick a name unique to your group. Besure to periodically save your projects and your Word document. You do not need tosave the graphs within Minitab once you have copied them into Word.Descriptives (35 points)HistogramsCreate six histograms, one for each ballincluding the megaball. Copy each histogramand paste it into a Word document. For eachhistogram describe the distribution using termslike uniform (flat), bell shaped, triangular,skewed to the right, skewed to the left, etc. Asample histogram is shown to the right.Instructions for Histogramsball 1 is skewed to the right1. Go to Graph / Histogram2. Click in the X column for graph 1 and then select ball1. Put ball2 into graph 2,ball3 into graph 3, ball4 into graph 4, ball5 into graph 5, and megaball into graph6.3. (Optional but recommended) Click on Edit Attributes and change the fill type tosomething other than solid. You may also change the fore color to somethingother than black if you want to. Hint: If you will highlight the entire column byclicking on the heading and then click on the down arrow, you can change all ofthe graphs at once. If you don't highlight the column first, you will only changethe graph that is highlighted. Click OK when done.4. Click on Annotation / Show Data Labels, and check the Show Data Labels box.Click OK.5. Click on Options. Change the Type of Intervals to Cutpoint and the Definition ofIntervals to Midpoint/Cutpoint positions. Enter 0.5:52.5/4 for the definition. This
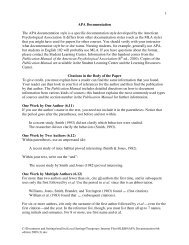
will generate 13 classes from 1 to 52 with a class width of 4. Click OK.6. Click on Frame / Min and Max. Change the minimum X to 0.5 and the maximumX to 52.5. Click OK.7. Click on Region / Data. Change the minimum X and Y to be 0.15 and themaximum X and Y to be 0.95. Click OK.8. Click on Frame / Tick. Make the following changes to Tick 1 (the X's): On thetop section, change the number of Major ticks to 14 and the number of Minor ticksto 0. On the bottom section, change the Labels to "classes" (without the quotes),the Text Size to 0.8, the Horizontal Placement to the right of (click on the cell andthen click the down arrow button) and the Vertical Placement to below. Click OK.9. Click OK to generate the graphs.10. Copy each graph with Control-C (or Edit / Copy), switch to Word, and Paste withControl-V (or Edit / Paste). Describe the shape of the distribution. Repeat for theother five graphs.BoxplotMake a boxplot with each of the five balls on it.Instructions for Boxplot1. Go to Manip / Stack / Stack Columns. Stack columns ball1-ball5 and store themin a new worksheet called combined (or something similar). Uncheck the "usevariable names in subscript column". Click OK.2. Switch to the original data window and copy the classes column. Switch back tothe new worksheet and paste the classes column into a blank column.3. Rename the "subscripts" column to be "ball number" and label the C2 column as"value".4. Go to Graph / Boxplot5. Graph the value (Y) vs the ball number (X).6. (Optional) Click Edit Attributes and changethe fill and fore color. Click OK.7. Click on Region / Data and change theminimums to 0.15 and the maximums to0.95. Click OK.8. Click OK.9. Copy the graph and paste it into Word.Describe what you see from the boxplot.
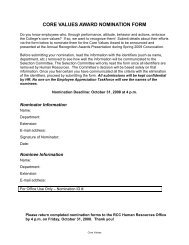
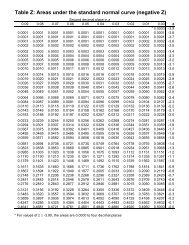
Checking NormalitySee if ball 3 and the megaball are normally distributed.We've already looked at the histogram, but there are other ways that we can checknormality. This technique uses the normal probability plot and the Anderson Darlinghypothesis test.Read section 5.7 for instructions on how to interpret the normal probability plot (alsoknown as a QQ plot or quantile-quantile plot). The null hypothesis for the AndersonDarling test is that the data is normally distributed. You'll have to decide, based on thep-value, whether your data is too unusual for that assumption to be true.Instructions for checking normality1. Make sure the active spreadsheet is theoriginal data.2. Go to Stat / Basic Statistics / NormalityTest.3. Select the ball3 variable and click OK.4. Copy the graph and paste it into Word.5. Repeat the process, except this time use themegaball variable.6. Interpret both graphs.Descriptive StatisticsGive summary statistics for each of the five balls and the megaball.This section is pretty straight forward so I'm not giving sample output.Instructions for Descriptive Statistics1. Go to Stat / Basic Statistics / Display Descriptive Statistics2. Select all five balls and the mega ball for the variables. Click OK.3. Highlight the output, copy, switch to Word, and paste it.4. Explain anything interesting you see in the data.
Uniform DistributionSupposedly, the balls in the lottery have a uniform distribution. This means that eachball occurs with equal frequency. One of the assumptions of a uniform distribution isthat the mean is the midpoint between the high and low values (also known asmidrange). For the lottery that should be (52+1)/2 = 26.5. So we'll test to see if themean of the different games is 26.5. The null hypothesis is that the mean is 26.5. If yourresults are too unusual, then you'll have to reject that assumption.Instructions for Checking Mean1. Label two blank columns as "mean" and "st dev"2. Go to Calc / Row Statistics3. Choose the mean, use ball1 through ball5 for the input variables, and store theresult in the "mean" column.4. Repeat steps 2 and 3 except calculate the standard deviation and store it into the"st dev" column.5. Go to Stat / Basic Statistics / 1-Sample t.6. Choose "mean" for the variable and enter 26.5 as the test mean. Click OK.7. Copy the output and paste it into Word.8. Interpret the results based on the p-value.Another assumption is that the standard deviation of a uniform distribution isσ =max−min1252.5 − 0.5σ = ≈ 15.01112. For the lottery, that would be . Okay, Iknow you're saying the max is 51 and the min is 1, but the uniform is technically acontinuous distribution, not a discrete one, so we go with the boundaries instead of thelimits. Remember earlier when we were setting the cutpoints for the histograms ... weused 0.5 and 52.5. Anyway, we're going to look at the standard deviations and see ifthey're close to 15.011. Unfortunately (for statisticians although you'll probablyappreciate it), Minitab won't compare a standard deviation the way that it does formeans. This means that we're going to have to just eyeball the results and see if it seemsreasonable.Instructions for Checking the Standard Deviation1. Find the descriptive statistics for the "st dev" variable.2. Copy the output and paste it into Word.3. Look at the mean of the variable. Does is seem close to 15.011? Comment onwhether it looks unusual or close enough to be considered normal variation.
Your WinningsHere's where we check the numbers that your team picked and see how well you do.Instructions for checking your winnings1. Go to the website for the Big Game <strong>Lottery</strong> and click on Search.2. Enter the numbers for the players on your team3. Click "Search Prior Results"4. Record the number of times May 17, 2002, or later that you would have won eachof the prizes into a table similar to the one shown below. Ignore those prizesbefore May 17, 2002.5. Make a table in Word that summarizes your winnings (see below).6. Analyze the winnings to come up with the total winnings, total amount spent, andaverage winning (or loss).Sample OutputFrequency of prizes for the numbers5-9-15-18-29 [12] and 1-8-26-32-50 [45]Prize Jackpot $175K $5,000 $150 $10 $7 $3 $2# 0 0 0 0 0 1 0 1The total winnings for our group were $9. We played 2 tickets for 115 games or 230tickets, so it cost us $230 to play. Our net winnings are -$221. Our average winningsper game is -$221 / 230 = -$0.96 or a loss of 96¢ for each $1 played.Final ReportMake sure your names are at the top of the Word document. Describe the dates forwhich you collected your lottery information (May 17, 2002 through ____ ) and thenumber of lottery drawings there were during that time.Print out the report and give it to the instructor.
Evaluations (5 points)Each student should do the following. This portion is not a group effort, it is anindividual activity. It must be typed and printed, no handwritten papers.! Put your name and section at the top of the paper! For each person in your group (including yourself), give their name and assignthem a score between 0 (lowest) and 5 (highest) for their effort in making thisproject a success. Then write a short paragraph about what each personcontributed and why they deserve the grade you're giving them.Example Evaluation:Steve Jackson – 5I am a hard worker who really knew how to use the computer to do Minitab and Word. Iwasn't very good at understanding the statistical side of things but I was a good organizerand kept us on task. I was always there and stayed late a few times.Bob Smith – 1Bob is a bum! I don't know why I ever picked him to be in my group. I should haveknown better than to pick the person who sat next to me as a partner. Bob missed half ofthe class periods we spent working on this project. When we did work together in class,he was playing on his cell phone instead of helping with the project. The only reason hegets 1 point is because he knew that a p-value < 0.05 meant to reject the null hypothesis.Due DatesThis project and the evaluations are due Tuesday, July 8, 2003.