Materials Measurement Phil Bartley Shelley Begley
Materials Measurement Phil Bartley Shelley Begley
Materials Measurement Phil Bartley Shelley Begley
- No tags were found...

Create successful ePaper yourself
Turn your PDF publications into a flip-book with our unique Google optimized e-Paper software.
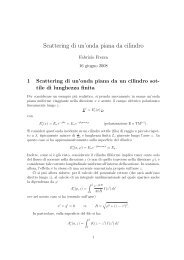
"ε rCole-Cole Plots (Water)4023.720 oC9.14Increasingf (GHz)34.9302060 C34.923.74.63o4.633.259.14101.740.58'ε r001020 30 40 50 60 70 80 90The complex permittivity may also be shown on a Cole-Cole diagram byplotting the imaginary part (ε r”) on the vertical axis and the real part (ε r‘) onthe horizontal axis with frequency as the independent parameter. Above areCole-Cole plots for water for two temperatures. The curves are theoretical,but show also measurement points.A material that has a single relaxation frequency as exhibited by the Debyerelation will appear as a semicircle with it center lying on the horizontal ε r”=0 axis and the peak of the loss factor occurring at l/τ. A material withmultiple relaxation frequencies will be a semicircle (symmetric distribution) oran arc (nonsymmetrical distribution) with its center lying below the horizontalε r” = 0 axis.For high-loss materials, both ε r‘ and ε r” change dramatically with frequency.A Cole-Cole plot (similar to a Smith chart) is often used to plot the“frequency response” of materials. Simple lossy materials (e.g. water) scribea semi-circle on a Cole-Cole plot. More complex materials may form anellipse, or an arc with bumps on it. The two traces demonstrate that ε r‘(forwater) changes dramatically with temperature. as well as frequency.23