Materials Measurement Phil Bartley Shelley Begley
Materials Measurement Phil Bartley Shelley Begley
Materials Measurement Phil Bartley Shelley Begley
- No tags were found...

You also want an ePaper? Increase the reach of your titles
YUMPU automatically turns print PDFs into web optimized ePapers that Google loves.
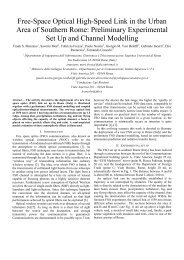
Extremely Diverse Applications“<strong>Materials</strong>” can mean just about anything. They are produced or used bymany diverse industries. For example, customers use network analyzers tomeasure:radar-absorbing “stealth” coatingsdisposable diaperscookie doughmoisture in asphalt roadsceramics for microwave sintering/annealingwashed coalcementbiological tissues (including blood, brain tissue simulation)many, many othersWhat can these people have in common???Only one thing: Need to measure the dielectric properties!!!Extremely Diverse"<strong>Materials</strong>" can mean just about anything. They are produced or used by manydiverse industries. Our customers use Agilent network analyzers to measurevery “unexpected” for us things.What can these people have in common??? Only one thing: Electro-magneticmeasurements, from 20 Hz to 100 GHz, provided useful information abouttheir material - better, faster, and more accurately than other methods.3
<strong>Measurement</strong>s are:FastSetup in minutes, measure in seconds.Non-DestructiveMany materials can be measured “as is”.No sample preparation requiredNon-ContactingWith Free-Space techniques, your material is not eventouched!The best part is that measurements can be setup in minutes andmade in seconds (or less) providing real time data. Depending onmeasurement technique, measurements can be non-destructive,and even non-contacting. Later in this presentation, we will showyou examples of these techniques.5
Maxwell’s Equations∇× E=−∂B∂ t∇× H= ∂ +∂ D Jt∇• D=ρ∇• B=0James Clerk MaxwellEverything we are going to talk about today, starts here. I’m sure you all recognizeMaxwell and his famous equations. We won’t go into detail, but due diligencedemands we at least give mention.The solution of Maxwell’s equations determines how microwave energy propagatesthrough a material. Maxwell’s equations can be expressed in many equivalent forms.Its most general form is listed here.Where:J is the current densityE is the electric field intensityD is the electric flux densityH is the magnetic intensity fieldB is the magnetic flux densityp is the charge densityThese equations are based on Faraday’s law and Ampere’s law. These equations arealways satisfied.6
Constitutive RelationsD=εEB=µ HJ=σEOther factors that make the solution unique to a particular situation are the boundaryconditions and the satisfaction of the following constitutive relations. e, u, and s are,respectively, the permittivity, permeability and conductivity of the media. These arecommonly referred to as the electromagnetic properties of the material. Manymaterials are non-magnetic. The consequence of this is that µ is known. At highfrequencies, the effect of σ can be ignored. This is because its effect varies inverselywith frequency. This is true for most non-conductive materals. The exception is formetals.7
Permittivity and Permeability DefinitionsPermittivity(Dielectric Constant)κ =εε0'r= ε = ε −"rinteraction of a material in thepresence of an external electricfield.rjεPermeabilityµ ' "µ = = µ r − jµ rµ0interaction of a material inthe presence of an externalmagnetic field.Permittivity (e), also called dielectric constant, describes the interaction of a materialwith an electric field. Dielectric constant (k) is equivalent to relative permittivity (e r )or the absolute permittivity (e) relative to the permittivity of free space (e 0 ). The realpart of permittivity (e r ’) is a measure of how much energy from an external electricfield is stored in a material. The imaginary part of permittivity (e r ”) is called the lossfactor and is a measure of how dissipative or lossy a material is to an external electricfield.Its fundamental dimensions are T 2 Q 2 M -1 L -3 where T, Q, M and L are time, charge,mass and length respectively. Normally this is expressed as farad per meter(capacitance per distance).Dielectric “Constant” is not constant over frequency or temperature!The complex permeability (µ) consists of a real part µ’) that represents the energystorage and a an imaginary part (µ“) that represents the energy loss term. Relativepermeability (µ r) is the absolute permeability (µ) relative to the permeability of freespace (µ 0). Some materials such as iron (ferrites), cobalt, nickel and their alloys haveappreciable magnetic properties; however, many materials are non-magnetic. Allmaterials, on the other hand, have dielectric properties.8
Electromagnetic Field InteractionElectricFieldsPermittivityr'rε = ε −jε"rDielectric ConstantSTORAGELOSSMUTSTORAGELOSSMagneticFieldsPermeability'r"rµ r = µ − jµWhen electric and magnetic fields pass through a material, each can interact withthat material in two ways:Storage: Energy may be exchanged between the field and the material, in a bidirectional(lossless) mannerLoss: Energy may be permanently lost from the field, and absorbed in the material(usually as heat)The electric interactions are quantified by permittivity (e r ), also called dielectricconstant (k). The magnetic properties are described by permeability (m r ). These arecomplex numbers with real and imaginary parts:♦Real Part: Represents storage term; denoted with ‘♦Imaginary Part: represents loss term; denoted with “.This presentation focuses on permittivity, since most of the common materials arecompletely non-magnetic.9
Definition of Dielectric Constant or PermittivityPermittivity describes the interaction of a materialin the presence of an electric field.κ =εε0r'r= ε = ε −jε"rstorageloss'ε rMeasure of how muchenergy from an externalelectric field is stored in thematerial."ε rMeasure of how muchenergy from the electric fieldis lost.The dielectric properties, or permittivity, is one of the factors thatdetermines how a material interacts with an appliedelectromagnetic field…Permittivity (e) describes the interaction of a material with anelectric field. Dielectric constant (k) is equivalent to relativepermittivity (e r) or the absolute permittivity (e) relative to thepermittivity of free space (e 0). The real part of permittivity (e r’) is ameasure of how much energy from an external electric field isstored in a material. The imaginary part of permittivity (e r”) iscalled the loss factor and is a measure of how dissipative or lossya material is to an external electric field.Its fundamental dimensions are T 2 Q 2 M -1 L -3 where T, Q, M and Lare time, charge, mass and length respectively. Normally this isexpressed as farad per meter (capacitance per distance).Dielectric “Constant” is not constant over frequency ortemperature!10
Loss Tangent''ε rε r'ε rεrκ"tanδ = ='ε κ '"r1tanδ = D = =QEnergy Lost per CycleEnergy Stored per CycleDDissipation FactorQQuality FactorAnother term will talk about is loss tangent. When complex permittivity is drawn as asimple vector diagram, the real and imaginary components are 90 o out of phase. Thevector sum forms an angle d with the real axis (e r ’). The relative “lossiness” of amaterial is the ratio of the energy lost to the energy stored.Here: tand = loss tangent = tan delta = tangent loss = dissipation factorIn some cases is used the term “quality factor or Q-factor” with respect to anelectronic microwave material.11
Dielectric MechanismsIonic PolarizationTCl-Na+Cl-Na+Na+ Cl-Cl-Na+F−E+FNa+Cl- Na+ Cl- Na+ Cl- Na+ Cl-EOrientationPolarization(Dipole Rotation)Electronic or AtomicPolarization-+ + E -A static electric field will exercise torque on the electricdipole which will tend to align this dipole in the directionof the field. If the field changes the direction, so will thetorque. The friction accompanying the orientation of thedipole will contribute to the dielectric losses.12
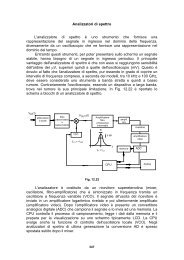
Mechanisms vs. Frequency'ε rIonic Ionic Conductivity and and Electric Electric PolarizationDipolar(Rotational)+++-Ionic''ε r-Atomic-Electronic10 3 10 6 10 9 10 12 10 15 f, HzMWIR V UVThis plot illustrates how the dielectric properties of the salt/water mixture varies with thefrequency of the applied electric field. The dielectric properties of a material isrepresented by a complex quantity known as permittivity. A material’s permittivity isusually normalized to the permittivity of a vacuum. The real part of permittivity, e r ’, is ameasure of the energy stored and is called the dielectric constant. The imaginary partof permittivity, e r ’’, is a measure of the energy loss and called the loss factor.At low frequencies, the water molecules can follow the applied electric field resulting inmaximum values of e r ’. This polarization is a form of energy storage. At these samefrequencies, the positive and negative ions move in accordance to the electric field.This electric current corresponds to an energy loss.As the frequency increases the water molecules can no longer keep up with thechanging electric field. This results in less energy storage and higher rotational losses.At these frequencies the mass of the ions prevents them from responding the thechanging electric field.At even higher frequencies the water molecules no longer respond to the electric field .Permittivity usually is measured at frequencies below 10 11 Hz. At frequencies abovethis the water molecules are stretched. At even higher frequencies the water moleculesare pulled apart.13
Consider Dipole RotationRandom OrientationJust as an example, consider the molecular structure of water. Iapologize to all chemists for the cartoon depiction of this simplemolecule. It does, however, serve to illustrate the concept of amaterial’s dielectric properties. The water molecule consists oftwo hydrogen atoms and one oxygen atom. While the molecule iselectrically neutral it’s charge distribution is not constant over itsvolume. Because of its bonding mechanism, the hydrogen side ofthe molecule is more positive that the oxygen side. In theabsence of any forces other than thermal energy, a group ofwater molecules will take on a random orientation as depicted.14
Constant Electric FieldEDipoles Align with FieldIf a constant electric field is applied to this group of watermolecules they will tend to orient with the applied field. Thisorientation, or polarization, stores some of the energy from thefield.15
Electric Field Changed DirectionEDipoles Rotate to Align with New Field DirectionIf the direction of the field changes, the water molecules will rotateand realign in the new direction. During this rotation, some of theenergy is lost to heat due to friction.When the electric field is removed, the molecules will relax andafter some finite time, resume a random orientation again.If we apply a field that is changing sinusoidally, the molecules willalign when the field is at it’s positive peak, start to relax when thefield is at its zero point, rotate to re-align with the new direction ofthe field at it’s negative peak, and start to relax again, over andover. If the period is long enough, the molecules will be able tokeep up, but as the period gets shorter, they will not be able tocompletely rotate before the field starts to change again.Eventually they will stop rotating altogether.All these properties are dependant on the structure of themolecule.16
If the Molecular Structure Changes, so do theDielectric PropertiesConsider adding sodium chloride to the water molecules. Thebonds of the salt crystals will break when added to the watercreating positive and negative ions. The ions will tend to alignthemselves with the positive or negative regions of the liquidwater. The sodium chloride will change the way the waterinteracts with the electric field.17
Small and Large MoleculesMany materials are a mixture of different sized molecules. Thepermittivity of these mixtures of materials will depend on theinteraction of these molecules, their mass, charge and chargedistributions.18
Emulsions and EncapsulationThe many structure features and characteristics of colloids can berelated to permittivity measurements.19
ε rε' '',r6040Debye Relaxation for Water at 30 o CDebye equation:'ε rε ( ω)εs−εε∞+1+jωτ=∞ε sThe static (DC) value ofdielectric constant or ε for f = 0ε ∞= 76.47= 4.9the optical (infinite frequency)dielectric constant or ε for f =∞20"ε r0.1 1 10 100f, GHzω = 2πfthe angular frequencyτ = 7.2psecthe relaxation timeThese are theoretical curves calculated using the Debye relaxation model forwater at 30 degrees C. This model works very well for water.At low frequencies, the dipoles can “follow” the field and ε’ will be high.At high frequencies, the dipoles can not follow the rapidly changing field -and ε’ falls off. The resonance character of the attenuation (the imaginarypart of the dielectric constant) can be explained in a similar way. Before theresonance the loss is increasing because the dipoles still can totally orientwhen the electric field changes direction, so the loss is proportional to thefrequency. After resonance the frequency is so high that the dipoles do nothave enough time to orient, so there is less friction and less losses.20
Relaxation Constant ττ = Time required for1/e of an alignedsystem to return toequilibrium or randomstate, in seconds.ε100'r10Water at 20 o Cτ1 1 =ω 2πc f c"ε rmost energy is lost at 1/τ=1110 100f, GHzDebyeequation :ε ( ω)εs−εε∞+1+jωτ=∞Of interest to material heating is the relaxation constant or time, τ. Fordipolar dielectrics (such as water), τ describes the time required for dipolesto become oriented in an electric field. (Or the time needed for thermalagitation to disorient the dipoles after the electric field is removed.)•At low frequencies, the dipole rotation can follow the field easily; ε’ will behigh and ε” will be low. As the frequency increases, the loss factor, ε”increases as the dipoles rotate faster and faster.• The loss factor ε” peaks at the frequency 1/τ. Here, the dipoles are rotatingas fast as they can, and energy is transferred into the material and lost to thefield at the fastest possible rate.•As the frequency increases further, the dipoles can not follow the rapidlychanging field and both ε’ and ε” fall off.τ is one of the terms needed in the Debye equation that is often used tomodel the theoretical permittivity of polar liquids. This model works very wellfor water. The other terms are the predicted value of ε s , the DC or staticvalue of permittivity, and ε at infinity.21
Cole-Cole Plot Explanation"ε r302010εεs−ε2"∞r max= =35.8Increasingf (GHz)ε(ω)εs−εε∞+1+jωτ=∞Center0 10 20 30 40 50 60 70'ε rε = 4.9= 76. 47∞ε sLet’s study some important properties of the Cole-Cole plot of Debye model.From the Debye equation we can calculate the er’ for frequency 0 andinfinity.Debye equation :ε ( ω)For ω = 0, ε (0)= ε sεs−εε∞+1+jωτ=∞Forω = ∞,ε ( ∞)= ε∞The curve is half circle with center on the x axis and radiusThe maximum imaginary part of the dielectric constant will be equal to theradiusThe frequency moves counter clock wise on the curve.22
"ε rCole-Cole Plots (Water)4023.720 oC9.14Increasingf (GHz)34.9302060 C34.923.74.63o4.633.259.14101.740.58'ε r001020 30 40 50 60 70 80 90The complex permittivity may also be shown on a Cole-Cole diagram byplotting the imaginary part (ε r”) on the vertical axis and the real part (ε r‘) onthe horizontal axis with frequency as the independent parameter. Above areCole-Cole plots for water for two temperatures. The curves are theoretical,but show also measurement points.A material that has a single relaxation frequency as exhibited by the Debyerelation will appear as a semicircle with it center lying on the horizontal ε r”=0 axis and the peak of the loss factor occurring at l/τ. A material withmultiple relaxation frequencies will be a semicircle (symmetric distribution) oran arc (nonsymmetrical distribution) with its center lying below the horizontalε r” = 0 axis.For high-loss materials, both ε r‘ and ε r” change dramatically with frequency.A Cole-Cole plot (similar to a Smith chart) is often used to plot the“frequency response” of materials. Simple lossy materials (e.g. water) scribea semi-circle on a Cole-Cole plot. More complex materials may form anellipse, or an arc with bumps on it. The two traces demonstrate that ε r‘(forwater) changes dramatically with temperature. as well as frequency.23
Other Empirical ModelsταβOnly few materials exhibit pure relaxation properties with singlerelaxation time that are described with the Debye equation.εε( ω)( ω)εs−ε∞ε∞+1+j=1−( ωτ ) αεs−ε∞= ε +∞( 1+jωτ) βthe relaxation time constantthe relaxation width (distribution parameter)The Cole-Cole model isused in determination ofuser defined standard forcoaxial dielectric probe.Cole-Davidson modeldistribution parameter that leads to asymmetric distribution of τOnly few materials exhibit pure relaxation properties with single relaxationtime that are described with the Debye equation. There are many otherempirical expressions that will describe better the frequency dependentbehavior of materials with more than one relaxation times or distribution ofrelaxation times. Such are the Cole-Cole equation and Cole-Davidsonequation.Based on the above equation the Cole-Cole model is used for determining ofa user-defined standards for coaxial probes.24
Comparison Between the Different Models"ε r3020Cole-Cole α = 0.2Debye10Cole-Davidsonβ = 0.510 20 30 40 50 60 70'ε rThis is theoretical calculation of the different models, represented withequations on the previous slide. The values of a and b are chosen to showthe difference between the models and necessarily does not represent25
Dielectric Properties (at 3 GHz)10050TiO2Low LossLossyWaterSaltWater'ε r201052Air1.00001SteakAluminaAlcoholPC BoardQuartzWood20%MylarIce10%Teflon0%.0001 .001 .01 .1 1" /tanδ = ε r ε'rThis graph has ε r’ (storage) along the vertical axis, and tanδ (loss) on thehorizontal axis (both logarithmic). The values for several common materialsare shown as dots (at a single frequency and temperature).“Low-loss” materials, such as Teflon, have small values of tan δ. They arecommonly used in electronic applications such as: insulators (e.g. forcables), substrates, and dielectric resonators.“High-loss” materials include water, food, and many natural materials.These materials quickly absorb microwave energy, and so are not used forelectronic components. However, they are important to:♦ understanding microwave radiation in the “real world”♦ material analysis (e.g. moisture content)♦ high-power microwave processing (heating and drying)26
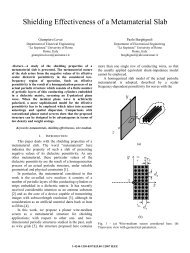
<strong>Measurement</strong> TechniquesCapacitanceCoaxialProbeTransmissionLine & FreeSpaceResonantCavityHere’s a quick look at some methods and fixturing used to measure dielectricproperties of materials. Clockwise from the upper left.1. Capacitance: Uses a parallel plate capacitor, with the material sandwichedbetween. This method uses an impedance analyzer. It is typically used at thelower frequencies, below 1 GHz.2. Coaxial probe: This method uses an open ended coaxial probe, usually with anetwork analyzer. It is the easiest method to use for liquids, or soft semi-solids,although very flat hard solids can be measured as well. Agilent offers probes inthe RF to microwave frequencies, 200MHz to 50GHz.3. Resonant Cavity: This method uses a resonant cavity for the sample holder, and anetwork analyzer to measure the resonant frequency and Q of the cavity, bothempty and with the sample present. From this, permittivity can be calculated.This method has the best loss factor resolution.4. Transmission Line: This method can use a variety transmission “lines” for sampleholders with a network analyzer. Lines can be coaxial, waveguide and even freespaceis considered a transmission line technique. It is useful for a broadfrequency range, from the low microwave region to mm-wave.27
Which Technique is Best? Frequency of interest Expected value of ε r Required measurement accuracy Material properties (i.e., homogeneous, isotropic) Form of material (i.e., liquid, powder, solid, sheet) Sample size restrictions Destructive or nondestructive Contacting or noncontacting TemperatureWhich technique is best depends on many things. Each method has it’s ownstrengths and limitations that make it more or less useful for a particularapplication The rest of this presentation will attempt to give the informationneeded to make the best decision.28
Parallel Plate Capacitor System'rε =CAε0tLCR or ImpedanceAnalyzerDielectric Test Fixturetanδ =DAtThe first technique we will look at is the parallel plate capacitor technique.The sample is placed as the dielectric inside a parallel plate capacitor.Permittivity is calculated from knowing the area of the plate and thethickness of sample, and measuring the capacitance using an LCR orImpedance analyzer. In some analyzers the calculation is automated.29
Impedance Analyzers and FixturesHere is a picture of a typical analyzer and parallel plate capacitor fixture setup. The fixture is ideal for small thin sheet samples. These fixtures operateat low frequencies < 1Ghz.30
Parallel Plate SummaryFrequency Range: 40 Hz – 1 GHz (high end limited by fixtures)Instrument: Impedance AnalyzerAccuracy: typically ±1% for ε r’ and 5% ± 0.005 for tanδRelatively simplecomputation of ε rfromCapacitance andDimensions, or automated inanalzyer.Low frequency only.Works well for thin sheets,PC boards and films..The parallel plate technique works best for thin sheet materials that caneasily be sandwiched between the plates of a capacitor. Accuracy andlow loss resolution is very good, but it is generally limited to lowfrequencies.31
<strong>Measurement</strong> Techniques that use a VectorNetwork Analyzer• Transmission Line and Free-space• Coaxial Probe• Resonant CavityAt the higher frequencies, a network analyzer is used. The next threetechniques we will discuss use a vector network analyzer.32
Transmission Line SystemComputer(not required for PNA)Network AnalyzerGPIB or LAN8507IE SoftwareSample holderconnected between coax cablesA typical transmission line system consists of a vector network analyzer anda sample holder connected between the two network analyzer ports..Software calculates permittivity from calibrated full 2 port S-parametermeasurements. Agilent offers this software and several varieties oftransmission line sample holders. .33
Transmission LineMaterial assumptions:Reflection(S )11lTransmission(S )21 sample fills fixture cross section no air gaps at fixture walls smooth, flat faces, perpendicular tolong axis Known thickness > 20/360 λThe material sample is assumed to completely fill the cross section of thefixture with no air gaps, have smooth flat faces and to be uniform throughout.Coaxial airline fixtures are broadband, but the samples are more difficult tomachine. Waveguide fixtures extend to the mm-wave frequencies and thesamples are simpler to machine, but their frequency coverage is banded.Because the coax and waveguide transmission line size scales withfrequency, the practical sample size determines the frequency limits.Waveguides at frequencies much lower than 5GHz start to get very large,and a large sample is needed. Below 1GHz for many materials, samplelength also becomes an issue. The sample must be long enough to containenough of the wavelength of interest to be measurable, 20 degrees at least,but ideally 180 degrees, or ½ λ. At frequencies above 75GHz, both coaxialand waveguide dimensions get very small, and it becomes too difficult tomachine the tiny samples.34
Transmission Line Sample HoldersCoaxialWaveguideTransmission line sample holders can be made from coaxial airlines orwaveguide straight sections. Both are widely available in differentfrequencies from Agilent and other connector manufacturers. Samples mustfit inside. This technique works best for hard solids that can be machined. Itis possible, although more difficult, to contain liquids and powders insidethese. Coax sample holders offer broadband frequency coverage, but it ismore difficult to machine solid materials to the shape needed to fit inside.Waveguide straight sections offer banded frequency coverage, but it is mucheasier to machine solid materials to fit inside.35
Transmission Algorithms in 85071EOptimumAlgorithm Measured OutputLengthNicolson-Ross S 11 ,S 21 ,S 12 ,S 22 λ g /4 ε r and µ r(PN 8510-3) (or S 11 ,S 21 )Precision (NIST) S 11 ,S 21 ,S 12 ,S 22 nλ g /2 ε rFast S 21 ,S 12 nλ g /2 ε r(S 21 )(85071E also has three reflection algorithms)These are the algorithms used in 85070E. They will convert the measured S-parameters to permittivity or permeability. The first three require a two-portfixture. The last two require a one-port fixture which may be better for liquidsor powders where a shorted waveguide section can be turned on end andfilled. One-port fixtures may also be better for measurements at hightemperatures where one end of the waveguide can be heated while coolingmechanisms keep the network analyzer cool.36
Nicolson-Ross ModelTechnique is based on solving the two equationsbelow for the two unknownsM 21 +M 11 =S 21 (φ,ε,µ) + S 11 (φ,ε,µ)M 21 -M 11 =S 21 (φ,ε,µ) - S 11 (φ,ε,µ)A. M. Nicolson and G. F. Ross, "<strong>Measurement</strong> of the intrinsic properties of materials bytime domain techniques, " IEEE Trans. Instrum. Meas., IM-19(4), pp. 377-382, 1970.The Nicolson-Ross model solves for both permittivity and permeability by makingtransmission and reflection coefficient measurements on a single sample of thematerial. The M xx in the equations above refers to the measured values of the s-parameters while S xx refers to the values calculated from the previously mentionedequations. Nicolson and Ross showed by taking the sum and difference oftransmission and reflection coefficients the values for u and e can be determined.37
Problems with N-R Model• This set of equations become unstable when M11 isequal to zero. One equation, two unknowns.• The derivation involves taking the log of a complexnumber. The log of a complex number is not a singlevalued function.The major flaw in this technique is when the value of S 11 is equal to zero (or theuncertainty in the measurement is as large as the measurement value) When thishappens we have only one independent equation and two unknowns. One way thiscan happen is when the reflection off the back surface of the material cancels out thereflection off the front surface. Fortunately this seldom happens with magneticmaterials. This is because these materials are usually lossey. Non-magneticmaterials can be better analyzed by using other models. These models will bediscussed later.Another problem occurs because the derivation proposed by Nicolson and Rossinvolves taking the log of a complex quantity. The log of a complex number is not asingle valued function. This can usually be accounted for by knowing how many 360degree phase transitions S 21 makes. You need to know if the -30 degree phase of S21is really -30 degrees or -30 -360=-390 degrees. This is easy to do if the phase shift atthe first frequency point is less than -360 degrees. If not an estimate of u and e isneeded. These estimates only need to be accurate enough to correctly predict thenumber of -360 degree phase shifts. Another possibility is to estimate the number ofphase shifts by calculating the group delay.38
Example of N-R <strong>Measurement</strong>sThese two plots show measurements made on a sample of Teflon. In the first casethe measured value of S 11 never approaches zero. In the second case, because of thelonger length of the sample, the measured value of S11 approaches zero at severalfrequencies. Since the equations used to solve for u and e are ill-conditioned thecomputed results are in error.39
NIST Model• Technique uses all four measured s-parameters to calculatepermittivity. This eliminates the need to know the position ofthe sample in the sample holder. The sample is assumed tobe non-magnetic.• Sometimes has a problem converging to an answer whenthe measurement errors in S 11 and S 22 is large.J. Baker-Jarvis, E. Vanzura, W. Kissick. “Improved Technique for Determining ComplexPermittivity with the Transmission/Reflection Method.” IEEE Transactions on MicrowaveTheory and Techniques, vol 38, no. 8, pp. 1096-1103, August 1990.The NIST model was developed by Jim Baker-Jarvis of NIST (and others). It uses allfour measured s-parameters to determine permittivity. The material is assumed to benon-magnetic. It is an iterative approach and sometimes has problems convergingwhen the measurement errors in S 11 and S 22 are large.40
Here is an example of using the NIST model to calculate the value of permittivity for aTeflon sample.41
Transmission (Fast) Model• This technique minimizes the difference between themeasured and calculated values of S 21.. The sample isassumed to be non-magnetic.• Often converges to a solution when the NIST model fails.This is because it doesn’t depend on S 11 . The error inmeasuring S 11 is often a order of magnitude worst than whenmeasuring S 21 .The transmission model is based on minimizing the difference between the measuredvalue of the transmission coefficient and the computed value. It assumes that thematerial is non-magnetic. It is an iterative method that starts with an initial guess forpermittivity (usually 1+j0) and improves the guess until the difference is near zero.42
Here is the computed value of permittivity for a Teflon sample. It is virtually identicalto the values computed by the NIST model.43
Weakness of both the NIST and TransmissionModels• Both models computes the wrong solution when the phaseshift of S21 is greater than -360 degrees at the firstmeasurement frequency.• This can often be overcome by computing the group delayand computing an estimate of the permittivity.• An alternative is to provide the model with an approximatevalue of the permittivity.Both models can become “confused” when the length of the sample is long comparedto the wavelength of the measurement frequency. There are several values ofpermittivity that satisfies the measurements. This problem can be overcome by eithermaking a shorter sample, lowering the first measurement frequency or providingadditional information such as group delay or an initial guess of permittivity.44
Nicolson-Ross - <strong>Measurement</strong>sThese two plots show measurements made on a sample of Teflon. In thefirst case the measured value of S 11 never approaches zero. In the secondcase, because of the longer length of the sample, the measured value ofS11 approaches zero at several frequencies. Since the equations used tosolve for u and e are ill-conditioned the computed results are in error.45
Transmission Line <strong>Measurement</strong> Error SourcesSample geometry• air gaps• sample lengthNetwork analyzer systematic errors• usually less important than sample geometry• minimized when measuring longer samples46
Sample LengthMinimum lengthS 21 phase shift >> S 21 uncertainty(approx. 20 o )Lmin⎛> λg⎜⎝20360⎞⎟⎠Maximum lengthAvoid drop-outs in Nicolson-Ross algorithmSample lossLong samples may create multiple rootsLmaxλg
Typical Errors Caused By Air GapsPermittivity of materialHigh ε r materials in coaxial lines = 20% to 50%Size of transmission lineFor ε r = 10 and air gap = 0.25 mm (coaxial line)Coaxial line dimensions3.0 mm7.0 mm14.0 mm25.0 mm1.625 in3.125 inError35%14%8%4%3.2%1.7%<strong>Materials</strong> with higher permittivities and smaller diameter transmission lineswill be more susceptible to error from air gap.48
Transmission Line Typical Accuracy'r'r'ε rε = 1−3 ε = 3−10= 10−30Coaxial line 2% 5% 10%Waveguide 1% 3% 5%For low loss, nonmagnetic, isotropic, rigid materialRequires precise sample machining (e.g. 0.03 mm). It willdepend on the frequency.Reported 2-4 times better accuracy with no air gapsThe typical accuracy of a transmission line measurement ranges from 1% to10% or higher depending on the MUT and how well it is machined. Thenumbers shown above are typical, for comparison purpose.The uncertainty analysis should be performed for particular sample,measurement set up, frequency range etc. Full error analysis will beinvolved and tedious and, again, it will be fully valid only for the particularmeasurement situation. Many authors treat the uncertainty of transmissiontype of measurements, but a good overview is:J. Baker-Jarvis, M.D. Janezic, R.F. Riddle, R.T. Johnk, P. Kabos, C.Holloway, R.G. Geyer, C.A. Grosvenor, “Measuring the Permittivity andPermeability of Lossy <strong>Materials</strong>: Solids, Liquids, Metals, Building <strong>Materials</strong>,and Negative-Index <strong>Materials</strong>,” NIST Technical Note 15362005http://www.boulder.nist.gov/div818/81801/properties/Pages/publications.html49
Transmission Line Technique SummaryFrequency Range: Broadband or Banded 1 to 75GHzInstrument: Network AnalyzerAccuracy: typically ±2-5% for ε r’ and ± 10 -2 for tanδBest for hard machineablesolidsPrecise sample shape required(usually destructive)Widely available coax orwaveguide fixtures.Needs large samples for lowfrequencies; small samples forhigh frequencies.Works for magnetic materialsLiquids, powders and gasesmust be containedThe transmission line technique offers good broadband or banded frequencycoverage. Accuracy and loss tangent performance are good. It is best forhard solids that can be machined precisely to fit inside sample holders.Sample sizes scale with frequency and be difficult to handle at the extremelow and high frequencies.50
Transmission Free-Space SystemComputer(not required for PNA)Network AnalyzerGP-IB or LAN8507IE Software runson PC or PNASample holderfixtured between two antennaeThe free-space technique is just a variation of the transmission linetechnique. A typical free-space system consists of a vector networkanalyzer, two antennae facing each other with a sample holder betweenthem. Again, Agilent provides software that converts the S-parameter outputof the network analyzer to dielectric properties.The free-space configuration overcomes some of the difficulties of the tryingto fit samples into transmission line sample holders. And, because thesample is fixtured in space, it is isolated from the other hardware in thesystem. This can be very useful in a variety of situations.51
Non-Contacting method for High or LowTemperature Tests.Free Space with FurnaceThe free-space technique is ideal for measuring materials that are heated orcooled to temperatures that would cause problems for the network analyzer,cables and connectors. The sample can be placed inside a Temperaturecontrol unit with microwave windows allowing the energy radiating from theantennae to transmit through and reflect off the sample.52
Transmission Free-SpaceReflection(S )11lTransmission(S )21Material assumptions: Flat parallel faced samples Sample in non-reactive region Beam spot is contained in sample Known thickness > 20/360 λThe free space technique is best for thin flat parallel faced materials, or othermaterials that can be formed into this shape. Just like the transmission linetechnique, the sample size scales with frequency, but with free space thesamples are larger. They must be large enough to contain the 3dB beamspot. At low frequencies, it can be a problem to get samples large enough.But, at high frequencies this is a benefit, as the sample does not have to beso tiny. Focused beam antennas can help with sample size. In addition,they condition the beam to improve performance, but reasonableperformance can be obtained without them. Just like transmission linemeasurements, the sample must be thick enough to contain enough of thewavelength of interest to be measurable, 20 degrees at least, but ideally 180degrees, or ½ λ. At mm-wave frequencies, samples thicker than 1 λ cancreate multiple root mathematical errors. The sample must be far enoughaway from the antennae to be out of the reactive region, ideally at least2d 2 /λ, where d is the largest dimension of the antenna.53
40 – 60GHz Free Space System54
A Simple Free Space Powder FixturePowder in Tray PlacedBetween AntennaeClose UpThese pictures show a simple freespace powder fixture used inthe cornmeal moisture measurement. It is basically a tray madeout of expanded polystyrene. The structure holding the antennaein this case is a commercially available shelving unit.It is easy to imagine a more industrial version, with perhaps aconveyor belt moving the powder between the antennae. Sincethis method is non-contacting, it is perfect for high-temperaturemeasurements.55
Free Space W-band SystemHere is a photo of a W-band, 75-110GHz, measurement system. You cansee the PNA mm-wave system includes and two mm-wave heads tomultiply the frequency and an additional box to control the heads.These w-band std-gain horns were purchased for less than $700 US, andthe sample holder is made out of a few pieces of scrap plastic held togetherwith some plastic screws and pink rubber bands. It’s clamped to the tablewith C-clamps so it doesn’t move.56
Free Space W-band SystemHere is a closer look at the horns and sample holder. Obviously, more robustfixturing can be made for industrial use, but even with these easily made,simple fixtures, reasonable results were obtained, which you will see later inthis presentation.57
Free Space Quasi-Optical SystemHere’s a look at another W-band setup, this time using mirrors to reshapeand redirect the beam. More accurate results for e’ can be achieved.58
Free Space Quasi-Optical SystemHere’s a look at another W-band setup, this time using mirrors to reshapeand redirect the beam. More accurate results for e’ can be achieved.59
Before a <strong>Measurement</strong> Can be Made…System errors must be corrected for before a measurement is made.60
TRM CalibrationThruReflectMatchHard to get broadband absorbers for matchOne widely use technique has been TRM. This technique uses a thru,reflect standard and matched load standards to calculate the errorcoefficients. Problem is finding a broad band absorbing material for thematch standard. Imperfections in the match standard cause residual errorsafter calibration.61
TRL CalibrationThruReflectMove the antenna away tocompensate for the thicknessof the short. Move it backfor the next step.LineMove the antenna away on aquarter-wavelength and thenback in the original position.Precise positioning fixtures are expensiveA second widely used technique is TRL. TRL uses a thru, reflect and linestandard to determine the error coefficients. However, to measure thereflect, the port two antenna must be moved back by the thickness of themetal plate. The line standard is then realized by precisely moving the porttwo antenna on quarter wavelength. After the calibration the antenna needsto be precisely moved back to its original position. In order to do thisaccurately enough to get a good calibration, expensive positioning fixturingis required like optical table.For both TRM and TRL calibration the main problem is the third standard(Match or Line). The GRL calibration avoids using the third standard as itwill be explained next.62
Gated Reflect Line (GRL) CalibrationEasy Two Step ProcessTwo port calibration at waveguide or coax input into antennasremoves errors associated with network analyzer and cables.ECal, SOLT or TRL Caldone here63
Gated Reflect Line (GRL) CalibrationEasy Two Step ProcessTwo additional free space calibration standards remove errorsfrom antennas and fixture.Line(empty fixture)Reflect(metal plate ofknown thickness)64
GRL Cal – How it worksGRL Cal Error Model (forward only)2-port Cal Terms1MUTS212-port Cal TermsTtDMsGRL ErrorAdapterS11S22GRL ErrorAdapterMlTrS12•Coax or Waveguide 2-port Cal corrects errors from end of cable back into theinstrument.•Errors from Antennas and Fixture can be thought of as being lumped into a GRL erroradapter.•The GRL error adapter is quantified by measurements of reflect and line standards.•The original 2-port Cal is modified to correct for the error adapter.Gated Reflect Line CalibrationHere is how it works. The GRL technique requires that a calibration beperformed at the ends of the cables that connect to the antennas. TheGRL technique modifies this calibration such that the reference plane istransformed from the end of the cables to the surface of the metal plateused for calibration. When the calibration is complete the empty fixturemeasures as a slice of air the thickness of the metal plate. Before themodification the fixture can be thought of as two error adapters betweenthe end of the cables and the space that the metal plate occupies.65
MUT and GRL Error AdaptersAfter 2-Port CalibrationO21MUTS21T12O11O22S11S22T22T11O12S12T21Six Unknowns021 = O12O11O22T21 = T12T11T22Here is a signal flow graph showing just the GRL adapters and a MUT. TheOxx parameters refer to port 1 and the Txx refers to port 2. The goal is todetermine all the Oxxs and Txxs and embeding them into the orginalcalibration. Each of the error adapters can be modeled by their four s-parameters. Because of the passive nature of these error adaptersO21=O12 and T21 = T12. This leaves six unknowns.66
GRL Cal – How it worksTime Domain of Empty Free Space FixturegateTransmittingAntennaReceivingAntennaAirAbove is a time domain S11 graph of the measured fixture when the fixtureis emptyNote that you can identify the various responses as the reflection associatedto the transmitting antenna, followed by the low reflection of air and thenthe reflection associated with the receiving antenna and its associatedsupporting structure. The GRL places time domain gates around theresponses associated with the transmitting antenna. The frequencydomain of this gated measurement is O11 of the port one error adapter.The same approach can be used to determine T11 of the port 2 erroradapter.. These terms can be then embedded into the original 2-portcalibration.Using this new calibration set the other terms of the error adapters can becalculated from the s-parameter measurements of the Thru (emptyfixture or air) and the Reflect (metal plate) standards.67
MUT and GRL Error AdaptersAfter O11 and T11 are embedded into the original 2-Port calibration.MUTO21S21T12O22S11S22T22O12S12T21Four UnknownsO21 = O12O22T21 = T12T22Once O11 and T11 are embedded into the original 2-port calibration, thesignal flow graph looks like this, with four remaining terms in the erroradapter. They will be removed by measuring two additional standards, theThru and Reflect.68
GRL Metal Plate StandardP 11 = P 22 = -1P 21 =P 12 =0.MUTO21S21O22S11O12S12O21O12Γplate_1=−1 + O22TT21 12Γplate_2=−1 + T22S22T22T12T21The plate standard is the metal plate of know thickness. In a perfectfreespace system, the metal plate will reflect all energy back, so P11 andP22 are set to minus one. Since all energy is reflected, no energy passesthrough, so P12 and P21 are set to zero.Using Mason’s rule, the S-parameters of the port one and two platestandards are established.69
GRL Thru Standard (Air)A 11 =A 22 =0MUTA 21 = A 12 =je − ωε udω= frequencyε= permittivity of airµ= permeability of air.d= thickness of the metal plateO21O12O22S21S11 S22S12T22T12T21Γ =air_1Γ =air_2A A O O T1−O T21 12 21 12 2222 22A A T T O1−T O21 12 21 12 2222 22The Thru standard is the empty fixture or air and designated here by A.Since in a perfect free space system, S11 or air, or A11 here, would see noreflection back, A11 and A22 are set to zero.A21 and A12 are equal to the expression above.Once again, using Mason’s loop rule, we can establish expressions for theS-parameters of the port one and two air standards. With these fourequations, the two here and the on the previous slide, the four remainingcoefficients of the error adapters can be solved for. These are thenembedded into the original calibration. The result is a full two-port calibrationwith the reference planes at the surface of the metal plate.The two equations on the previous slide and these equations are used tosolve for the remaining coefficients of the error adapters. These terms arethen embedded into the original calibration. The result is a full two-portcalibration with the reference planes at the surface of the metal plate.70
Round Robin ResultsThis shows the results of a round robin we participated in. The MUT, unknown at the time ofmeasurement, was glass reinforced, ceramic composite. Agilent measured the material inx-band (8-12 GHz) and u-band (40-60 GHz) using a PNA based freepace system and GRLcalibration. It should be noted that all the other data come from single frequency andresonant techniques, which are considered to be more accurate than broadband free spacetechniques.Note at the low frequency end of the X- band Agilent measurements of the values tail up. Itis probable that this was caused by the sample holder being too small.The test data comes from the following various points:IPC TM-650 2.5.5.5. Strip line data at 10 GHz (first four harmonics. Fourth Harmonic is therecognized harmonic for reporting.Damaskos Model 900T Open Resonator Data (8.4 to 26 GHz) (D1 and D2)Damaskos Model 200 Circular Cavity Data (2.6 to 23 GHz) (D3)NIST Test using a Split Post < 10 GHzNIST Test using a Split Cylinder > 10 GHzAgilent 8507!E-100 GRL cal, X-band and U-Band71
QO System SchematicAdditional information available at : http://www.terahertz.co.uk/TKI/Agilent/Agilent_VNA_QO.html72
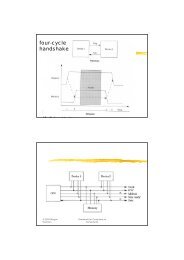
<strong>Measurement</strong> Results2.57Real part of EpsilonRexolite measured with 110Ghz PNA and GRL Cale'2.562.552.542.532.522.512.52.492.482.477.500E+10 8.000E+10 8.500E+10 9.000E+10 9.500E+10 1.000E+11 1.050E+11 1.100E+11frequency (hz)Std Gain Horn QO tableHere is a comparison of the results with both setups.73
<strong>Measurement</strong> Results0.03Imaginary part of EpsilonRexolite measured with 110Ghz PNA and GRL Cale"0.0250.020.0150.010.00507.500E+10 8.000E+10 8.500E+10 9.000E+10 9.500E+10 1.000E+11 1.050E+11 1.100E+11-0.005-0.01-0.015-0.02frequency (hz)Std Gain Horn QO table74
NRL (Naval Research Lab) ArchTo Port 1 ofnetworkanalyzerTo Port 2 ofnetworkanalyzerαMeasure s 21 with the network analyzerNRL arch is used usually to measure absorbingmaterials. For absorbers is desired to know thefrequency response of reflectivity at a given angle.Another free-space measurement of interest is reflectivity. It is often desiredto know the reflectivity at a given angle. The material of interest may be anabsorber as illustrated of a material intended to be applied to a metalsurface.Reflectivity measurements are often performed on a NRL (Naval ResearchLaboratory) Arch. The arch allows the user to adjust the angle of theantennas being used while maintaining a constant distance to the sample.The material being measured is placed on the table. Prior to making ameasurement the system is calibrated. The most commonly used calibrationis an isolation-response cal. Time-domain gates are often employed toeliminate unwanted transmission paths.75
<strong>Measurement</strong> with NRL Arch andoption 200 of 85071EA typical reflectivity measurement with PNA network analyzer, 85071Esoftware with option 200 and NRL arch. For this measurement (option 200)a PNA or 8510 network analyzer with time domain option is required. Themeasurement shows distinct minimum of reflectivity for lower frequencies.76
Transmission Free-Space Technique SummaryFrequency Range: Banded 5 to 325GHzInstrument: Network AnalyzerAccuracy: typically ±2-5% for ε r’ and ± 10 -2 for tanδNon-Contacting!Sample must be flat and uniformthickness. Thickness must beknown.Best for flat sheet and othermaterials that can be shaped.Needs large samples for lowfrequenciesWorks for magnetic materials77
Free Space LabWith u-band calibration turned on and standard gain hornsconnected.• Set up 85070E Perform ECal calibration at end of cables• Determine distance to sample• Verify sample size is adequate.• Determine time domain parameters.• Verify the number of points used is adequate.• Perform GRL calibration in 85071E software.• Measure MUT.Waveguideto CoaxadapterWaveguideto CoaxadapterStd GainHornSample HolderStd GainHornSampleloadedto Port1 sidePort 1Coax Cal done at end of adaptersSetup78