nrega - of Planning Commission
nrega - of Planning Commission
nrega - of Planning Commission

Create successful ePaper yourself
Turn your PDF publications into a flip-book with our unique Google optimized e-Paper software.
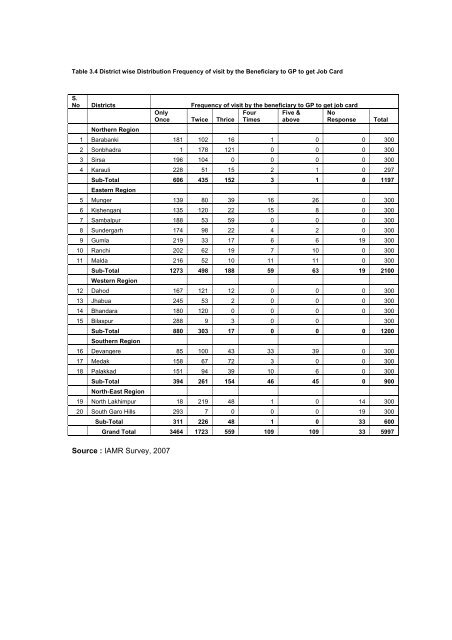
Table 3.4 District wise Distribution Frequency <strong>of</strong> visit by the Beneficiary to GP to get Job CardS.No Districts Frequency <strong>of</strong> visit by the beneficiary to GP to get job cardOnlyOnce Twice ThriceFourTimesFive &aboveNoResponse TotalNorthern Region1 Barabanki 181 102 16 1 0 0 3002 Sonbhadra 1 178 121 0 0 0 3003 Sirsa 196 104 0 0 0 0 3004 Karauli 228 51 15 2 1 0 297Sub-Total 606 435 152 3 1 0 1197Eastern Region5 Munger 139 80 39 16 26 0 3006 Kishenganj 135 120 22 15 8 0 3007 Sambalpur 188 53 59 0 0 0 3008 Sundergarh 174 98 22 4 2 0 3009 Gumla 219 33 17 6 6 19 30010 Ranchi 202 62 19 7 10 0 30011 Malda 216 52 10 11 11 0 300Sub-Total 1273 498 188 59 63 19 2100Western Region12 Dahod 167 121 12 0 0 0 30013 Jhabua 245 53 2 0 0 0 30014 Bhandara 180 120 0 0 0 0 30015 Bilaspur 288 9 3 0 0 300Sub-Total 880 303 17 0 0 0 1200Southern Region16 Devangere 85 100 43 33 39 0 30017 Medak 158 67 72 3 0 0 30018 Palakkad 151 94 39 10 6 0 300Sub-Total 394 261 154 46 45 0 900North-East Region19 North Lakhimpur 18 219 48 1 0 14 30020 South Garo Hills 293 7 0 0 0 19 300Sub-Total 311 226 48 1 0 33 600Grand Total 3464 1723 559 109 109 33 5997Source : IAMR Survey, 2007