

Methodology for the Evaluation of Natural Ventilation in ... - Cham
Methodology for the Evaluation of Natural Ventilation in ... - Cham
Methodology for the Evaluation of Natural Ventilation in ... - Cham

Create successful ePaper yourself
Turn your PDF publications into a flip-book with our unique Google optimized e-Paper software.
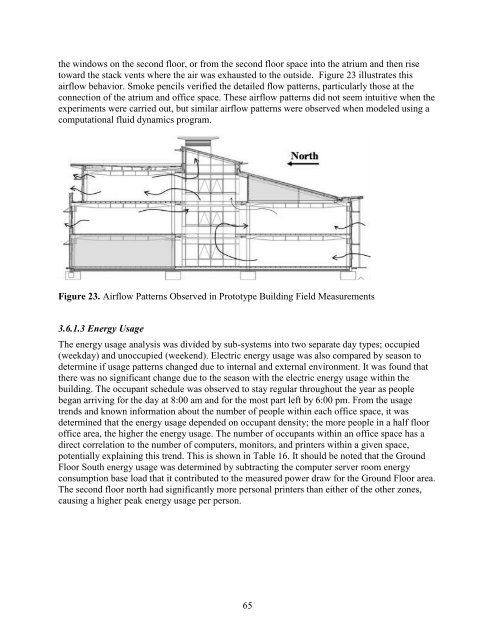
<strong>the</strong> w<strong>in</strong>dows on <strong>the</strong> second floor, or from <strong>the</strong> second floor space <strong>in</strong>to <strong>the</strong> atrium and <strong>the</strong>n risetoward <strong>the</strong> stack vents where <strong>the</strong> air was exhausted to <strong>the</strong> outside. Figure 23 illustrates thisairflow behavior. Smoke pencils verified <strong>the</strong> detailed flow patterns, particularly those at <strong>the</strong>connection <strong>of</strong> <strong>the</strong> atrium and <strong>of</strong>fice space. These airflow patterns did not seem <strong>in</strong>tuitive when <strong>the</strong>experiments were carried out, but similar airflow patterns were observed when modeled us<strong>in</strong>g acomputational fluid dynamics program.Figure 23. Airflow Patterns Observed <strong>in</strong> Prototype Build<strong>in</strong>g Field Measurements3.6.1.3 Energy UsageThe energy usage analysis was divided by sub-systems <strong>in</strong>to two separate day types; occupied(weekday) and unoccupied (weekend). Electric energy usage was also compared by season todeterm<strong>in</strong>e if usage patterns changed due to <strong>in</strong>ternal and external environment. It was found that<strong>the</strong>re was no significant change due to <strong>the</strong> season with <strong>the</strong> electric energy usage with<strong>in</strong> <strong>the</strong>build<strong>in</strong>g. The occupant schedule was observed to stay regular throughout <strong>the</strong> year as peoplebegan arriv<strong>in</strong>g <strong>for</strong> <strong>the</strong> day at 8:00 am and <strong>for</strong> <strong>the</strong> most part left by 6:00 pm. From <strong>the</strong> usagetrends and known <strong>in</strong><strong>for</strong>mation about <strong>the</strong> number <strong>of</strong> people with<strong>in</strong> each <strong>of</strong>fice space, it wasdeterm<strong>in</strong>ed that <strong>the</strong> energy usage depended on occupant density; <strong>the</strong> more people <strong>in</strong> a half floor<strong>of</strong>fice area, <strong>the</strong> higher <strong>the</strong> energy usage. The number <strong>of</strong> occupants with<strong>in</strong> an <strong>of</strong>fice space has adirect correlation to <strong>the</strong> number <strong>of</strong> computers, monitors, and pr<strong>in</strong>ters with<strong>in</strong> a given space,potentially expla<strong>in</strong><strong>in</strong>g this trend. This is shown <strong>in</strong> Table 16. It should be noted that <strong>the</strong> GroundFloor South energy usage was determ<strong>in</strong>ed by subtract<strong>in</strong>g <strong>the</strong> computer server room energyconsumption base load that it contributed to <strong>the</strong> measured power draw <strong>for</strong> <strong>the</strong> Ground Floor area.The second floor north had significantly more personal pr<strong>in</strong>ters than ei<strong>the</strong>r <strong>of</strong> <strong>the</strong> o<strong>the</strong>r zones,caus<strong>in</strong>g a higher peak energy usage per person.65


