The Compelling Facts About Plastics 2009 - Europe
The Compelling Facts About Plastics 2009 - Europe
The Compelling Facts About Plastics 2009 - Europe
- No tags were found...

Create successful ePaper yourself
Turn your PDF publications into a flip-book with our unique Google optimized e-Paper software.
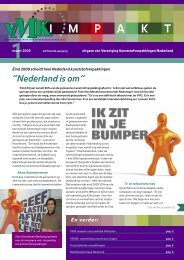
Table of contents• <strong>Plastics</strong> protect the climate, boost resourceefficiency and give us a safer life• <strong>Plastics</strong>’ significant contribution tothe sustainable use of resources• <strong>Plastics</strong> production and converter demandin a global context• Production and demand in <strong>Europe</strong>• <strong>Plastics</strong> demand by converters per polymerand application• <strong>Plastics</strong> trade – a strong contributorto <strong>Europe</strong>an wealth• <strong>Plastics</strong> supply chain from cradle to cradle• <strong>Plastics</strong> continue to decouple growth in demandfrom material to landfill• Slow but steady progress towards divertingplastics waste from landfill• Voluntary initiatives to stimulatethe mechanical recycling of PET bottles• New trends in recovery of packaging• Mechanical recycling of food grade HDPE in the UK• Mechanical recycling of agricultural film– a Norwegian success story• Feedstock recycling• Energy from Waste• <strong>The</strong> Greater Manchester waste managementsolution – a model for diverting waste from landfill?• Plastic products, applications and goods –enablers of innovation in society• Recovery trends by application• Methodology• Who are we?• Snapshots <strong>2009</strong>Page 4Page 5Page 6Page 6Page 7Page 8Page 10Page 11Page 12Page 13Page 13Page 14Page 15Page 15Page 16Page 17Page 18Page 20Page 21Page 22Page 233
<strong>Plastics</strong> protect the climate, boost resourceefficiency and give us a safer life<strong>Plastics</strong> play a significant role in the environmental,societal and economic dimensions of sustainabledevelopment. Our modern lifestyle would not bepossible without plastics. <strong>Plastics</strong> meet the needs ofsociety by enabling the eco-efficient manufacture ofmany valuable products. E.g. protective packaging, lightand safe materials in cars , mobile phones, insulationmaterials in buildings, medical devices, and importantparts for applications as different as renewable energyproduction and protection in extreme conditions.Climate protectionIn cars, around 40% of plastics used contributeto weight reduction, saving fuel and reducing CO 2emissions. A further 60% of the weight of the plasticsused enhance comfort and safety. <strong>The</strong> weight reductionfrom plastic in a modern car saves over 500l of fuel over150.000km. In an Airbus A380, high performance plasticcomposites reduce passenger costs per seat as thelighter weight results in lower fuel consumption.Homes and buildings stay warm (or cool!) with plasticinsulation. Nearly 40% of all primary energy consumedglobally is used in buildings. Efficient insulation is akey priority in reaching the Kyoto targets.Lightweight plastic packaging reduces both the weight oftransporting goods and the amount of packaged goodsthat go to waste – both of which reduce CO 2 emissions.<strong>Plastics</strong> enable the rotors in wind turbines to be longerand more effective; and components in solar panels toincrease their efficiency.Resource efficiencyWithout plastic packaging, it is estimated that thetonnage of alternative packaging materials wouldincrease by a factor of 4, greenhouse gas emissionsby a factor of 2, costs by a factor of 1.9, energy use bya factor of 1.5 and waste by a factor of 1.9 in volume.As the use of plastics continues to grow, this effectwould increase each year.<strong>Plastics</strong> packaging also saves resources. It protectsfood as it travels from farm to supermarket and intoour kitchens. For example, in the developing world50% of food is wasted between farm and kitchen; atthe supermarket loosely-packed fruits and vegetablescreate 26% more waste than pre-packed produce; 1.5gof plastics film extends the shelf life of a cucumberfrom 3 to 14 days. Some 10g of multilayer film in a MAP(modified atmospheric packaging) for meat extendsshelf life from a few days to over a week. <strong>The</strong> amountof CO 2 used to produce a single portion of meat isalmost 100 times more than that used to produce themultilayer film.Innovative design uses plastics for the outer drum ofwashing machines, reducing both water and energyconsumption. Plastic pipes ensure the efficient, safeand leak-free transportation of drinking water andsewage without any waste or contamination.<strong>Plastics</strong> make life safer<strong>Plastics</strong> protect us from injury – in the car, workingas a fire fighter or when skiing. Car airbags andmotorcyclists’ helmets are made of plastics; as isthe protective clothing for most motorcyclists.An astronaut’s suit must sustain temperatures from-150 degrees Celsius to +120 degrees. Firefighters relyupon flexible plastics clothing which protects againsthigh temperatures and ventilates.<strong>Plastics</strong> protect our food and drink from contamination.<strong>Plastics</strong> flooring and furniture are easy to clean. Thisprevents the spread of bacteria and reduces the cost ofmaintenance, e.g. in hospitals. In medicine, plastics areused for blood pouches and tubing, artificial limbs andjoints, contact lenses and artificial cornea, dissolvingstitches, splints and screws that heal fractures. Soonnanopolymers will carry medicines directly to damagedcells and micro-spirals will be used to combat coronarydisease. Artificial, plastic based blood is also beingdeveloped to complement natural blood.4
<strong>Plastics</strong>’ significant contribution to the sustainableuse of resourcesReduce<strong>The</strong> use of plastics saves energy and reduces CO 2emissions. From a lifecycle perspective, if all plasticsin all applications were substituted with a mix ofalternative materials, 22.4 million additional tonnesof crude oil would be needed each year.This means additional greenhouse gas emissions thatare 30% of the EU27 Kyoto target for 2000-2012.<strong>Plastics</strong> reduce waste by providing many resourceeffectivesolutions. This includes lowering energyconsumption during production and reducing theplastics material needed for a particular job. <strong>The</strong>re isalso less waste of packaged goods, be it food, wateror a computer (e.g. lighter bottles for water, softdrinks or detergents and thinner packaging film).Another example being tested in some Member Statesis “mixed packaging plastics”.This important development must continue. <strong>The</strong>full potential of existing recycling streams must berealised and new eco-efficient streams developed.Reuse<strong>Plastics</strong> are reused in many ways. <strong>Plastics</strong> soft drinkbottles are reused in many Member States. Carrier bagsare reused in a variety of ways and plastic supermarkettrays provide a clean, robust and cost-effective way oftransporting fresh food from producer to customer.RecyclePlastic recycling is increasing every year. Apart fromfamiliar applications like recycling bottles and industrialpackaging film, there are also new developments e.g.the Recovinyl initiative from the Vinyl 2010 programmeof the PVC industry (covering pipes, window frames,roofing membranes and flooring).RecoverWith existing and emerging applications there willalways be items which cannot be recycled in an ecoefficientway:For these end-of-life streams plastics offer an additionaladvantage – energy recovery. <strong>Plastics</strong> enable manyvital primary fossil fuel substitution from oil well tofinal energy uses such as heat cooling and electricity.As long as fossil fuels continue to be used for energyproduction, plastics will provide more value to societywhen end-of-life plastics are not landfilled.Landfill and disposal must be minimised. This is a wasteof valuable resources and adds to greenhouse gases.<strong>The</strong> vision of the 4 partners for a forward-looking resource management approach:• Minimise disposal of plastics waste to landfill• Use a mix of recovery options for the best environmental and economic resultin every situation• Treatment and recovery of waste should meet defined environmental standards• Overall lifecycle impact taken into consideration5
<strong>Plastics</strong> production and converter demandin a global contextSince 1950, globally there has been an average annual increase in theproduction and consumption of plastics of 9%. This has been driven bya track record of continuous innovation. From 1.5 million tonnes in 1950,total global production reached 245 million tonnes in 2008 (see Figure 1).This continued growth was reversed in 2008 as a direct consequence ofthe global financial crisis which has affected virtually all sectors.An analysis of plastic materials consumption on a per capita basis showsthat this has now grown to approximately 100kg per year in NAFTA andWestern <strong>Europe</strong>. <strong>The</strong>se regions have the potential to grow to approximately140kg per capita by 2015. <strong>The</strong> biggest potential growth area is the rapidlydeveloping Asian countries (excluding Japan), where current per capitaconsumption is only around 20kg.In <strong>Europe</strong>, new Member States are expected to see the biggest percentageincrease, as their economies develop.Mtonne300250200150100501976: 50World1989: 1002002: 2001950: 1.501950 1960 1970 1980 1990 2000Includes <strong>The</strong>rmoplastics, Polyurethanes, <strong>The</strong>rmosets, Elastomers,Adhesives, Coatings and Sealants and PP-Fibers. Not included PET-,PA- and Polyacryl-FibersFigure 1. World plastics production 1950-20082008: 60Source: <strong>Plastics</strong><strong>Europe</strong> Market Research Group (PEMRG)2008: 245<strong>Europe</strong>46461051051391394040999913613692424484850508989108108721213232310101616220203636NAFTA 2.8 % Western <strong>Europe</strong>NAFTA 2.8 Western <strong>Europe</strong>3.2 % Central <strong>Europe</strong> + CIS3.2 Central <strong>Europe</strong> CIS7.3 % Japan1.9 % Latin America7.3 Japan1.9 Latin America4.3 % Middle East / Africa4.3 Middle East / Africa4.1 % Asia w/o Japan4.1 Asia w/o Japan6.0 %6.0 303045451111Total World 4.1 %Total World 4.1 1980 2005 2015 estimates1980 2005 2015 estimatesCAGR* in % 2005 - 2015eCAGR* in 2005 2015e*) Compound annual growth rate*) Compound annual growth rateFigure 2. <strong>Plastics</strong> demand by converters in kg per capita per regionSource: <strong>Plastics</strong><strong>Europe</strong> Market Research Group (PEMRG)Production and demand in <strong>Europe</strong><strong>Europe</strong> 25.0%, 60 Mtonne Mio t<strong>Europe</strong> produces approximately 60 million tonnesof plastics, representing 25% of the global plasticsproduction. This is slightly more than NAFTA (23%).China15.0%Rest of Asia16.5%Germany Spain7.5% 1.5%UK 1.5%Italy 2.0%France 3.0%Benelux 4.5%Other EU 27+N, CH5.0%CIS 3.0%Plastic production facilities are well placed across<strong>Europe</strong>. Germany is the major producer, accounting for7.5% of global production followed by Benelux (4.5%),France (3%), Italy (2%) and the UK and Spain (1.5%)(Figure3).Middle East, AfricaJapan8.0%5.5%Latin America4.0%NAFTA23.0%245 MtonneFigure 3. World plastics production 2008 by country and regionSource: <strong>Plastics</strong><strong>Europe</strong> Market Research Group (PEMRG)6
<strong>Plastics</strong> demand by converters in <strong>Europe</strong> was 48.5million tonnes in 2008. <strong>The</strong> demand is, expressedas tonnage of virgin resin processed by <strong>Europe</strong>anconverters by country (See Figure 4). <strong>The</strong> majorcountries are Germany and Italy, together accountingfor around 40% of the <strong>Europe</strong>an conversion to plasticproducts. Of the new Member States, Poland has thehighest plastic conversion rate 2.55 million tonnes ofthe <strong>Europe</strong>an total). Followed by the Czech Republic at1.05 million tonnes and Hungary at 0.84 million tonnes.<strong>The</strong> converting industries in many of the new MemberStates are expected to grow above the average of theold Member States in the coming years.AustriaBelgium & Lux.BulgariaCyprusCzech RepublicDenmarkEstoniaFinlandFranceGermanyGreeceHungaryIrelandItalyLatviaLithuaniaMaltaNetherlandsPolandPortugalRomaniaSlovakiaSloveniaSpainSwedenUKNorwaySwitzerland0 1 2 3 4 5 6 7 8 9 10 11 12 13Figure 4. <strong>Plastics</strong> demand by converters: breakdown by countryin <strong>Europe</strong> (Mtonne) 2008Source: <strong>Plastics</strong><strong>Europe</strong> Market Research Group (PEMRG)<strong>Plastics</strong> demand by converters per polymer and application<strong>The</strong>re are around 20 distinct groups of plastics, eachwith numerous grades available to help make the bestchoice for each specific application. <strong>The</strong>re are fivehigh-volume plastics families; polyethylene (includinglow density (LDPE), linear low density (LLDPE) and highdensity (HDPE)), polypropylene (PP), polyvinylchloride(PVC), polystyrene (solid PS and expandable EPS) andpolyethylene terephthalate (PET). Together the bigfive account for around 75% of all <strong>Europe</strong>an plasticsdemand. During 2008 all these groups saw a dropin demand – ranging from 1 to 11% – with an averagearound 7.5% (Figure 5).Packaging remains the biggest end-use for plastics(38%) followed by Building and Construction (21%).Automotive (7%), Electrical&Electronic (6%). Otherapplications, which include medical and leisure,use 28%. (See Figure 6).Others20.0%LDPE, LLDPE17.0%PUR7.0%HDPE11.0%Others28%Packaging38%PET7.0%E & E6%PS, EPS8.0%PVC12.0%PP18.0%Automotive7%Building & Construction21%48.5 Mtonne* * EU27+N, CH CH incl. Other <strong>Plastics</strong> (~6 Mtonne) Mio t)Figure 5. <strong>Plastics</strong> demand by converters 2008:breakdown by types in <strong>Europe</strong>Source: <strong>Plastics</strong><strong>Europe</strong> Market Research Group (PEMRG)48.5 Mtonne* EU27+N, * CH CH incl. incl. Other <strong>Plastics</strong> (~6 (~6 Mtonne) Mio t)Figure 6. <strong>Plastics</strong> demand by converters 2008:breakdown by end use segments in <strong>Europe</strong>Source: <strong>Plastics</strong><strong>Europe</strong> Market Research Group (PEMRG)7
<strong>Plastics</strong> trade – a strong contributor to <strong>Europe</strong>an wealth<strong>Plastics</strong> contribute to sustainable development andbring quality of life to citizens. As an example plasticsmake many goods in our daily life more affordable andreduce the wastage of many valuable resources.<strong>The</strong> plastics industry (polymer producers – representedby <strong>Plastics</strong><strong>Europe</strong>, converters – represented by EuPCand machine manufacturers – represented by EUROMAP)within the EU27 provide employment to 1.6 millionpeople – two thirds of the number of employees in theautomotive sector – and indirectly to many times morein industries which are enabled or depend on plasticsfor their products.Leisure shoes, sports garment and equipment,electronic goods like the mobile phone – to give afew examples – would not be so convenient or soaffordable was it not for the plastics used in theirdesign and manu facturing.In addition the plastics industry (1) add wealth to theEU27 by exporting more in value and volume termsthan what is being imported from outside the EU27.<strong>The</strong> EU27 is therefore a net exporter of both primaryplastics and converted plastics products (plastics innon-primary forms).Mtonne1.4 1.4Mtonne0.30 0.301.2 1.20.25 0.251 10.8 0.80.6 0.60.4 0.40.20 0.200.15 0.150.10 0.100.2 0.20.05 0.050 00 02002 2002 2003 2003 2004 2004 2005 2005 2006 2006 2007 2007 2008 2008 May May <strong>2009</strong> <strong>2009</strong>2002 2002 2003 2003 2004 2004 2005 2005 2006 2006 2007 2007 2008 2008 May May <strong>2009</strong> <strong>2009</strong>EU27 Export Primary <strong>Plastics</strong>EU27 Import Primary <strong>Plastics</strong>EU27 Net Net Export Primary <strong>Plastics</strong>EU27 Export <strong>Plastics</strong> ProductsEU27 Import <strong>Plastics</strong> ProductsEU27 Net Net Export <strong>Plastics</strong> ProductsFigure 7. EU27-Trade with Primary <strong>Plastics</strong> (SITC 57)with non-EU Countries (Extra EU), trend cycleFigure 8. EU27-Trade with <strong>Plastics</strong> Products (SITC 58)with non-EU Countries (Extra EU), trend cycle8
<strong>Plastics</strong> supply chain from cradle to cradleFigure 10 shows the flow of plastics from conversion tothe end-of-life phase in <strong>Europe</strong>.<strong>The</strong> converters used 48.5 million tonnes of plasticsin 2008, down 7.5% on 2007. Of all plastics used byconsumers, 24.9 million tonnes ended up as postconsumerwaste, up from 24.6 million tonnes in 2006.51.3% of post-consumer used plastic was recoveredand half went to disposal. Of the 51.3% recovered,5.3 million tonnes were recycled – as material andfeedstock – and 7.5 million tonnes were recoveredas energy.<strong>The</strong> total material recycling rate of post-consumerplastics in 2008 was 21.3%. Mechanical recyclingwas at 21% (up 0.9 percentage points over 2007) andfeedstock recycling at 0.3 % (unchanged from 2007).<strong>The</strong> energy recovery rate increased from 29.2 to 30%.In 2008, 12.1 million tonnes of plastic waste was stillwasted on landfills.Figure 10. <strong>Plastics</strong> from cradle to cradle (EU27+NO/CH 2008)Converterdemand of<strong>Europe</strong>48.5 MtonneOthers28%E & E7%Automotive8%Building & Construction21%40% short service life of productand 60% longPackaging38%ExportImportConsumerdemandExportImport5.3 Mtonne21.3%Recycling48.7%PC Waste24.9 Mtonne51.3%Disposal12.1 MtonneRecovery12.8 Mtonne7.5 Mtonne30%Energy recovery10
<strong>Plastics</strong> continue to decouple growth in demandfrom material to landfillDespite 3% annual growth in the past decade forpost-consumer waste, landfill amounts have remainedstable. Figure 11 shows the history for EU15+NO/CHuntil to 2004 and for EU27+NO/CH from 2005. <strong>The</strong>reare many reasons for the growth of post-consumerplastic waste; plastics continue to replace alternativematerials, economic growth drives greater consumption,smaller households require more packaging per personand proportionally more ready-made single-portionmeals are consumed.Figure 12 shows the growth of both mechanicalrecycling and energy recovery. Over the last decadethe average annual growth rate has been about 10%.Mechanical recycling increased by 4.3% which is downcompared to 2007 due to the impact of the financialcrisis. Growth in energy recovery increased 3.6% upslightly on 2007. More investment in energy recoveryfacilities is needed to divert streams which cannot beeco-efficiently recycled from landfill.Figure 11. Continued decoupling of plastics waste and landfill30,000Growth rate 1996-200825,00020,000~3.0%/yearMtonne15,00010,000-1.1%/year5,00001996 1997 1998 1999 2000 2001 2002 2003 2004 2005 2006 2007 2008Total post-user plastics wasteDisposal<strong>The</strong> figure shows the history for EU15+NO/CH until 2004 and for EU27+NO/CH from 2005 onwards.Figure 12. Strong continued growth of recycling and energy recovery8,000Growth rate 1996-2008: ~9.9%/year7,0006,000Mtonne5,0004,0003,000~9.6%/year~11.0%/year2,0001,000- 5.6%/year01995 1996 1997 1998 1999 2000 2001 2002 2003 2004 2005 2006 2007 2008Energy Recovery Mechanical Recycling Feedstock Recycling<strong>The</strong> figure shows the history for EU15+NO/CH until 2004 and for EU27+NO/CH from 2005 onwards.11
Slow but steady progress towards diverting plastics wastefrom landfillMaterial recycling and energy recovery of postconsumerplastics waste are very different by country.In Switzerland, Germany, Sweden and Denmark thereis very little landfill. <strong>The</strong>se countries have almostcompleted their diversion-from-landfill strategy.A recent study by the Swiss consultancy Prognos (1)showed that 7% of the EU Kyoto target for greenhousegas (GHG) emissions could be saved if all wastecurrently going to landfill was moved to a combinationof recycling and energy recovery. <strong>The</strong> best results wereachieved without specific targets but with full flexibilityto explore recycling and energy recovery for each wastestream. In addition to saving GHG emissions, diversionfrom landfill helps increase resource efficiency andenergy security, while reducing litter.Figure 13 shows that countries with high recoveryrates score highly on both recycling and energyrecovery. This means that a strategy which includesenergy recovery is not contradictory to achieving goodrecycling results. A complete resource managementstrategy, therefore, needs to address both areas.No country can recycle all post-consumer waste.Figure 13 also shows that whilst recycling performanceis similar across most <strong>Europe</strong>an countries there arebig differences in the utilisation of energy recovery.Countries which depend on landfills must not onlymaximise their full recycling potential but also quicklyexpand their energy-from- waste network.Diversion from landfill progress is, on average, slow.Recycling (mechanical+feedstock) across <strong>Europe</strong>increased from 20.4% in 2007 to 21.3% in 2008.Energy recovery increased from 29.2% in 2007 to30% in 2008. Significant efforts are necessary inmany Member States if they are to maximise the fullpotential of a diversion from landfill strategy (e.g.GHG emission savings, enhanced resource efficiencyand energy security and avoiding landfill penalties).Switzerland SwitzerlandDenmark DenmarkGermany GermanySweden SwedenBelgium BelgiumAustria AustriaNetherlands NetherlandsNorway NorwayLuxemburg LuxemburgFrance FranceItaly ItalySlovakia SlovakiaHungary HungaryFinland FinlandCzechia CzechiaSpain SpainPortugal PortugalEstonia EstoniaUK UKSlovenia SloveniaIreland IrelandLatvia LatviaRomania RomaniaPoland PolandBulgaria BulgariaMalta MaltaCyprus CyprusLithuania LithuaniaGreece GreeceTotal Recovery Ratio by Country 2008(referred to Post-Consumer Plastic Waste)0% 0% 20% 20% 40% 40% 60% 60% 80% 80% 100% 100%Figure 13. Recycling and energy recovery rate per countryRecycling Recycling rate 2008 rate 2008 Energy Energy Recovery Recovery rate 2008 rate 2008121 http://www.prognos.com/Singleview.306+M5c828d79ff6.0.html
Voluntary initiatives to stimulate the mechanical recyclingof PET bottlesPET bottle collection in <strong>Europe</strong> is steadily increasing;about 40% of all PET bottles are now collected forrecycling. This recycling rate must continue to increaseespecially in high value applications like food packaging.A good balance between new PET bottle technologiesand recyclability is needed. Consequently, several<strong>Europe</strong>an organisations involved in the PET recycle chainhave formed the <strong>Europe</strong>an PET Bottle Platform (EPBP).This voluntary initiative, aimed at the packagingindustry, will assess the impact of new PET bottledesigns on recyclability. This ‘front-end’ evaluationwill help to maintain the sustainability of PETrecycling industry in <strong>Europe</strong>.EPBP members include the recycling stakeholderssuch as PET producers, bottle makers, beverageproducers, recovery organisations and recyclers.PET bottle recyclability will be promoted by:• Creating harmonised <strong>Europe</strong>an guidelines for PETbottle recyclability via protocol development;• Encouraging the industry to test new PET bottleconcepts/materials before market launch;• Providing stakeholder guidance and recommendations;• Sharing knowledge across the value chain.To enable an independent evaluation of new technologiesand their impact on recycling, the Platformincludes technical experts from PET production, designand recycling. EPBP has established test proceduresto assess the recycling profile of new packagingtechnologies. e.g. barriers, additives, closures,labels, etc. Products passing these tests will be givenapproval thus ensuring that PET recycling continues tobuild on its successful track record.EPBP’s focus is to evaluate technologies/products andencourage new PET bottle innovations to ensure thatthe success of PET recycling is not compromised.For more information visit www.petbottleplatform.eu.New trends in recovery of packagingMany plastics pots, tubs and trays are made fromPolypropylene (PP), Polystyrene (PS) and Polyvinylchloride(PVC). Those packages are used for packingfruits, dairies, ice-cream and many others type of food.When looking into what could be done beyond bottlerecycling (e.g. HDPE and PET bottles), several EPROmembers have found out that the remaining rigidsplastics present in the selective collections are mainlycomposed of two resins; PP and PS.In France, for example, market evaluations and sortingcentre analysis have demonstrated that about 40% ofthe rigid plastics are composed of PP and 20% of PS,the rest being split between PET, HDPE and PVC.<strong>The</strong> next question is then if, and how, these packagescould be sorted, reclaimed and then recycled in newapplications.Some countries such as Germany, Italy and the UKhave already automatic sorting facilities capable ofsorting out these packages. Once sorted, they can besent to reclaimers, which have similar washing lineslike bottle recyclers, equipped with grinding, washing,drying and in some cases extruding equipment. <strong>The</strong>reprocessed flakes or pellets can then be used toreplace virgin material in new applications, such ashangers, flower pots, pallets, crates and car parts.EPRO is currently undertaking tests with <strong>Plastics</strong><strong>Europe</strong>to define which further applications could be reachedwith these recyclates, and what kind of extra equipment(if any) it would take for the reclaimer/recycler to reachthose new markets.13
Mechanical recycling of food grade HDPE in the UK<strong>The</strong> UK has conducted much research and developmentin recent years on recycling HDPE milk containersinto recompounded pellets suitable for use in foodgrade applications. Research commissioned by WRAP(the Waste & Resources Action Programme) suggeststhat producing food grade HDPE is both technicallyachievable and commercially viable.This research, along with interest from the plasticsrecycling industry, has been driven by demand for foodgrade polymer from plastic bottle converters. <strong>The</strong>seinclude Nampak who manufacture most of the UK’splastic milk containers, and retailers, including Marksand Spencer.waste stream. (Around 80% of the HDPE wastebottle fraction). Natural HDPE milk bottles must besorted to a polymer and colour purity of 99% priorto reprocessing. In the UK, automatic NIR sortingequipment is used, followed by a final manualinspection and sort stage.<strong>The</strong> bottles are flaked and washed, before passingthrough automatic flake sorting equipment. Thisremoves any remaining contamination (e.g. particles ofmetals, wood, glass, etc) and any coloured HDPE whichmay have entered the recycling process. <strong>The</strong> final stepis extrusion of the flake – at a high temperature andunder vacuum – to produce a recompounded pellet.<strong>The</strong> first two plants capable of producing food gradeHDPE pellets came on stream during 2008. As moreUK reprocessors begin to install equipment productionwill increase further. To date, Nampak has signedsupply contracts for 24,000 tonnes per annum of foodgrade HDPE from UK reprocessors. This should enablethe company to meet its target of using 30% recycledHDPE in all its plastic milk containers by 2010.Unlike other <strong>Europe</strong>an countries, the productionof food grade HDPE in the UK is helped by the highpercentage of natural HDPE milk bottles in the plasticDemand for recycled HDPE for use in food contactapplications is still strong, despite current economicconditions (especially compared to demand from theconstruction and automotive sectors). <strong>The</strong> timing ofthis additional HDPE reprocessing capacity is idealbecause of recent increases in the UK’s plastic bottlerecovery rates.Similar developments are happening with the productionof food grade PET. WRAP recently commissionedresearch to investigate if food grade PP can be producedusing a similar process to that used for HDPE.14
Mechanical recyclingof agricultural film – aNorwegian success story<strong>The</strong> collection of agricultural film in Norway began in themid-90s, before the introduction of the national plasticrecycling scheme. Norwegian farmers took environmentalresponsibility for sorting their used plastics (althoughparticipation was legally enforceable). Farms in Norwayare widespread and face two main challenges forcollection and recycling: maintaining a good quality offilm collected from farms and greenhouses and providingefficient transport to cover long distances.Collection systemMost farmers collect their agricultural films and otherrecyclables and drive to the local recycling station. Largerfarms are often visited by waste collectors. Green DotNorway cooperates with about 100 waste collectorsnationwide. <strong>The</strong>y collect and ensure bales are of the rightquality and weight. Green Dot makes agreements withrecyclers on behalf of the local recycling businesses.Lower CO 2 -emissions<strong>The</strong>re are challenges. Agricultural film needs cleaningbefore it can be recycled (caused by soil, small stones,water etc). In 2008, a licence fee was paid for 8.666tonnes of agricultural films. Of this 7232 tonnes – or83% – were recycled saving up to 2kg of CO 2 per kgplastics compared to using virgin material.Feedstock recycling<strong>The</strong> use of plastic waste in iron ore production is avaluable and familiar feedstock recycling application.Traditionally, iron production used coal and coke asa reduction agent in the blast furnace.Later, heavy liquid petroleum fractions replaced coalbecause it was easy to handle and saved money.Plastic waste first substituted heavy fuel oils inthe 1990s. Several German companies have usedapproximately 300k tonnes per year of ground plasticwaste in their blast furnaces.Voest-Alpine in Austria has now developed in-houseexpertise to use mixed plastics waste in their blastfurnace operation. <strong>The</strong>y substitute almost 25% of theoil with mixed plastics waste (1) .Current iron production can use a maximum of approximately220k tonnes per year of mixed plastics waste.<strong>The</strong> operation has proved reliable and performs wellenvironmentally. Using mixed plastics instead of oil in ironproduction is more eco-efficient than when it is used justas a fuel e.g. in cement production. It is also classified asrecycling in the revised Waste Framework Directive.1 Identiplast<strong>2009</strong> Conference, April 20-21, Thomas Buergl15
Energy from Waste<strong>The</strong> recovery of energy from waste in <strong>Europe</strong> datesback 100 years. Today about 420 plants treat 64 milliontonnes of municipal, commercial and industrial wasteevery year to produce electricity for 7 million householdsand heat for 13.4 million household. This also reducesCO 2 emissions per year by 23 million tonnes; equivalentto taking 11 million cars off our roads.<strong>The</strong> EU member states demonstrate very different“energy from waste” footprint and can be divided intothree groups.Strong position for EfWAustria, Belgium, Denmark, Germany, the Netherlands,Sweden and Switzerland have demand and supply inbalance and use EfW extensively.<strong>The</strong> EfW route is technically, environmentally andeconomically fully proven. If <strong>Europe</strong> used the fullpotential of its residual waste stream, using the EfWtechnology, it could bring electricity to 17 millionhouseholds and heat 24 million households.Example DenmarkDenmark has the highest per capita production ofboth power and heat from EfW plants in <strong>Europe</strong>.<strong>The</strong> 30 EfW plants use 3.5 million tonnes of wasteper year to produce 5% of the national need forelectricity and 20% of the heat need. <strong>The</strong> districtheating system today covers 53% of the heatingmarket and this is planned to increase to 70% by2030 by increasing the amount of waste treated inEfW plants to between 4.5-5 million tonnes per year.EfW can be expandedIreland, Italy, France, Portugal and Spain offer marketopportunities for growth but also market barriers.Major growth potential<strong>The</strong> Czech Republic, Greece, Poland and the UK alloffer major growth opportunities which require verylarge investments.16
<strong>The</strong> Greater Manchesterwaste management solution– a model for divertingwaste from landfill?Greater Manchester is comprised of 9 boroughs in theNorth West of England and has about 1 million households.<strong>The</strong>y generate 1.3 million tonnes of municipalsolid waste, which is about 5% of the UK’s total.Greater Manchester has outsourced the managementof their waste in a 25-year contract estimated to cost£3.8billion through which they expect to save theirtaxpayers around £1 per household per week.<strong>The</strong> planned solution will achieve recycling andcomposting of at least 50% of the municipal waste,which meets both the UK waste strategy and therecently revised Waste Framework Directive for 2020.will produce heat and power for the neighbouringINEOS chemical manufacturing operation. <strong>The</strong>plant, which received planning permission from theUK Government in September 2008, will have thecapacity to take 750.000 tonnes/year of SRF, andcould produce 100MW electricity and 360MW heat atfull capacity representing 20% of the INEOS energyneeds at Runcorn.In addition to the saving for taxpayers, GreaterManchester will reduce their dependence on landfillfrom today’s 65% to below 25% thereby minimisinglandfill penalties and the need to open new landfillsites.For the non-recyclable fraction, treatment in amechanical biological treatment (MBT) plant withanaerobic digestion is planned. This treatment willtake out the compostable content and producemethane for energy use. From the 570.000 tonnesper year of non-recyclables, the output stream willbe about 275.000 tonnes/year of a fuel called SolidRecovered Fuel – SRF, which has a higher calorificcontent than un-treated municipal waste.For INEOS the investment will secure part of their energyneed with a fuel which is disconnected from the volatilityof fossil fuels and which is locally sourced thus reducingthe need to import energy from outside the UK.In addition to the waste taken from Greater Manchester,the INEOS facility will have the potential to take wastefrom other neighbouring waste disposal authorities inthe North West region.<strong>The</strong> SRF produced from municipal solid waste thatcannot be recycled will be transported to a newEnergy from Waste CHP (combined heat and power)plant at Runcorn, which is being built by a consortiumof INEOS Chlor, Viridor and John Laing. This plant<strong>The</strong> Greater Manchester model provides an integratedresource management solution where complementarytechnologies are combined to utilise the full potentialof the value of the waste to the benefit of taxpayers,the country and the environment.17
Mobility<strong>Plastics</strong>’ prominent role in the automotive technologyis now an established fact. Thanks to their light weightand potential for modularity, plastics help make carsless pollutant, safer and more comfortable.Thanks to plastics, development in the automotivetechnology have been taken a step further with racingsolar cars such as Nuna. <strong>The</strong> Nuna car ran, and won, a3000 km race travelling at an average speed of 91 km/h,right across Australia, powered by solar energy alone.To run such a long distance, under such harsh climaticconditions, the car had to be light and strong. That’swhy the entire bodywork was built in carbon fibre,reinforced on the outside with kevlar. Kevlar is yetanother extremely strong plastics material and, assuch, used in bullet-proof vests; and spacesuits forprotection against micrometeorites. <strong>The</strong> kevlar layerin the Nuna protects the car against the impact offlying gravel during a race.Intelligent roofingThanks to plastics, architects can nowadays combineboth aesthetics and energy efficiency. With recycledplastics, another breakthrough has been achieved inharnessing solar energy. An American company hasnow taken solar panel design to a whole new level byintegrating them into roof tiles. <strong>The</strong> unique designs areintegrated right into roof tiles which then serve a dualpurpose: offering traditional roofing protection andsolar panels at the same time.<strong>The</strong> tiles are made from lightweight recycled plastic,moulded together with a flexible solar cell. In addition,the polymers employed in the tile can be recycled oncethe product reaches its end of life.<strong>The</strong>se are just few examples of how plastics contribute toenhancing our lives and well-being, whilst contributingsignificantly to the sustainable development of society.Nuna is currently in its 5th edition and is being builtby the Nuon Solar Team ready to compete in the <strong>2009</strong>World Solar Challenge which begins on 05 October <strong>2009</strong>.Source: Photo SRS Energy, Solé Power Tile19
Recovery trends by applicationPackaging<strong>The</strong> packaging application has the longest historyof recovery and contributes about 63% of end-oflifequantity. Not surprisingly the major part of whatis today recycled therefore comes from packaging.40% of bottles and industrial film are now beingmechanically recycled across <strong>Europe</strong>. Well over 90%of crates and boxes are recycled. Recycling rates forthe remaining mixed plastics are still low – below 10%across <strong>Europe</strong>. In total the collection for recycling ofpost-consumer packaging grew in 2008 to an averageof 29%, up from 28% in 2007.Figure 14 shows the <strong>Europe</strong>an countries performingabove and below the packaging directive target of22.5% for 2008.Figure 14. Total recycling of plastics packaging waste by country
MethodologyThis brochure on 2008 production, demand andrecovery is the nineteenth annual publication by the<strong>Europe</strong>an plastics manufacturers and their partners.<strong>The</strong> aim of this brochure is to illustrate the life-cycleof plastics from development and production, throughtheir many uses, to the advances made in recoveringplastics at their end-of-life phase.<strong>Plastics</strong><strong>Europe</strong>’s Market Research and Statistics Group(PEMRG) provided input on the production of, anddemand for, plastics raw materials.<strong>The</strong> end-of-life phase data was collected by apartnership involving <strong>Plastics</strong><strong>Europe</strong>, EuPC(the <strong>Europe</strong>an <strong>Plastics</strong> Converters), EuPR(the <strong>Europe</strong>an <strong>Plastics</strong> Recyclers) and EPRO(the <strong>Europe</strong>an Association of <strong>Plastics</strong> Recyclingand Recovery Organisations).Consultic Marketing & Industrieberatung GmbHhelped assess waste generation and recovery data.Official statistics have been used for recovery data, whereavailable, from <strong>Europe</strong>an or National authorities andwaste management organisations. Research or expertisefrom consultants was used to complete any gaps.<strong>The</strong> figures cannot always be directly compared toprevious ones due to changes in the estimates of bothmarket demand and the waste generated. However,overall differences are small. Earlier estimates havebeen revised to enable past progress to be tracked forboth the use and recovery of plastics across <strong>Europe</strong>during the last decade.Figures and graphs in this report are showing datafor EU27+ Norway and Switzerland – called <strong>Europe</strong>.Any other group of countries is specifically mentioned.21
Who are we?<strong>The</strong> <strong>Europe</strong>an plastics industry contributes significantlyto the welfare of <strong>Europe</strong>. <strong>Plastics</strong> encourage innovation,improve quality of life, and facilitate resource efficiencyand climate protection. More than 1.6 million peoplework in 50.000 companies – many in SMEs for theconversion sector – generating a turnover of € 300 billionper year.<strong>Plastics</strong><strong>Europe</strong> is a leading <strong>Europe</strong>an trade association,with offices in Brussels, Frankfurt, London, Madrid,Milan and Paris. We network with <strong>Europe</strong>an andnational plastics associations; and our 100 membercompanies produce over 90% of all polymers in the EU27 Member States plus Norway, Switzerland, Croatiaand Turkey.EuPC – the <strong>Europe</strong>an <strong>Plastics</strong> Converters – is theprofessional representative body of plastics convertersin <strong>Europe</strong>. <strong>The</strong>ir activities cover all sectors of theplastics converting industry, including recycling. <strong>The</strong>irmain objective is to defend and promote the <strong>Europe</strong>anplastics converting industry’s interests by:• Voicing industry opinion to <strong>Europe</strong>an andinternational institutions and NGOs;• Maintaining relationships with corresponding<strong>Europe</strong>an and global organisations;• Conducting surveys, studies and research projectscovering all areas of the plastics processingindustry.EuPR – the <strong>Europe</strong>an <strong>Plastics</strong> Recyclers – is theprofessional representative body of plastics recyclers in<strong>Europe</strong>. EuPR promotes plastics mechanical recyclingand an environment that encourages profitable andsustainable business. <strong>The</strong>y provide a platform formembers, who represent 85% of <strong>Europe</strong>’s recyclingcapacity, processing over 5 million tonnes of collectedplastics per year.EPRO – the <strong>Europe</strong>an Association of <strong>Plastics</strong> Recyclingand Recovery Organisations – is the association ofthe national organisations responsible for organisingand promoting recycling and recovery in <strong>Europe</strong>.EPRO provides a unique forum for leading <strong>Europe</strong>anspecialists in plastics waste management to exchangelearnings, develop integrated plastics packaging wastestrategies and support technological development.22
Snapshots <strong>2009</strong><strong>The</strong> plastics business developed positively until mid2008. What happened thereafter is unprecedented inplastics. Never in the relatively short history of plasticshas such a market deterioration happened in soshort a period of time. From January to June <strong>2009</strong>, theproduction of plastics in the EU27 has dropped by 26%compared to the same period in 2008. Compared to thelevel that the market had reached before the start of thefall, in autumn 2008, plastics demand has fallen by morethan 30%. Since spring <strong>2009</strong> the situation has stabilised– at a very low level – and only started to show signs ofrecovery in the 2nd quarter of <strong>2009</strong> for plastics.As this brochure went to press in September <strong>2009</strong>, wehave begun to see signs of a turnaround in demandfor plastics and converted products. Demand has beenslowly returning but is far from pre-recessionary levelsand a full recovery is likely to take several years.Due to the global economic crisis – for the first timein many years – the total quantity of plastic wastegenerated will decrease year-on-year. Recyclingvolumes in <strong>Europe</strong> are expected to decrease between5-10 % for the first 6 months of <strong>2009</strong>, and for the fullyear are expected to be at a lower level than in 2008.Converted plastics products have been slightly lessaffected – having lost 18% in production during Januaryto June compared to 2008. <strong>Plastics</strong> – serving manydifferent markets – have met a varying response fromdifferent industries. Whilst demand from packaginghas only fallen a very little, the demand from theautomotive industry has dropped by 40%. <strong>The</strong> drop indemand for the construction industry has also beensignificant. As in earlier turbulent times, we have seenrestructuring, temporary shutdowns and plant closuresin all parts of the plastics industry.Due to the drastic reduction in demand for recyclates,prices fell by more than 50 % in latter part of 2008,but have since gradually recovered. Especially forhigher quality recyclates the market shows a positivetrend. This indicates the need for strong nationalrecovery schemes, with sufficient financial reservesand programmes to improve the quality of the collectedplastics.Figure 15. <strong>Plastics</strong> industry production in EU27130Source: Eurostat/<strong>Plastics</strong><strong>Europe</strong> Market Research Group (PEMRG)120110Index (2005= 100 Trend cycle)10090807060501990 1991 1992 1993 1994 1995 1996 1997 1998 1999 2000 2001 2002 2003 2004 2005 2006 2007 2008 <strong>2009</strong><strong>Plastics</strong> in Primary FormsManufacture of <strong>Plastics</strong> Products23
<strong>2009</strong>-12Avenue de Cortenbergh 66P.O Box 4B-1000 Brussels - BelgiumPhone +32 (0)2 732 4124Fax +32 (0)2 732 4218www.plasticsconverters.euRue du Commerce 31B-1000 Brussels - BelgiumPhone +32 (0)2 456 8449Fax +32 (0)2 456 8339www.epro-plasticsrecycling.orgAvenue de Cortenbergh 66P.O Box 4B-1000 Brussels - BelgiumPhone +32 (0)2 742 9682Fax +32 (0)2 732 6312www.plasticsrecyclers.euAvenue E. van Nieuwenhuyse 4/3B-1160 Brussels - BelgiumPhone +32 (0)2 675 3297Fax +32 (0)2 675 3935info@plasticseurope.orgwww.plasticseurope.org