Microscopic and molecular methods for quantitative phytoplankton ...
Microscopic and molecular methods for quantitative phytoplankton ...
Microscopic and molecular methods for quantitative phytoplankton ...
- No tags were found...

You also want an ePaper? Increase the reach of your titles
YUMPU automatically turns print PDFs into web optimized ePapers that Google loves.
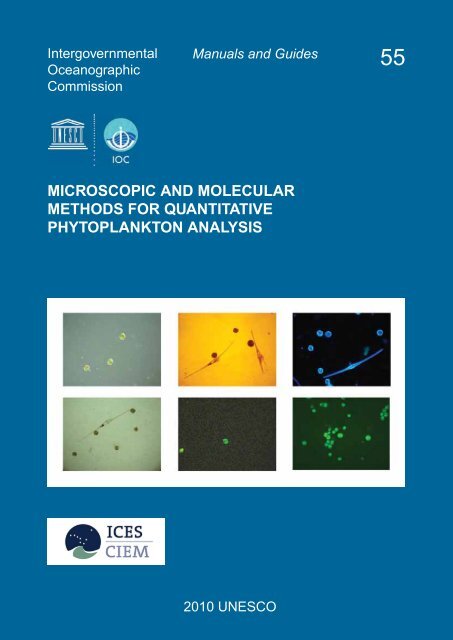
IntergovernmentalOceanographicCommissionManuals <strong>and</strong> Guides55MICROSCOPIC AND MOLECULARMETHODS FOR QUANTITATIVEPHYTOPLANKTON ANALYSIS2010 UNESCO
IOC Manuals <strong>and</strong> GuidesNo.Title1 rev. 2 Guide to IGOSS Data Archives <strong>and</strong> Exchange (BATHY <strong>and</strong> TESAC). 1993. 27 pp. (English,French, Spanish, Russian)2 International Catalogue of Ocean Data Station. 1976. (Out of stock)3 rev. 3 Guide to Operational Procedures <strong>for</strong> the Collection <strong>and</strong> Exchange of JCOMM OceanographicData. Third Revised Edition, 1999. 38 pp. (English, French, Spanish, Russian)4 Guide to Oceanographic <strong>and</strong> Marine Meteorological Instruments <strong>and</strong> Observing Practices.1975. 54 pp. (English)5 rev. 2 Guide <strong>for</strong> Establishing a National Oceanographic Data Centre. Second Revised Edition, 2008.27 pp. (English) (Electronic only)6 rev. Wave Reporting Procedures <strong>for</strong> Tide Observers in the Tsunami Warning System. 1968. 30 pp.(English)7 Guide to Operational Procedures <strong>for</strong> the IGOSS Pilot Project on Marine Pollution (Petroleum)Monitoring. 1976. 50 pp. (French, Spanish)8 (Superseded by IOC Manuals <strong>and</strong> Guides No. 16)9 rev. Manual on International Oceanographic Data Exchange. (Fifth Edition). 1991. 82 pp. (French,Spanish, Russian)9 Annex I (Superseded by IOC Manuals <strong>and</strong> Guides No. 17)9 Annex II Guide <strong>for</strong> Responsible National Oceanographic Data Centres. 1982. 29 pp. (English, French,Spanish, Russian)10 (Superseded by IOC Manuals <strong>and</strong> Guides No. 16)11 The Determination of Petroleum Hydrocarbons in Sediments. 1982. 38 pp. (French, Spanish,Russian)12 Chemical Methods <strong>for</strong> Use in Marine Environment Monitoring. 1983. 53 pp. (English)13 Manual <strong>for</strong> Monitoring Oil <strong>and</strong> Dissolved/Dispersed Petroleum Hydrocarbons in Marine Waters<strong>and</strong> on Beaches. 1984. 35 pp. (English, French, Spanish, Russian)14 Manual on Sea-Level Measurements <strong>and</strong> Interpretation. (English, French, Spanish, Russian)Vol. I: Basic Procedure. 1985. 83 pp. (English)Vol. II: Emerging Technologies. 1994. 72 pp. (English)Vol. III: Reappraisals <strong>and</strong> Recommendations as of the year 2000. 2002. 55 pp. (English)Vol. IV: An Update to 2006. 2006. 78 pp. (English)15 Operational Procedures <strong>for</strong> Sampling the Sea-Surface Microlayer. 1985. 15 pp. (English)16 Marine Environmental Data In<strong>for</strong>mation Referral Catalogue. Third Edition. 1993. 157 pp.(Composite English/French/Spanish/Russian)17 GF3: A General Formatting System <strong>for</strong> Geo-referenced DataVol. 1: Introductory Guide to the GF3 Formatting System. 1993. 35 pp. (English, French, Spanish,Russian)Vol. 2: Technical Description of the GF3 Format <strong>and</strong> Code Tables. 1987. 111 pp. (English,French, Spanish, Russian).17 Vol. 3: St<strong>and</strong>ard Subsets of GF3. 1996. 67 pp. (English)Vol. 4: User Guide to the GF3-Proc Software. 1989. 23 pp. (English, French, Spanish, Russian)Vol. 5: Reference Manual <strong>for</strong> the GF3-Proc Software. 1992. 67 pp. (English, French, Spanish,Russian)Vol. 6: Quick Reference Sheets <strong>for</strong> GF3 <strong>and</strong> GF3-Proc. 1989. 22 pp. (English, French, Spanish,Russian)18 User Guide <strong>for</strong> the Exchange of Measured Wave Data. 1987. 81 pp. (English, French, Spanish,Russian)To be continued on page 113
IntergovernmentalOceanographicCommissionManuals <strong>and</strong> Guides55MICROSCOPIC AND MOLECULAR METHODS FORQUANTITATIVE PHYTOPLANKTON ANALYSISeditorsBengt Karlson, Caroline Cusack <strong>and</strong> Eileen Bresnan2010 UNESCO
The designations employed <strong>and</strong> the presentations of thematerial in this publication do not imply the expression ofany opinion whatsoever on the part of the Secretariats ofUNESCO <strong>and</strong> IOC concerning legal status of any countryor territory, or its authorities, or concerning the delimitationsof the frontiers of any country or territory.For bibliographic purposes, this document should becited as follows:Intergovernmental Oceanographic Commission of©UNESCO. 2010. Karlson, B., Cusack, C. <strong>and</strong> Bresnan, E.(editors). <strong>Microscopic</strong> <strong>and</strong> <strong>molecular</strong> <strong>methods</strong> <strong>for</strong> <strong>quantitative</strong><strong>phytoplankton</strong> analysis. Paris, UNESCO. (IOC Manuals<strong>and</strong> Guides, no. 55.) (IOC/2010/MG/55)110 pages.(English only)Published in 2010by the United Nations Educational, Scientific <strong>and</strong> CulturalOrganization7, Place de Fontenoy, 75352, Paris 07 SPUNESCO 2010Printed in Spain
<strong>Microscopic</strong> <strong>and</strong> Molecular Methods <strong>for</strong> Quantitative Phytoplankton AnalysisContentsPreamble 2Foreword 31 Introduction to <strong>methods</strong> <strong>for</strong> <strong>quantitative</strong> <strong>phytoplankton</strong> analysis 52 The Utermöhl method <strong>for</strong> <strong>quantitative</strong> <strong>phytoplankton</strong> analysis 133 Settlement bottle method <strong>for</strong> <strong>quantitative</strong> <strong>phytoplankton</strong> analysis 214 Counting chamber <strong>methods</strong> <strong>for</strong> <strong>quantitative</strong> <strong>phytoplankton</strong> analysis - 25haemocytometer, Palmer-Maloney cell <strong>and</strong> Sedgewick-Rafter cell5 Filtering – calcofluor staining – <strong>quantitative</strong> epifluorescence microscopy <strong>for</strong> <strong>phytoplankton</strong> analysis 316 Filtering – semitransparent filters <strong>for</strong> <strong>quantitative</strong> <strong>phytoplankton</strong> analysis 377 The filter - transfer - freeze method <strong>for</strong> <strong>quantitative</strong> <strong>phytoplankton</strong> analysis 418 Imaging flow cytometry <strong>for</strong> <strong>quantitative</strong> <strong>phytoplankton</strong> analysis — FlowCAM 479 Detecting intact algal cells with whole cell hybridisation assays 5510 Electrochemical detection of toxic algae with a biosensor 6711 Hybridisation <strong>and</strong> microarray fluorescent detection of <strong>phytoplankton</strong> 7712 Toxic algal detection using rRNA-targeted probes in a semi-automated s<strong>and</strong>wich hybridization <strong>for</strong>mat 8713 Quantitative PCR <strong>for</strong> detection <strong>and</strong> enumeration of <strong>phytoplankton</strong> 9514 Tyramide signal amplification in combination with fluorescence in situ hybridisation 103Appendix: Acronyms <strong>and</strong> Notation 1091
IOC Manuals & Guides no 55PreambleHenrik Enevoldsen*IOC Science <strong>and</strong> Communication Centre on Harmful AlgaeUniversity of Copenhagen,Øster Farimagsgade 2D, DK-1353 Copenhagen K, Denmark*e-mail address: h.enevoldsen@unesco.orgThe Intergovernmental Oceanographic Commission of UNESCO has since 1992 given attention to activities aimed at developingcapacity in research <strong>and</strong> management of harmful microalgae. With this IOC Manual & Guide we wish to fill a gap <strong>for</strong>in<strong>for</strong>mation <strong>and</strong> guidance, in an easy accessible <strong>and</strong> low cost <strong>for</strong>mat, to comparison between traditional <strong>and</strong> modern <strong>methods</strong><strong>for</strong> enumeration of <strong>phytoplankton</strong>. Enumeration of harmful <strong>phytoplankton</strong> species is a key element in many monitoring programmesto protect public health, seafood safety, markets, tourism, etc. However, <strong>phytoplankton</strong> enumeration has self evidentlymuch broader application that just monitoring of harmful microalgae species.One important task of the IOC <strong>and</strong> UNESCO is to synthesize the available field <strong>and</strong> laboratory research techniques <strong>for</strong> applicationsto help solve problems of society as well as facilitate further research <strong>and</strong> especially systematic observations <strong>and</strong> datagathering. The results include the publications in the ‘IOC Manuals <strong>and</strong> Guides’ series, <strong>and</strong> the UNESCO series ‘Monographsin Oceanographic Methodology’. The easy access to manuals <strong>and</strong> guides of this type is essential to facilitate knowledge exchange<strong>and</strong> transfer, the related capacity building, <strong>and</strong> <strong>for</strong> the establishment of ocean <strong>and</strong> coastal observations in the framework of theGlobal Ocean Observing System.The IOC is highly appreciative of the ef<strong>for</strong>ts of the ICES-IOC Working Group on Harmful Algal Bloom Dynamics in organizingthe Joint ICES-IOC Intercomparison Workshop on New <strong>and</strong> Classic Techniques <strong>for</strong> Estimation of Phytoplankton Abundanceat the Kristineberg Marine Research Station in Sweden 2005, <strong>and</strong> not the least the ef<strong>for</strong>ts of the scientists who preparedthe manuscripts <strong>for</strong> this IOC Manual & Guide. The IOC wishes to express its particular thanks to Dr. Bengt Karlson, SMHISweden, Editor-in-Chief, <strong>for</strong> his determination to produce this volume.The scientific opinions expressed in this work are those of the authors <strong>and</strong> are not necessarily those of UNESCO <strong>and</strong> its IOC.Equipment <strong>and</strong> materials have been cited as examples of those most currently used by the authors, <strong>and</strong> their inclusion does notimply that they should be considered as preferable to others available at that time or developed since.The publication of this IOC Manual & Guide has been made possible through support from the United States National Oceanic<strong>and</strong> Atmospheric Administration <strong>and</strong> the Department of Biology, University of Copenhagen, Denmark.Henrik EnevoldsenIOC Harmful Algal Bloom Programmehttp://ioc.unesco.org/hab2
<strong>Microscopic</strong> <strong>and</strong> Molecular Methods <strong>for</strong> Quantitative Phytoplankton AnalysisForewordPhytoplankton occupy the base of the food web of the sea. It plays a vital role in the global carbon cycle <strong>and</strong> is also of importancesince some <strong>phytoplankton</strong> may cause harmful algal blooms, a problem e.g. <strong>for</strong> aquaculture. Man induced changes in the environment,e.g. eutrophication, can be manifested in changes in the <strong>phytoplankton</strong> community <strong>and</strong> there is now some evidencethat climate change may also be having an effect. Phytoplankton analysis is an essential part in the process of underst<strong>and</strong>ing <strong>and</strong>predicting changes in our environment. Recent introduction of new <strong>methods</strong>, several based on <strong>molecular</strong> biology, has led to aperceived need <strong>for</strong> a manual on <strong>quantitative</strong> <strong>phytoplankton</strong> analysis.The aim of this publication is to provide a guide <strong>for</strong> <strong>phytoplankton</strong> analysis <strong>methods</strong>. A number of different <strong>methods</strong> are described<strong>and</strong> in<strong>for</strong>mation about applicability, cost, training, equipment etc. is included to facilitate in<strong>for</strong>mation on choosing theright method <strong>for</strong> a certain purpose. The costs of equipment, consumables, etc. are based on 2009 prices. Although the <strong>methods</strong>described are <strong>for</strong> marine plankton they are also applicable <strong>for</strong> freshwater plankton. The method descriptions are more detailedthan what is usually found in scientific articles to make the descriptions useful when setting up monitoring or research programmesthat include inexperienced researchers. Some of the <strong>methods</strong> described are relatively old <strong>and</strong> well tested while a fewmust be considered to be emerging technology. We hope that this publication will supplement existing literature <strong>and</strong> that thedistribution of the book freely using the Internet will make it useful in environmental monitoring <strong>and</strong> <strong>for</strong> students, researchers<strong>and</strong> regulators. A book like this can never be complete. Some <strong>methods</strong> are missing <strong>and</strong> newer techniques are under development.The production of this book was initiated during an international workshop at Kristineberg Marine Research Station in Sweden2005. Participants in the Joint ICES/IOC Intercomparison Workshop on New <strong>and</strong> Classic Techniques <strong>for</strong> Estimation of PhytoplanktonAbundance (WKNCT) agreed to write chapters of the book. A scientific paper describing the results of this workshop can befound in Godhe et al. (2007). Co-authors have joined some of the workshop participants. The Harmful Algal Bloom programmeof the Intergovernmental Oceanographic Commission, of UNESCO, has aided in the production <strong>and</strong> also financed the printingof the book. We would like to express our gratitude to everyone who has been involved in the production of this book. Inparticular the editors would like to acknowledge the time <strong>and</strong> ef<strong>for</strong>t contributed to the final edits <strong>and</strong> proof reading by JacobLarsen <strong>and</strong> Pia Haecky.Bengt Karlson, Caroline Cusack <strong>and</strong> Eileen BresnanReferenceGodhe A, Cusack C, Pedersen J, Andersen P, Anderson DM, Bresnan E, Cembella A, Dahl E, Diercks S, Elbrächter M, Edler L, Galuzzi L,Gescher C, Gladstone M, Karlson B, Kulis D, LeGresley M, Lindahl O, Marin R, McDermott G, Medlin MK, Naustvoll L-J, Penna A, TöbeK (2007) Intercalibration of classical <strong>and</strong> <strong>molecular</strong> techniques <strong>for</strong> identification of Alex<strong>and</strong>rium fundyense (Dinophyceae) <strong>and</strong> estimation ofcell densities. Harmful Algae 6: 56-723
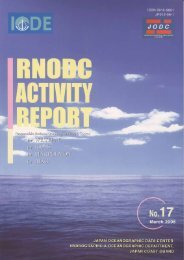
<strong>Microscopic</strong> <strong>and</strong> Molecular Methods <strong>for</strong> Quantitative Phytoplankton AnalysisChapter 1 Introduction to <strong>methods</strong> <strong>for</strong> <strong>quantitative</strong> <strong>phytoplankton</strong> analysis1 Introduction to <strong>methods</strong> <strong>for</strong> <strong>quantitative</strong><strong>phytoplankton</strong> analysisBengt Karlson 1* , Anna Godhe 2 , Caroline Cusack 3 <strong>and</strong> Eileen Bresnan 41Swedish Meteorological <strong>and</strong> Hydrological Institute, Research & development, Oceanography, Sven Källfelts gata 15, SE-426 71 VästraFrölunda, Sweden2Department of Marine Ecology, Göteborg university, Carl Skottbergs Gata 22, SE-413 19 Göteborg, Sweden3Marine Institute, Rinville, Oranmore, Co. Galway, Irel<strong>and</strong>4Marine Scotl<strong>and</strong> Marine Laboratory, 375 Victoria Road, Aberdeen AB11 9DB, UK*Author <strong>for</strong> correspondence e-mail: bengt.karlson@smhi.seBackgroundPhytoplankton is a critical component of the marine ecosystemas they are responsible <strong>for</strong> approximately half of the global(terrestrial <strong>and</strong> marine) net primary production (Field etal. 1998). Today approximately 4000 marine <strong>phytoplankton</strong>species have been described (Simon et al. 2009). They havethe potential to serve as indicators of hydro-climatic changeresulting from global warming as well as other environmentalimpacts, such as ocean acidification due to combustion offossil fuels <strong>and</strong> eutrophication. Under certain environmentalconditions <strong>phytoplankton</strong> can experience elevated growthrates <strong>and</strong> attain high cell densities. This is known as an algalbloom. There are different types of algal blooms. Someare natural events such as the spring diatom bloom where, attemperate latitudes, there is a burst of diatom growth duringspring time as a response to increasing light availability, temperature<strong>and</strong> water column stabilisation. This is part of theannual <strong>phytoplankton</strong> cycle in these regions. Some bloomscan have a negative impact on the marine system <strong>and</strong> aquacultureindustry <strong>and</strong> are termed ‘Harmful Algal Blooms’(HABs). Some HAB species such as the dinoflagellate, Kareniamikimotoi, <strong>for</strong>m high density blooms with millions ofcells per Litre discolouring the water <strong>and</strong> causing anoxia asthe bloom dies off. This can result in benthic mortalities suchas starfish, lugworms <strong>and</strong> fish. In contrast, low cell densitiesof species of the dinoflagellate genus Alex<strong>and</strong>rium (2,000 cellsL -1 ) have been associated with closures of shellfish harvestingareas owing to elevated levels of the toxins responsible <strong>for</strong>paralytic shellfish poisoning. These are also called HABs eventhough they are present at low cell densities.Many regions of the world implement <strong>phytoplankton</strong> monitoringprogrammes to protect their aquaculture industry.These programmes provide advice about the potential <strong>for</strong>toxic events <strong>and</strong> improve local knowledge of the dynamics oftoxic <strong>phytoplankton</strong> in the area. The European Union (EU)member states are legally obliged to monitor their shellfishproduction areas <strong>for</strong> the presence of toxin producing <strong>phytoplankton</strong>.Marine environmental policy has increased inimportance <strong>and</strong> a number of directives has been developedto monitor water quality. The Water Framework Directive(WFD) uses <strong>phytoplankton</strong> as one of the ecosystem componentsrequired to monitor the quality status of marine <strong>and</strong>freshwater bodies. Phytoplankton is also a required biologicalcomponent of the EU Marine Strategy Framework Directive,devised to protect <strong>and</strong> conserve the marine environment. TheInternational Maritime Organization (IMO) adopted the BallastWater Convention in 2004 although it has not yet beenratified. This convention includes a ballast water dischargest<strong>and</strong>ard whereby ships will be required to treat or manageballast water to ensure that no more than 10 organisms permL in the size category >10 µm - < 50 µm <strong>and</strong> no more than10 organisms per m 3 >50 µm are discharged.Thus, there is a requirement to be able to describe <strong>and</strong>monitor the abundance, composition <strong>and</strong> diversity of the<strong>phytoplankton</strong> community. A variety of different <strong>methods</strong>have been developed to identify <strong>and</strong> enumerate <strong>phytoplankton</strong>.Descriptions of many of these can be found in twoUNESCO-produced volumes: The Phytoplankton manual,edited by Sournia, was published in 1978. This volume providesa comprehensive description of many traditional lightmicroscopy <strong>methods</strong> used to enumerate <strong>phytoplankton</strong>. Itis currently out of print <strong>and</strong> many laboratories have foundit difficult to obtain a copy. The Manual on Harmful MarineMicroalgae edited by Hallegraeff et al. was first publishedin 1995 with a revised second edition published in 2004. Itprovides in<strong>for</strong>mation on the taxonomy <strong>and</strong> methodology involvedin operating <strong>phytoplankton</strong> <strong>and</strong> biotoxin monitoringprogrammes.The present manual aims to provide detailed step by stepguides on how to use microscope based <strong>and</strong> <strong>molecular</strong> <strong>methods</strong><strong>for</strong> <strong>phytoplankton</strong> analysis. Most of the <strong>molecular</strong> <strong>methods</strong>are aimed only at selected target species while some ofthe microscope based <strong>methods</strong> can be used <strong>for</strong> a large partof the <strong>phytoplankton</strong> community. Methods <strong>for</strong> analyzingautotrophic picoplankton are not included in this manual.Common <strong>methods</strong> <strong>for</strong> this important group include fluorescencemicroscopy (Platt <strong>and</strong> Li 1986 <strong>and</strong> references therein)<strong>and</strong> flow cytometry (e.g. Simon et al 1994) as well as <strong>molecular</strong><strong>methods</strong>. The decision on which method to use will ultimatelydepend on the purpose of the monitoring programme<strong>and</strong> the facilities <strong>and</strong> resource available. In<strong>for</strong>mation aboutsampling strategies are found in Franks <strong>and</strong> Keafer (2004).Although the sampling <strong>methods</strong> are outside the scope of thismanual an overview of the steps from sampling to presentationof results to end users is presented in Fig. 1. Examplesof sampling devices are found in Figs. 2-7. In addition tothese automated sampling systems on Ships of Opportunity(SOOP, e.g. FerryBox systems), buoys, Autonomous UnderwaterVehicles (AUV’s) etc. are used (Babin et al. 2008).5
IOC Manuals & Guides no 55Chapter 1 Introduction to <strong>methods</strong> <strong>for</strong> <strong>quantitative</strong> <strong>phytoplankton</strong> analysisQuantitativesamplingWater bottles( discrete depths )Tube( integrating )Automatedsampling devicesPreservationLugol ’ s iodineacidneutralalkalineAldehydesSaline ethanolFreezing ofraw sample( None )StorageKeep in dark <strong>and</strong> refrigerate . Analyse as quickly as possibleConcentrationSedimentationFilteringCentrifugation( None )Homogenisation <strong>and</strong> DNAextraction <strong>for</strong> some<strong>molecular</strong> techniquesSonicationIdentificationof organisms<strong>and</strong> estimation ofcell concentrations<strong>and</strong> biomassMicroscopyMolecular biologicaltechniquesFlow cytometersResultsNumber of organisms or biomass per litre<strong>and</strong> species composition ( biodiversity )Quality controlOften made by analyst when entering data intoelectronic database . Double checked by someone elseRing tests with other laboratories , test <strong>for</strong> repeatability ,estimation of variability due to method or personsper<strong>for</strong>ming analysis , documentation of <strong>methods</strong>> accredited analysis <strong>and</strong> laboratoryInterpretation of resultsComparison with existing data, statistical analysis ,inclusion of other data, e.g . oceanographic data<strong>and</strong> data on algal toxins in shellfishEnd usersWeb site <strong>and</strong>other mediaPrinted reportScientificpublicationFigure 1. Schematic drawing of the steps from sampling to results.6
<strong>Microscopic</strong> <strong>and</strong> Molecular Methods <strong>for</strong> Quantitative Phytoplankton AnalysisChapter 1 Introduction to <strong>methods</strong> <strong>for</strong> <strong>quantitative</strong> <strong>phytoplankton</strong> analysisTable 1. Examples of web sites that provide useful in<strong>for</strong>mation <strong>for</strong> <strong>phytoplankton</strong> analysts.Species in<strong>for</strong>mationAlgaeBaseWorld Register of Marine Species, WoRMSIOC-UNESCO Taxonomic Reference List of HarmfulMicro AlgaeEuropean Register of Marine Species, ERMSIntegrated Taxonomic In<strong>for</strong>mation System, ITISMicro*scopePlankton*netEncyclopedia of LifeURLwww.algaebase.orgwww.marinespecies.orgwww.marinespecies.org/hab/index.phpwww.marbef.orgwww.itis.govstarcentral.mbl.edu/microscope/www.planktonnet.euwww.eol.orgGene sequences etc.GenbankEuropean Molecular Biological LaboratoryNational Center <strong>for</strong> Biotechnology In<strong>for</strong>mationwww.ncbi.nlm.nih.gov/Genbank/www.embl.orgwww.ncbi.nlm.nih.govMicroscopy based techniquesThe historical development of microscope based<strong>phytoplankton</strong> analysis techniquesMany historic reports exist of <strong>phytoplankton</strong> blooms. Somebelieve the description of the Nile water changing to blood inthe bible <strong>and</strong> resultant fish mortalities (Exodus 7:14-25) is anaccount of the occurrence of a HAB. The invention of the microscopeby Anton van Leeuwenhoek (1632-1723) in the 17 thcentury allowed more detailed observations of <strong>phytoplankton</strong>to be made with Christian Gottfried Ehrenberg (1795-1876)<strong>and</strong> Ernst Heinrich Philipp August Haeckel (1834-1919) becomingpioneers in observations of microalgae. Over the last150 years a number of techniques <strong>for</strong> analysis of <strong>phytoplankton</strong>have been developed <strong>and</strong> adopted in analytical laboratoriesthroughout the world. The Swedish chemist, Per TeodorCleve (1840-1905), was one of the first researchers to undertakemore <strong>quantitative</strong> surveys of the <strong>phytoplankton</strong> community.He used silk plankton nets to investigate the distributionof <strong>phytoplankton</strong> in the North Sea Skagerrak-Kattegat area(1897). Hans Lohmann (1863-1934) first used a centrifugeto concentrate plankton <strong>and</strong> discovered the nanoplankton(<strong>phytoplankton</strong> 2 – 20 µm in size) (Lohmann 1911). Theclassic sedimentation chamber technique still used in manylaboratories today was developed by Utermöhl (1931, 1958).In the 1970s the fluorescence microscope was first used <strong>for</strong><strong>quantitative</strong> analysis of bacteria in seawater (e.g. Hobbie et al.1977). A similar technique was used to reveal the ubiquitousdistribution of autotrophic picoplankton (size 0.2 – 2 µm) inthe sea (Johnson <strong>and</strong> Sieburth 1979, Waterbury et al. 1979).In the 1980s auto- <strong>and</strong> heterotrophic nanoplankton were investigatedusing various stains <strong>and</strong> filtration techniques (e.g.Caron 1983).Training <strong>and</strong> literature <strong>for</strong> identification of <strong>phytoplankton</strong>using microscopesMicroscope based <strong>methods</strong> involve the identification of <strong>phytoplankton</strong>species based on morphological <strong>and</strong> other visiblecriteria. Phytoplankton taxonomists should have a high degreeof skill <strong>and</strong> experience in the identification of the speciespresent in their waters <strong>and</strong> appropriate training shouldbe incorporated into their work programme. Access to keyliterature <strong>for</strong> <strong>phytoplankton</strong> identification, such as Horner(2002), Tomas (1997) <strong>and</strong> Throndsen et al. (2003, 2007) isessential. Access to older scientific literature is often necessary<strong>for</strong> detailed species descriptions, however, these may be difficultto access. Attendance at <strong>phytoplankton</strong> identificationtraining courses when possible is the most successful way toallow analysts to continue to learn <strong>and</strong> develop their skills.This is especially important since the systematics <strong>and</strong> nomenclatureof <strong>phytoplankton</strong> is constantly under revision. Specieslists <strong>and</strong> images of <strong>phytoplankton</strong> are presented in a varietyof web sites, see examples listed in Table 1. While a wealth ofin<strong>for</strong>mation is available on the internet, they cannot replaceteaching <strong>and</strong> guidance from an experienced taxonomist.Microscopes <strong>for</strong> <strong>phytoplankton</strong> identification <strong>and</strong>enumerationA high quality microscope is essential <strong>for</strong> the enumeration<strong>and</strong> identification of <strong>phytoplankton</strong> species. Although theinitial cost will be high, a microscope, if serviced on a regularbasis, can remain in use <strong>for</strong> many years. Two types of microscopesare commonly used: (1) the st<strong>and</strong>ard compound(upright) microscope <strong>and</strong> (2) the inverted microscope (Figs.8 - 9). With the inverted microscope, the objectives are positionedunderneath the stage holding the sample. This is necessary<strong>for</strong> examination of samples in sedimentation chambers<strong>and</strong> flasks where the <strong>phytoplankton</strong> cells have settled onto thebottom. Oculars should be fitted with a graticule <strong>and</strong> a stagemicrometer is used to determine <strong>and</strong> calibrate the length ofthe scale bars of the eyepiece graticule under each objectivemagnification. In Fig. 10 examples of how Alex<strong>and</strong>rium fundyenseis viewed in the microscope using different micrsocope<strong>and</strong> staining techniques are presented. The digital photographswere taken during a workshop comparing micrsocopica <strong>and</strong> <strong>molecular</strong> biological techniques <strong>for</strong> quantiative <strong>phytoplankton</strong>analysis. Results from the workshop are found inGodhe et al. (2007).Because many <strong>phytoplankton</strong> species are partially transparentwhen viewed under a light microscope, different tech-7
IOC Manuals & Guides no 55Chapter 1 Introduction to <strong>methods</strong> <strong>for</strong> <strong>quantitative</strong> <strong>phytoplankton</strong> analysisFigure 2. Reversing water sampler of the modified Nansen type.Figure 5. Phytoplankton net. This is not used <strong>for</strong> <strong>quantitative</strong> samplingbut <strong>for</strong> collecting rare, non fragile species.Figure 3. Water sampler of the Ruttner type.Figure 6. Tube <strong>for</strong> integrated water sampling.Figure 4. CTD with rosette <strong>and</strong> Niskin-type water bottles. An in situchlorophyll a fluorometer is also mounted.Figure 7. The Continuous Plankton Recorder. This device is mainlyaimed <strong>for</strong> sampling zooplankton but may be useful <strong>for</strong> collectinglarger, non fragile <strong>phytoplankton</strong> species. Photo courtesy of the SirAlister Hardy Foundation <strong>for</strong> Ocean Science, SAHFOShttp://www.sahfos.ac.uk/.8
<strong>Microscopic</strong> <strong>and</strong> Molecular Methods <strong>for</strong> Quantitative Phytoplankton AnalysisChapter 1 Introduction to <strong>methods</strong> <strong>for</strong> <strong>quantitative</strong> <strong>phytoplankton</strong> analysisniques to improve contrast are used. Differential InterferenceContrast (DIC, also called Normarski) <strong>and</strong> Phase Contrastare popular. DIC is considered by many to be the optimalmethod <strong>for</strong> general <strong>phytoplankton</strong> analysis. Most plastic containers,however, cannot be used with this method as manyplastics depolarize the required polarized light. It is also moreexpensive than Phase Contrast <strong>and</strong> requires a different set ofobjectives, polarizing filters etc. to function properly.Natural fluorescenceFluorescence generated from photosynthetic <strong>and</strong> other pigmentsin <strong>phytoplankton</strong> can be used as an aid <strong>for</strong> the identification<strong>and</strong> enumeration of species. This works best with livesamples <strong>and</strong> samples preserved with <strong>for</strong>maldehyde or glutaraldehyde.If Lugols iodine is used <strong>for</strong> preservation, the naturalfluorescence is not visble. Fluorescence can also be used to differentiatebetween heterotrophic <strong>and</strong> autotrophic organisms.The microscope must be equipped with objectives suitable <strong>for</strong>fluorescence, a lamp housing <strong>for</strong> fluorescence (e.g. mercurylamp 50 or 100 W), the required filter sets. A useful filter setto observe fluorescence from both chlorophyll a <strong>and</strong> phycoerythrinconsists of a filter <strong>for</strong> excitation at 450-490 nm <strong>and</strong> along pass filter <strong>for</strong> emission at 515 nm.Staining of cellsDifferent stains are used to aid the identification of <strong>phytoplankton</strong>species. In this volume only fluorescent stains (fluorochromes)are discussed. The stain used in chapters 2 <strong>and</strong> 5,calcofluor, binds to the cellulose theca in armoured dinoflagellates<strong>and</strong> allows a detailed examination of the plate structureto be per<strong>for</strong>med. This stain is very useful when morphologicallysimilar species, e.g. Alex<strong>and</strong>rium spp., are present. Fluorochromesare also often used in connection with antibodiesor RNA targeted probes to identify <strong>phytoplankton</strong>. Some ofthese are covered in chapter 9. It should be noted that somemicroscope objective lenses do not transmit ultraviolet light<strong>and</strong> are unsuitable <strong>for</strong> work with fluorochromes that requireUV-light excitation, e.g. calcofluor.Image analysisManual <strong>phytoplankton</strong> analysis with microscopy may be timeconsuming <strong>and</strong> analysts must possess the necessary skills toallow the identification of cells using morphological features.This has led to interest in the use of automated image analysisof <strong>phytoplankton</strong> samples. Basic image analysis <strong>methods</strong> donot generally discriminate between <strong>phytoplankton</strong> <strong>and</strong> othermaterial such as detritus <strong>and</strong> sediment in samples therebypresenting a problem in the application to routine field samples.This technique may be more useful <strong>for</strong> the analysis ofcultures <strong>and</strong> monospecific high density blooms. Researchershave tried more advanced <strong>methods</strong> such as artificial neuralnetworks (ANN) to identify species automatically by patternrecognition. Some ANN software includes functions whichtrain the ANN to identify certain species. One such instrumentunder development is the HAB Buoy, which uses theDinoflagellate Categorisation by Artificial Neural Network(DICANN) recognition system software (Culverhouse et al.2006). Other examples of software currently under evaluation<strong>for</strong> automated <strong>phytoplankton</strong> identification are used in FlowCytometers (see next paragraph), e.g. the FlowCAM (chapter8) <strong>and</strong> the method described by Sosik <strong>and</strong> Olson (2007). Todate, these <strong>methods</strong> require a highly trained <strong>phytoplankton</strong>identification specialist to train the software to recognise theimages <strong>and</strong> carry out a quality control on the results of theautomated image analysis.Flow cytometryA flow cytometer is a type of particle counter initially developed<strong>for</strong> use in medical science. Today instruments have beendeveloped <strong>for</strong> use specifically in aquatic sciences. Autofluorescence<strong>and</strong> scattering properties are used to discriminate differenttypes of <strong>phytoplankton</strong>. The different <strong>phytoplankton</strong>groups are in general not well distinguished taxonomicallywhen a st<strong>and</strong>ard instrument is used. A st<strong>and</strong>ard flow cytometeris very useful to estimate abundance of e.g. autotrophicpicoplankton. A more advanced type of flow cytometer has acamera that produces images of each particle/organism. Automatedimage analysis makes it possible to identify organisms.Manual inspection of images by an experienced <strong>phytoplankton</strong>identification specialist is required <strong>for</strong> quality control <strong>and</strong><strong>for</strong> training the automated image analysis system. A desk topsystem is described in chapter 8. An example of an in situsystem is described by Sosik <strong>and</strong> Olsen (2007) <strong>and</strong> Olsen <strong>and</strong>Sosik (2007).Molecular techniquesSignificance of <strong>molecular</strong> based <strong>phytoplankton</strong> analysistechniquesOwing to some of the difficulties <strong>and</strong> limitations of morphologicalidentification techniques, microalgal studies areincreasingly exploring the use of <strong>molecular</strong> <strong>methods</strong>. Most<strong>molecular</strong> techniques have their origin in the medical science,<strong>and</strong> during the last three decades these various techniqueshave been tested, modified, <strong>and</strong> refined <strong>for</strong> the use in algalidentification, detection <strong>and</strong> quantification.The development of <strong>molecular</strong> tools <strong>for</strong> the identification <strong>and</strong>detection of microalgae has influenced <strong>and</strong> improved otherfields of phycological research. Molecular data are gaining influencewhen the systematic position of an organism is established.Today, the description of new species, erection of newgenera, or rearrangement of a species to a different genus isusually supported by <strong>molecular</strong> data in addition to morphologicalstructures, ultrastructure, <strong>and</strong> in<strong>for</strong>mation on biogeographicdistribution (e.g. Fraga et al. 2008). Thus, the underst<strong>and</strong>ingof evolutionary relationships among microalgaltaxa has been immensely improved (Saldarriaga et al. 2001).Spatially separated populations of microalgal species mightdisplay different properties, such as toxin production. Bystudying minor differences within the genome, populationscan be confined to certain locations, <strong>and</strong> human assisted <strong>and</strong>/or natural migration of populations can be investigated (e.g.Persich et al. 2006, Nagai et al. 2007). Also, the increasingin<strong>for</strong>mation on the structure of genes <strong>and</strong> new tools <strong>for</strong> investigatingtheir expressions, have enhanced our underst<strong>and</strong>ingof algal physiological processes (Maheswari et al. 2009).Laboratory requirements <strong>for</strong> <strong>molecular</strong> techniquesDifferent types of <strong>molecular</strong> techniques have very differentrequirements <strong>for</strong> laboratory facilities <strong>and</strong> instruments. Therange is from very well equipped laboratories to field instruments.In chapters 9-14 examples of laboratory <strong>methods</strong> are9
IOC Manuals & Guides no 55Chapter 1 Introduction to <strong>methods</strong> <strong>for</strong> <strong>quantitative</strong> <strong>phytoplankton</strong> analysisFigure 8 Compound microscopefound. In situ systems are under development (e.g. Paul et al.2007 <strong>and</strong> Scholin et al. 2009).Identification <strong>and</strong> quantification of <strong>phytoplankton</strong> speciesby <strong>molecular</strong> <strong>methods</strong>Molecular methodologies aim to move away from speciesidentification <strong>and</strong> classification using morphological characteristicsthat often require highly specialist equipment such aselectron microscopes, or very skilled techniques such as singlecell dissections. Instead <strong>molecular</strong> techniques exploit differencesbetween species at a genetic level. Molecular analysisrequires the use of specialised equipment <strong>and</strong> personnel <strong>and</strong>most importantly requires a previous knowledge of the geneticdiversity of the <strong>phytoplankton</strong> in a specific region. To date,<strong>molecular</strong> <strong>methods</strong> have been used to support HAB monitoringprogrammes in New Zeal<strong>and</strong> <strong>and</strong> the USA (Rhodes et al.1998, Scholin et al. 2000, Bowers et al. 2006).In this present manual, <strong>methods</strong> based on ribosomal RNA(rRNA) <strong>and</strong> DNA (rDNA) targeted oligonucleotides <strong>and</strong>polymerase chain reaction (PCR) are described. Oligonucleotides<strong>and</strong> PCR primers are short strains of synthetic RNA orDNA that is complementary to the target RNA/DNA. Molecularsequencing of <strong>phytoplankton</strong> cells has generated DNAsequence in<strong>for</strong>mation from many species around the world.This has allowed the design of oligonucleotide probes <strong>and</strong>PCR primers <strong>for</strong> specific microalgal species. Some oligonucleotideprobes, which hybridize with complementary targetrRNA or rDNA, have a fluorescent tag attached <strong>and</strong> can actas a direct detection method using fluorescence microscopy.PCR primers enable the amplification of target genes throughPCR. The primers serve as start <strong>and</strong> end points <strong>for</strong> in vitroDNA synthesis, which is catalysed by a DNA polymerase.The PCR consists of repetitive cycles, where in the first step,DNA is heated in order to separate the two str<strong>and</strong>s in theDNA helix. In the second step during cooling, the primers,which are present in large excess, are allowed to hybridize withthe complementary DNA. In a third step, the DNA polymerase<strong>and</strong> the four deoxyribonucleoside triphosphates (dNTPs)complete extension of a complementary DNA str<strong>and</strong> downstreamfrom the primer site. For effective DNA amplification,the three steps are repeated in 20-35 cycles (Alberts etal. 1989). A useful volume covering the basics of <strong>molecular</strong><strong>methods</strong> <strong>and</strong> general applications is Molecular Systematicsedited by Hillis et al. (1996).Figure 9. Inverted microscopeMost of the <strong>molecular</strong> <strong>methods</strong> described here, with the exceptionof the whole cell assay (chapter 9 <strong>and</strong> 14), do notrequire the cells to remain intact. In these <strong>methods</strong> the rRNAmolecules in the cell’s cytoplasm or the nuclear DNA are releasedduring nucleic acid extraction <strong>and</strong> are targeted by theprobes or PCR primers. During the whole cell assay, the targetrRNA/rDNA within intact cells is labelled with fluorescentlytagged probes. It is there<strong>for</strong>e vital that the laboratory protocolused ensures that the probes can penetrate the cell wall inorder to access target genetic region <strong>and</strong> label them. TyramideSignal Amplification has been used with FISH (TSA-FISH)to further enhance fluorescence signals (see chapter 14). Thefluorescent tag can then be read using a fluorescent microscopeas with the whole cell assays (FISH chapter 9) or additionaltechnology is employed to allow these fluorescent tagsto be read automatically e.g. using a s<strong>and</strong>wich hybridizationtechnique (chapter 12) <strong>and</strong> PCR (chapter 13).The h<strong>and</strong> held device <strong>and</strong> DNA-biosensor with disposablesensorchip (s<strong>and</strong>wich hybridisation, electrochemical detection)<strong>and</strong> DNA microarray technology (fluorescent detection)<strong>methods</strong> discussed in this manual are still at the finaldevelopment stages (see chapters 10 <strong>and</strong> 11). Within thenext decade these <strong>methods</strong> may be ready to be incorporatedinto monitoring programmes. The authors suggest that futureadvances in this field will include microarray/DNA chip(sometimes called “phylochips”) technologies with probes <strong>for</strong>multiple species applied in situ to an environmental samplesimultaneously.Alternative <strong>molecular</strong> based <strong>methods</strong> such as lectin (protein<strong>and</strong> sugar) binding <strong>and</strong> antibody based assays (e.g. immunofluorescenceassays) are not included in this manual. In<strong>for</strong>mationon these <strong>molecular</strong> diagnostic tools may be foundin chapter 5 of The Manual on Harmful Marine Microalgae(Hallegraeff et al. 2004).Molecular method validationrDNA <strong>and</strong> rRNA have become the most popular target regions<strong>for</strong> microalgal species identification. These regions areattractive <strong>for</strong> primer <strong>and</strong> probe design because they containboth conserved <strong>and</strong> variable regions <strong>and</strong> are ubiquitous in10
<strong>Microscopic</strong> <strong>and</strong> Molecular Methods <strong>for</strong> Quantitative Phytoplankton AnalysisChapter 1 Introduction to <strong>methods</strong> <strong>for</strong> <strong>quantitative</strong> <strong>phytoplankton</strong> analysisABCD E FFigure 10. Alex<strong>and</strong>rium fundyense as seen in the microscope using different techniques. Ceratium spp. are present in B, C <strong>and</strong> D. A. Filterfreeze transfer with contrast enhancement using DIC (appearance in Utermöhl is essentially identical), B. Sedimentation flask, C. Filtering+ calcofluor staining, D. Filtering using semitransparent filters, E.<strong>and</strong> F. Whole cell hybridization assay.Sample preparation: A. Allan Cembella, B. Georgina McDermott, C. Per Andersen, D. Einar Dahl, E. Melissa Gladstone <strong>and</strong> F. David Kulis.F is originally a greyscale image to which artificial colour has been added to simulate what the eye sees. Photo A-E Bengt Karlson <strong>and</strong> FDavid Kulis. Microscope. A-E Zeiss Axiovert 200 <strong>and</strong> F Zeiss Axioplan 40 Fl.all organisms. In addition, a large number of sequences areavailable in <strong>molecular</strong> web based databases, e.g. GENBANK,<strong>for</strong> sequence comparative analyses (Table 1) <strong>and</strong> design ofoligonucleotide probes <strong>and</strong> PCR primers. Despite extensivesequence analysis of cultured <strong>phytoplankton</strong> species, crossreactivity with other organisms in the wild may occur, it isthere<strong>for</strong>e crucial to test the developed probes/primers withthe target species <strong>and</strong> several non-target species. Methoddevelopment, although time consuming, is essential if these<strong>methods</strong> are to be implemented. It is the responsibility of theend user to ensure that specificity to the target organism isevaluated appropriately.Quality controlAs with all scientific research, it is necessary to investigate thevariability of the <strong>methods</strong> used be<strong>for</strong>e employment into anymonitoring programme. The variability of the result can beaffected by cell abundance which can dictate the method ofchoice. Further in<strong>for</strong>mation on this can be found in chapter2 <strong>and</strong> of Venrick (1978 a,b,c) <strong>and</strong> Andersen <strong>and</strong> Throndsen(2004). Many laboratories have achieved national accreditation<strong>for</strong> techniques described in this manual. This involvesdeveloping protocols with levels of traceability <strong>and</strong> reproducibilityin line with defined criteria. Participation in internationallyrecognised inter-laboratory comparisons are stronglyrecommended.ReferencesAlberts B, Bray D, Lewis J, Raff M, Roberts K, Watson JD (1989)Molecular biology of the cell. Garl<strong>and</strong> Publishing, Inc, New York,1219 p.Andersen P, Throndsen J (2004) Estimating cell numbers. In: HallegraeffGM, Anderson DM, Cembella AD (eds) Manual on HarmfulMarine Microalgae. UNESCO, Paris, pp. 99-129.Babin M, Roesler C, Cullen JJ (eds) (2008) Real-time coastal observingsystems <strong>for</strong> marine ecosystem dynamics <strong>and</strong> harmful algalblooms: theory, instrumentation <strong>and</strong> modelling, UNESCOmonographs on oceanographic methodology UNESCO Publishing,860 p.Bowers HA, Trice MT, Magnien RE, Goshorn DM, Michael B,Schaefer EF, Rublee PA, Oldach DW (2006) Detection of Pfiesteriaspp. by PCR in surface sediments collected from ChesapeakeBay tributaries (Maryl<strong>and</strong>) Harmful Algae 5(4): 342-351Caron DA (1983) Technique <strong>for</strong> enumeration of heterotrophic <strong>and</strong>phototrophic nanoplankton, using epifluorescence microscopy,<strong>and</strong> comparison with other procedures. Appl. Environ. Microbiol.46, 491-498.Culverhouse PF, Williams R, Simpson B, Gallienne C, Reguera B,Cabrini M, Fonda-Umani S, Parisini T, Pellegrino FA, Pazos Y,Wang H, Escalera L, Moroño A, Hensey M, Silke J, Pellegrini A,Thomas D, James D, Longa MA, Kennedy S, del Punta G (2006)HAB Buoy: a new instrument <strong>for</strong> in situ monitoring <strong>and</strong> earlywarning of harmful algal bloom events African Journal of MarineScience 28(2): 245–250Field CB, Behrenfeld MJ, R<strong>and</strong>erson JT, Falkowski PG (1998) Primaryproduction of the biosphere: Integrating terrestrial <strong>and</strong> oceaniccomponents. Science 281, 237–240.Fraga S, Penna A, Bianconi I, Paz B, Zapata M (2008) Coolia canariensissp nov (Dinophyceae), a new nontoxic epiphytic benthicdinoflagellate from the Canary Isl<strong>and</strong>s. Journal of Phycology 44:1060-1070Franks PJS, Keafer BA (2004) Sampling techniques <strong>and</strong> strategies<strong>for</strong> coastal <strong>phytoplankton</strong> blooms. In: Hallegraeff, G.M., Anderson,D.M., Cembella, A.D. (eds), Manual on Harmful MarineMicroalgae. UNESCO, Paris, pp. 51 - 76.Godhe A, Cusack C, Pedersen J, Andersen P, Anderson DM, BresnanE, Cembella A, Dahl E, Diercks S, Elbrächter M, Edler L, GalluzziL, Gescher C, Gladstone M, Karlson B, Kulis D, LeGresleyM, Lindahl O, Marin R, McDermott G, Medlin LK, NaustvollL-K, Penna A, Töbe K (2007) Intercalibration of classical <strong>and</strong> <strong>molecular</strong>techniques <strong>for</strong> identification of Alex<strong>and</strong>rium fundyense (Dinophyceae)<strong>and</strong> estimation of cell densities. Harmful Algae: 56-7211
IOC Manuals & Guides no 55Chapter 1 Introduction to <strong>methods</strong> <strong>for</strong> <strong>quantitative</strong> <strong>phytoplankton</strong> analysisHallegraeff GM, Anderson DM, Cembella AD (1995) Manual onHarmful Marine Microalgae. UNESCO, Paris, 551 pp.Hallegraeff GM, Anderson DM, Cembella AD (2004) Manual onHarmful Marine Microalgae. UNESCO, Paris, 793 pp.Hillis D, Moritz C, Mable B (eds) (1996) Molecular systematics,,Sinauer Associates, Sunderl<strong>and</strong>, 655 pp.Hobbie JE, Daley RJ, Jasper S (1977) Use of Nuclepore filters <strong>for</strong>counting bacteria by fluorescence microscopy. Appl. Environ.Microbiol. 33: 1225-1228.Horner RA (2002) A Taxonomic Guide to Some Common MarinePhytoplankton, Bristol, UK, 195 pp.Johnson PW, Sieburth JM (1979) Chroococcoid cyanobacteria inthe sea: A ubiquitous <strong>and</strong> diverse phototrophic biomass. Limnol.Oceanogr. 24: 928-935.Lohmann H (1911) Über das nannoplankton und die Zentrifugierungkleinster Wasserproben zur Gewinnung desselben in lebendemZust<strong>and</strong>e. Int. Revue ges. Hydrobiol. 4: 1-38.Maheswari U, Mock T, Armbrust EV, Bowler C (2009) Update ofthe Diatom EST Database: a new tool <strong>for</strong> digital transcriptomics.Nucleic Acids Research 37: D1001-D1005.Nagai S, Lian C, Yamaguchi S, Hamaguchi M, Matsuyama Y, ItakuraS, Shimada H, Kaga S, Yamauchi H, Sonda Y, NishikawaT, Kim C-H, Hogetsu T (2007) Microsatellite markers revealpopulation genetic structure of the toxic dinoflagellate Alex<strong>and</strong>riumtamarense (Dinophyceae) in Japanese coastal water. Journal ofPhycology 43: 43-54Olson RJ, Sosik HM (2007) A submersible imaging-in-flow instrumentto analyze nano- <strong>and</strong> microplankton: Imaging FlowCytobot.Limnol. Oceanogr. Methods, 5: 195-208.Paul J, Scholin C, van den Engh G, Perry MJ (2007) A sea of microbes.In situ instrumentation. Oceanogr. 2(2): 70-78.Persich G, Kulis D, Lilly E, Anderson D, Garcia V (2006) Probableorigin <strong>and</strong> toxin profile of Alex<strong>and</strong>rium tamarense (Lebour) Balechfrom southern Brazil. Hamful Algae 5: 36-44Platt T, Li WKW (1986) Photosynthetic picoplankton. Minister ofSupply <strong>and</strong> Services, Canada, Ottawa, 583 pp.Rhodes L, Scholin C, Garthwaite I (1998) Pseudo-nitzschia in NewZeal<strong>and</strong> <strong>and</strong> the role of DNA probes <strong>and</strong> immunoassays in refiningmarine biotoxin monitoring programmes. Natural Toxins6:105-111.Saldarriaga JF, Taylor FJR, Keeling PJ, Cavalier-Smith T (2001)Dinoflagellate nuclear SSU rRNA phylogeny suggests multipleplastid losses <strong>and</strong> replacements. Journal of Molecular Evolution53Scholin CA, Gull<strong>and</strong> F, Doucette GJ, Benson S, Busman M, ChavezFP, Cordaro J, DeLong R, De Vogelaere A, Harvey J, Haulena M,Lefebvre K, Lipscomb T, Loscutoff S, Lowenstine LJ, Martin RI, Miller PE, McLellan WA, Moeller PDR, Powell CL, Rowles T,Silvagnl P, Silver M, Spraker T, Van Dolah FM (2000) Mortalityof sea lions along the central coast linked to a toxic diatom bloom.Nature 403: 80-84.Scholin C, Doucette G, Jensen S, Roman B, Pargett D, Marin II R,Preston C, Jones W, Feldman J, Everlove C, Harris A, AlvaradoN, Massion E, Birch J, Greenfield D, Vrijenhoek R, Mikulski C,Jones K (2009) Remote detection of marine microbes, small invertebrates,harmful algae, <strong>and</strong> biotoxins using the EnvironmentalSample Processor (ESP). Oceanography 22: 158-167.Simon N, Barlow RG, Marie D, Partensky F, Vaulot D (1994) Characterizationof oceanic photosynthetic picoeukaryotes by flow cytometry,J. Phycol. 30: 922-935.Simon N, Cras A-L, Foulon E, Lemée R (2009) Diversity <strong>and</strong> evolutionof marine <strong>phytoplankton</strong>, C. R. Biologies 332: 159-170Sosik HM, Olson RJ (2007) Automated taxonomic classification of<strong>phytoplankton</strong> sampled with image-in-flow cytometry. Limnol.Oceanogr. Methods. 5: 204-216.Sournia A (ed.) 1978. Phytoplankton manual. UNESCO, Paris,337pp.Tomas CR (ed.) 1997, Identifying Marine Phytoplankton, Academic,Press, San Diego, 858 pp.Throndsen J, Hasle GR, Tangen K (2003) Norsk kystplanktonflora.Almater <strong>for</strong>lag AS, Oslo, 341 pp. (in Norwegian).Throndsen J, Hasle GR, Tangen K (2007) Phytoplankton of Norwegiancoastal waters, Almater <strong>for</strong>lag AS, Oslo, 343 pp.Utermöhl H (1931) Neue Wege in der <strong>quantitative</strong>n Erfassung desPlanktons (mit besonderer Berücksichtigung des Ultraplanktons).Verh. int. Ver. theor. angew. Limnol. 5: 567-596.Utermöhl H (1958) Zur Vervollkomnung der <strong>quantitative</strong>n Phytoplankton-Methodik.Mitt. int. Ver. ther. angew. Limnol. 9: 1-38.Waterbury JB, Watson SW, Guillard RRL, Br<strong>and</strong> LE (1979) Widespreadoccurrence of a unicellular, marine, planktonic, cyanobacterium.Nature 227: 293-294.Venrick EL (1978a) How many cells to count? In: Sournia, A. (ed),Phytoplankton manual. UNESCO, Paris, pp. 167-180.Venrick EL (1978b) The implications of subsampling. In: Sournia A(ed) Phytoplankton manual. Unesco, Paris, pp. 75-87.Venrick E, (1978c) Sampling design. In: Sournia, A. (Ed.),Phytoplankton manual. Unesco, Paris, pp. 7-16.12
<strong>Microscopic</strong> <strong>and</strong> Molecular Methods <strong>for</strong> Quantitative Phytoplankton AnalysisChapter 2 The Utermöhl method2 The Utermöhl method <strong>for</strong> <strong>quantitative</strong> <strong>phytoplankton</strong> analysisLars Edler* 1 <strong>and</strong> Malte Elbrächter 21WEAQ, Doktorsgatan 9 D., SE-262 52 Ängelholm, Sweden2Deutsches Zentrum für Marine Diversitäts<strong>for</strong>-schung Forschungsinstitut Senckenberg, Wattenmeerstation Sylt, Hafenstr. 43, D-25992List/Sylt, Germany*Author <strong>for</strong> correspondence: e-mail lars.edler@telia.comIntroductionThe Utermöhl method (Utermöhl 1931, 1958) has an advantageover other <strong>methods</strong> of <strong>phytoplankton</strong> analysis in thatalgal cells can be both identified <strong>and</strong> enumerated. Using thismethod, it is also possible to determine individual cell size,<strong>for</strong>m, biovolume <strong>and</strong> resting stage.The Utermöhl method is based on the assumption that cellsare poisson distributed in the counting chamber. The methodis based on the sedimentation of an aliquot of a water samplein a chamber. Gravity causes the <strong>phytoplankton</strong> cells to settleon the bottom of the chamber. The settled <strong>phytoplankton</strong>cells can then be identified <strong>and</strong> enumerated using an invertedmicroscope. To quantify the result as cells per Litre a conversionfactor must be determined.MaterialsEquipmentSample BottlesIf samples are analysed immediately or within a few daysplastic vials may be used. Note that the preservatives may beabsorbed by the plastic. For long term storage, glass samplebottles should be used to minimise any chemical reactionwith the preservative. Clear glass bottles allow the state ofLugol’s iodine preservation to be easily monitored (Fig. 1).These samples must be stored in the dark to prevent the degradationof Lugol’s iodine in light. It is important that thebottle cap is securely tightened to avoid spillage of the sample<strong>and</strong> evaporation of the preservative. Utermöhl (1958) recommendedthat the bottle is filled to 75-80% of its volume. Thisfacilitates the homogenisation of the sample be<strong>for</strong>e dispensinginto the sedimentation chamber.Preservation agentsPreservation agents must be chosen depending on the objectiveof the study. The most commonly used is potassium iodine;Lugol’s iodine solution – acidic, neutral or alkaline (Table1; Andersen <strong>and</strong> Throndsen 2004). If samples are stored <strong>for</strong>long periods they may be preserved with neutral <strong>for</strong>maldehyde(Table 2).Table 2. Recipe <strong>for</strong> neutral <strong>for</strong>maldehyde. (from: Throndsen 1978,Edler 1979, Andersen <strong>and</strong> Throndsen 2004). Filter after one weekto remove any precipitates.Neutral <strong>for</strong>maldehyde500 mL 40% <strong>for</strong>maldehyde500 mL distilled water100 g hexamethylentetramidpH 7.3 – 7.9Sedimentation chambersThe sedimentation chamber consists of two parts, an uppercylinder (chimney) <strong>and</strong> a bottom plate with a thin glass (Fig.2). They are usually made of perspex in volumes of 2, 5, 10,25 or 50 mL. The thickness of the glass base plate should notexceed 0.2 mm, as this will affect the resolution achievableby the microscope. Counting chambers should be calibrated.This is achieved by first weighing the chamber while empty<strong>and</strong> then filled with water to confirm the volume.The inverted microscopeFor <strong>quantitative</strong> analysis using sedimentation chambers, aninverted microscope is required (Fig. 3). The optical quality ofthe microscope is crucial <strong>for</strong> facilitating <strong>phytoplankton</strong> identification.Phase- <strong>and</strong>/or differential interference-contrast ishelpful <strong>for</strong> the identification of most <strong>phytoplankton</strong>, whereasbright-field may be advantageous <strong>for</strong> coccolithophorids (Heimdahl1978).Epifluorescence equipment is a great advantage <strong>for</strong> counting<strong>and</strong> identification of organisms with cellulose cell walls, e.g.,thecate dinoflagellates, chlorophytes <strong>and</strong> “fungi”. A stain isapplied to the sample which causes cellulose to fluoresce.One eyepiece should be equipped with a calibrated ocularmicrometer. The other eyepiece should be equipped withtwo parallel threads <strong>for</strong>ming a transect. A third thread perpendicularto the other two facilitates the counting procedure(Fig. 4 a). It is also possible to have the eyepiece equippedwith other graticules such as a square field or grids (Fig. 4b). The eyepiece micrometer <strong>and</strong> counting graticule must becalibrated <strong>for</strong> each magnification using a stage micrometer.Table 1. Recipes <strong>for</strong> Lugol’s iodine solution (acidic, alkaline <strong>and</strong> neutral).(from: Utermöhl 1958, Willén 1962, Andersen <strong>and</strong> Throndsen, 2004).Acidic Alkaline Neutral20 g potassium iodide (KI) 20 g potassium iodide (KI) 20 g potassium iodide (KI)10 g iodine (I 2) 10 g iodine (I 2) 10 g iodine (I 2)20 g conc. acetic acid 50 g sodium acetate 200 mL distilled water200 mL distilled water 200 mL distilled water13
IOC Manuals & Guides no 55Chapter 2 The Utermöhl methodThe fundamentals ofThe Utermöhl methodScopeQualitative <strong>and</strong> <strong>quantitative</strong> analysis of <strong>phytoplankton</strong>.Detection rangeDetection range is dependent on the volume of sample settled.Counting all of the cells in a 50 mL chamber will give a detectionlimit of 20 cells per Litre.AdvantagesQualitative as well as <strong>quantitative</strong> analysis. Identification <strong>and</strong>quantification of muliple or single species. Detection of harmfulspecies.DrawbacksThis is a time consuming analysis that requires skilled personnel.Sedimentation time prevents the immediate analysis ofsamples. Autotrophic picoplankton is not analysed using theUtermöhl method.Type of training neededAnalysis requires continuous training over years with in-depthknowledge of taxonomic literature.Essential EquipmentInverted microscope, sedimentation chambers, microscopecamera, identification literature, (epifluorescense equipment,counting programme).Equipment cost*Inverted microscope: 7,500 – 50,000 € (11,000 – 70,000 US $).Sedimentation chamber: 150 € (200 US$).Microscope camera: 3,000 – 8,000 € (4,300 – 11,000 US $).Identification literature: 1,000 – 3,000 € (1,400 – 4,300 US $).Epifluorescense equipment: 10,000 € (14,000 US $).Counting programme: 500 – 5,000 € (700 – 7,000 US $).Consumables, cost per sample**Less than 5 €/4 US $.Processing time per sample be<strong>for</strong>e analysisApp. 10 minutres <strong>for</strong> filling <strong>and</strong> assembling sedimentationchamber.3-24 hours sedimtation time depending on volume <strong>and</strong> analysistype.Analysis time per sample2-10 hours or more depending on type of sample <strong>and</strong> analysis.Sample throughput per person per day1-4 depending on type of sample <strong>and</strong> analysis.No. of samples processed in parallelOne per analyst.Health <strong>and</strong> Safety issuesAnalysis sitting at the microscope is tiresome <strong>for</strong> eyes, neck <strong>and</strong>shoulder. Frequent breaks are needed. If <strong>for</strong>malin is used as preservationagent appropriate health <strong>and</strong> safety guidelines mustbe followed.*service contracts not included**salaries not included14
<strong>Microscopic</strong> <strong>and</strong> Molecular Methods <strong>for</strong> Quantitative Phytoplankton AnalysisChapter 2 The Utermöhl methodABFigure 4. Counting aids mounted in the eyepiece. a) parallelthreads, with a transverse thread. b) grids.Figure 1. Sample bottles: glass <strong>and</strong> plastic. Bottle of Lugol’s iodinesolution to the right.The microscope should have objectives of 4-6X, 10X, 20X<strong>and</strong> 40-60X. For detailed examination a 100X oil immersionobjective may also be used. If epifluorescence microscopy isto be used, the microscope must be equipped with the appropriateobjective lenses. In order to survey the entire bottomplate the microscope must be equipped with a movable mechanicalstage.Cell countersA cell counter with 12 or more keys is a useful device. Medicalblood cell counters (Fig. 5) are commonly used. If these arenot availabe single tally counters can be used as appropriate. Itis also common to have a computerised counting programme(Fig. 6) beside the microscope, so that the observed species areregistered directly into a database.Figure 2. Sedimentation chambers. From left to right: bottom platewith cover glass, 10 mL chamber, 25 mL chamber <strong>and</strong> 50 mLchamber.Laboratory facilitiesLaboratory facilities necessary <strong>for</strong> the <strong>quantitative</strong> analysisof <strong>phytoplankton</strong> require amenities <strong>for</strong> storing, h<strong>and</strong>ling(mixing <strong>and</strong> pouring samples) <strong>and</strong> washing of sedimentationchambers. Preserved samples should be stored in cool <strong>and</strong>dark conditions. During sedimentation the chambers shouldbe placed on a level, horizontal <strong>and</strong> solid surface. This willprevent any non r<strong>and</strong>om accumulation of <strong>phytoplankton</strong> cells.MethodsPreparation of samplePreservationOnce the sample has been collected from the field <strong>and</strong> pouredinto the sample bottle it should be immediately preservedusing either:Lugol’s iodine solution;0.2 – 0.5 mL per 100 mL water sample.Neutralised <strong>for</strong>maldehyde;2 mL per 100 mL water sample.The advantage of Lugol’s iodine solution is that it has an instanteffect <strong>and</strong> increases the weight of the organisms reducingsedimentation time. Lugol’s iodine solution will causediscolouration of some <strong>phytoplankton</strong> making identificationdifficult. To reduce this effect, the sample can be bleached usingsodium thiosulfate prior to analysis.Figure 3. Inverted microscope.The advantage of <strong>for</strong>maldehyde is that preserved samples remainviable <strong>for</strong> a long time. Formaldehyde is not suitable <strong>for</strong>fixation of naked algal cells, as the cell shape is distorted <strong>and</strong>flagella are lost. Some naked algal <strong>for</strong>ms may also disintegratewhen <strong>for</strong>maldehyde is used (CEN 2005). Formaldehydeshould be used with care because of its toxicity to humans(Andersen <strong>and</strong> Throndsen 2004).15
IOC Manuals & Guides no 55Chapter 2 The Utermöhl methodFigure 5. Laboratory cell counter.Storage of samplesPreserved <strong>phytoplankton</strong> samples should be stored in cool<strong>and</strong> dark conditions. When using Lugol’s iodine solution, thecolour of the sample should be checked regularly <strong>and</strong> if necessary,more preservative added. Preserved samples should beanalysed without delay. Samples stored more than a year areof little use (Helcom Combine 2006).Temperature adaptationThe first step in the analysis procedure is to adapt the<strong>phytoplankton</strong> sample <strong>and</strong> the sedimentation chamber toroom temperature. This prevents convection currents <strong>and</strong> airbubbles <strong>for</strong>ming in the sedimentation chamber. If this is notcarried out non-r<strong>and</strong>om settling of the <strong>phytoplankton</strong> cellsmay occur.Chamber preparationSediment chambers must be clean <strong>and</strong> dust free to avoid contaminationfrom previous samples. Many laboratories use anew base plate after every sample. Sometimes it is necessaryto grease the chimney bottom with a small amount of vaselineto ensure the chamber parts are tightly sealed (Andersen <strong>and</strong>Throndsen 2004).In studies where the succession of the <strong>phytoplankton</strong> is examinedover a period of time it is important to use the samechamber volume <strong>for</strong> the analysis (Hasle 1978a). At times, the“st<strong>and</strong>ard” chamber size may be either too small (extremewinter situations) or too large (<strong>phytoplankton</strong> blooms) <strong>and</strong>another chamber size must be used.Sample homogenisationBe<strong>for</strong>e the sample is poured into the sedimentation chamber,the bottle should be shaken firmly, but gently, in irregularjerks to homogenise the contents. Violent shaking will producebubbles, which can be difficult to eliminate. A rule ofthumb is to shake the bottle at least 50 times. It is recommendedto check the homogenous distribution a couple oftimes per year by counting 3 subsamples from the same stocksample.Concentration/dilution of samplesAlthough it is possible to concentrate <strong>and</strong> dilute samples thatare either too sparse or too dense it is not recommended asFigure 6. Computerised counting programme.all additional h<strong>and</strong>ling steps may interfere with the samplecontents. Instead it is recommended that a sediment chamberof an appropriate size be used to allow accurate identification<strong>and</strong> enumeration of cells.Filling the sedimentation chamberAfter homogenisation, the sedimentation chamber is placedon a horizontal surface <strong>and</strong> gently filled from the samplebottle (Fig. 7a <strong>and</strong> 7b). The chamber is then sealed with acover glass. It is important that no air bubbles are left in thechamber. It may be necessary to grease the cover glass with alittle vaseline to maintain a tight seal.SedimentationThe sedimentation should take place at room temperature<strong>and</strong> out of direct sunlight. In order to minimise evaporationthe sedimentation chamber may be covered with a plastic box<strong>and</strong> a Petri dish containing water should be placed beside thechamber (Fig. 8). Settling time is dependent on the heightof the chamber <strong>and</strong> the preservative used (Lund et al. 1958,Nauwerck 1963). Recommended settling times <strong>for</strong> Lugol’spreserved samples are shown in Table 3. According to Hasle(1978a) <strong>for</strong>maldehyde preserved samples need a settling timeof up to 40 hours independent of chamber size.After sedimentation the chimney of the sedimentation chamberis gently slid off from the bottom plate <strong>and</strong> replaced by acover glass. Care should be taken not to introduce airbubblesat this stage (Fig. 9). The transfer of the bottom plate to themicroscope will not affect the distribution of the settled <strong>phytoplankton</strong>cells if there are no air bubbles present. The bottomplate is placed on the inverted microscope (Fig. 10) <strong>and</strong>the <strong>phytoplankton</strong> cells are identified <strong>and</strong> counted.Table 3. Recommended settling times <strong>for</strong> Lugol’s iodine preservedsamples (from Edler 1979).Chamber volume(mL)Chamber heightapprox. (cm)Settling time (hr)2 1 310 2 825 5 1650 10 2416
<strong>Microscopic</strong> <strong>and</strong> Molecular Methods <strong>for</strong> Quantitative Phytoplankton AnalysisChapter 2 The Utermöhl methodABFigure 7A <strong>and</strong> 7B. Filling of sedimentation chamber.Counting procedureThe <strong>quantitative</strong> analysis should start with a scan of the entirechamber bottom at a low magnification. This will help to givean overview of the density <strong>and</strong> distribution of <strong>phytoplankton</strong>.If the distribution is considered uneven the sample must bediscarded. During this scan it is also convenient to make apreliminary species list, which may help to select the countingstrategy.Organisms should be identified to the lowest taxonomic levelthat time <strong>and</strong> skill permits (Hasle 1978b). Ultimately theobjective of the study will decide the level of identificationaccuracy.Counting begins at the lowest magnification, followed by analysisat successively higher magnification. For adequate comparisonbetween samples, regions <strong>and</strong> seasons it is importantto always count the specific species at the same magnification.In special situations, such as bloom conditions, however, thismay not be possible. Large species which are easy to identify(e.g. Ceratium spp.) <strong>and</strong> also usually relatively sparse can becounted at the lowest magnification over the entire chamberbottom. Smaller species are counted at higher magnifications,<strong>and</strong> if needed, only on a part of the chamber bottom. In Table4, the recommended magnifications <strong>for</strong> different <strong>phytoplankton</strong>sizes are listed.Counting the whole chamber bottom is done by traversingback <strong>and</strong> <strong>for</strong>th across the chamber bottom. The parallel eyepiecethreads delimit the transect where the <strong>phytoplankton</strong>are counted (Fig. 11).Figure 8. Sedimentation, with a Petri dish filled with water. Aplastic box covers the sedimentation chamber <strong>and</strong> the Petri dish tomaintain the humidity.Counting part of the chamber bottom can be done in differentways. If half the chamber bottom is to be analysed everysecond transect of the whole chamber is counted. If a smallerpart is to be analysed one, two, three or more diameter transectsare counted. After each transect is counted the chamberis rotated 25-45 o (Fig. 12).When counting sections of the chamber using transects itis important to be consistent as to which cells lying on theborder lines are to be counted. The easiest way is to decidethat cells lying on the upper or right line should be counted,whereas cells on the lower or left line should be omitted.Figure 9. Replacing the sedimentation chimney with a cover glass.In order to obtain a statistically robust result from the <strong>quantitative</strong>analysis it is necessary to count a certain number ofcounting units (cells, colonies or filaments). The precisionTable 4. Recommended magnification <strong>for</strong> counting of different sizeclasses of <strong>phytoplankton</strong> (Edler, 1979, Andersen <strong>and</strong> Throndsen2004).Size classMagnification0.2 – 2.0 µm (picoplankton)* 1000 x2.0 – 20.0 µm (nanoplankton) 100 – 400 x>20.0 µm (microplankton) 100 xFigure 10. Chamber bottom placed in microscope ready <strong>for</strong>analysis.* picoplankton are normally not analysed usingthe Utermöhl method.17
IOC Manuals & Guides no 55Chapter 2 The Utermöhl methodConfidence limit (%)200175150125100755025Figure 11. Counting of the whole chamber bottom with the paralleleyepiece threads indicating the counted area.Table 5. Relationship between number of cells counted <strong>and</strong>confidence limit at 95% significance level (Edler 1979, Andersen<strong>and</strong> Throndsen 2004).No of countedcellsFigure 12. Counting of diameter transects.Confidence limit+/- (%)Absolute limit if celldensity is estimated at500 cells L -11 200 500 ± 10002 141 500 ± 7053 116 500 ± 5804 100 500 ± 5005 89 500 ± 4456 82 500 ± 4107 76 500 ± 3808 71 500 ± 3559 67 500 ± 33510 63 500 ± 31515 52 500 ± 26020 45 500 ± 22525 40 500 ± 20050 28 500 ± 140100 20 500 ± 100200 14 500 ± 70400 10 500 ± 50500 9 500 ± 451000 6 500 ± 3000 50 100 150 200 250 300 350 400 450 500no of counted cellsFigure 13. Relationship between number of cells counted <strong>and</strong>confidence limit at the 95% significance level.desired decides how many units to count. The precision isusually expressed as the 95% confidence limit as a proportionof the mean. Table 5 <strong>and</strong> Figure 13 show the relationshipbetween number of units counted <strong>and</strong> the accuracy. In manystudies it has been decided that counting of 50 units of thedominant species, giving a 95% confidence limit of 28% issufficient. Increasing the precision to e.g. 20% or 10% wouldneed a dramatic increase in counted units, 100 <strong>and</strong> 400 respectively(Venrick 1978, Edler 1979). The precision is givenby the following equation:Precision % =2*100number of cells countedIt is clear that it will not be possible to count 50 units of allspecies present in a sample. Some species may not be sufficentlyabundant which will decrease the overall precision. Tomaintain an acceptable precision <strong>for</strong> the entire sample a totalof at least 500 units should be counted (Edler 1979).The counting unit of most <strong>phytoplankton</strong> species is the cell.In some cases this is not practical. For filamentous cyanobacteria,<strong>for</strong> instance, the practical counting unit is a certainlength of the filament, usually 100 µm (Helcom Combine2006). In some colony <strong>for</strong>ming species <strong>and</strong> coenobia it maybe difficult to count the individual cells. In such cases the colony/coenobiumshould be the counting unit. If desired, thecalculation of cells per colony/coenobium can be approximatedby a thorough counting <strong>and</strong> mean calculation of a certainnumber of colonies/coenobia.The trans<strong>for</strong>mation of the microscopic counts to the concentrationor density of <strong>phytoplankton</strong> of a desired water volume(usually Litre or millilitre) can be achieved using this equation:−1⎛ A ⎞t1000Cells L = N *⎜ *A⎟⎝ c ⎠ VCells mL−1⎛ A ⎞t1 N *⎜ *A⎟⎝ c ⎠ VV: volume of counting chamber (mL)A t: total area of the counting chamber (mm 2 )A c: counted area of the counting chamber (mm 2 )N: number of units (cells) of specific species countedC: concentration (density) of the specific species18
<strong>Microscopic</strong> <strong>and</strong> Molecular Methods <strong>for</strong> Quantitative Phytoplankton AnalysisChapter 2 The Utermöhl methodCleaning of sedimentation chambersThe cleaning of sedimentation chambers is a critical part ofthe Utermöhl method. The chambers should be cleaned immediatelyafter analysis to prevent salt precipitate <strong>for</strong>mation.A soft brush <strong>and</strong> general purpose detergent should be used(Edler 1979, Tikkanen <strong>and</strong> Willén 1992). To clean the chambermargin properly a tooth pick can be used. Usually it issufficient to clean the chamber bottom without dissemblingthe bottom glass. Sometimes, however, it is necessary to separatethe bottom glass from the chamber, either to clean it orto replace it. This is easily done by loosening the ring holdingthe bottom glass with the key. Care should be taken as thebottom glasses are very delicate. Counting chambers shouldbe checked regularly to ensure that no organisms stick to thebottom glass. This can be achieved by filling the chamberswith distilled water.Quality assuranceTo ensure high quality results all steps of the method must bevalidated. Ideally this is per<strong>for</strong>med on natural samples, butin some instances it may be helpful to spike the sample withcultured algae. Steps in the Utermöhl method to validate are• homogenisation of sample• sedimentation/sinking• distribution on chamber bottom• repeatability <strong>and</strong> reproducibilityUltimatley the quality of the result from this method is dependenton the skill of the analyst. The variation of parallelsamples counted by the same analyst <strong>and</strong> the variation inparallel samples counted by different analysts are two of themost important considerations in quality assurance (Willén1976). When possible laboratories should take part in interlaboratorycomparisons.Epifluorescence microscopyEpifluorescence microscopy is an effective method to enhancedetection <strong>and</strong> identification of certain organisms (Fritz <strong>and</strong>Triemer 1985, Elbrächter 1994). In <strong>for</strong>malin fixed samples,autofluorescence of the chlorophyll can easily be detected byepifluorescence. This will be specially important among dinoflagellates<strong>and</strong> euglenids, in which both phototrophic <strong>and</strong>obligate heterotrophic genera/species are present. Phycobilinsof cyanobacteria, rhodophytes <strong>and</strong> cryptophytes have a specialautofluorescence, thus this method is particularly suitedto detect <strong>and</strong> count cryptophytes <strong>and</strong> small coccoid cyanobacteria.In addition, staining of organisms can help to enhancecounting ef<strong>for</strong>t <strong>and</strong> identification of certain organisms.Applying this method, the inverted microscope should havean epifluorescence equipment. The lenses should be suitable<strong>for</strong> fluorescence microscopy. For the respective excitation filter<strong>and</strong> barrier filter to be used to detect the different epifluorescenceemissions, the supplier of the respective microscopeshould be contacted. Some in<strong>for</strong>mation on filter combinationsis provided by Elbrächter (1994). A common methodis to induce epifluorescence in organisms with cellulose cellwalls (e.g. thecate dinoflagellates, chlorophytes, “fungi” <strong>and</strong>others) by Fluorescent Brightener (Fritz <strong>and</strong> Triemer 1985).Figure 14. Alex<strong>and</strong>rium ostenfeldii, epifluorescence light microscopy,stained with Fluorescent Brightener. Note the clear indicationof the sutures <strong>and</strong> the large ventral pore, characteristic <strong>for</strong> thisspecies.Protocol <strong>for</strong> staining <strong>and</strong> use of epifluorescence• Prepare a 0.1% stock solution of Fluorescent Brightener.• The fluorescent brightener solution should be added tothe sedimentation chamber be<strong>for</strong>e filling it with the sample.The final concentration should be 0.02 %.• Switch on the mercury lamp <strong>for</strong> about 10 min. be<strong>for</strong>estarting to analyse the sample.• Use Exitation Filter BP 390-490 <strong>and</strong> Barrier Filter LP515 or filters recommended by the microscope br<strong>and</strong>.This will give dinoflagellate thecae a clear intensive blue epifluorescenceincluding the sutures of the plates (Fig. 14). Othercellulose items like chlorophyte cell walls, cell walls of fungiparasitising in diatoms etc. will also fluoresce.Note that the intensity of epifluorescence is pH dependent, inacidic samples epifluorescence is absent or poor.DiscussionThe Utermöhl method <strong>for</strong> the examination of <strong>phytoplankton</strong>communities is probably the most widely used method <strong>for</strong>the <strong>quantitative</strong> analysis of <strong>phytoplankton</strong>. Through the yearsboth microscopes <strong>and</strong> sedimentation chambers have developedconsiderably, yet it is the taxonomic skill of the analystthat sets the st<strong>and</strong>ard of the results.The Utermöhl method determines both the quantity <strong>and</strong> diversityof <strong>phytoplankton</strong> in water samples. Moreover, withonly a little extra ef<strong>for</strong>t, the biovolume of the different speciescan also be elucidated. The method allows very detailed analysis<strong>and</strong> with high quality lenses the resolution of <strong>phytoplankton</strong>morphology can be very good. The Utermöhl method hassome disadvantages. It is very time consuming <strong>and</strong> thus alsovery costly. In order to achieve reliable results the analyst hasto be skilled, with a good knowledge of the taxonomic literature.It is commonly agreed that analysts take some years totrain <strong>and</strong> must then keep up to date with the literature.19
IOC Manuals & Guides no 55Chapter 2 The Utermöhl methodReferencesAndersen P, Throndsen, J (2004) Estimating cell numbers. In Hallegraeff,GM, Anderson DM, Cembella AD (eds) Manual onHarmful Marine Microalgae. Monographs on OceanographicMethodology no. 11. p. 99-130. UNESCO PublishingCEN/TC 230 (2005) Water quality — Guidance on <strong>quantitative</strong><strong>and</strong> qualitative sampling of marine <strong>phytoplankton</strong>. pp. 26.Edler L (1979) Recommendations on <strong>methods</strong> <strong>for</strong> Marine BiologicalStudies in the Baltic Sea. Phytoplankton <strong>and</strong> Chlorophyll. BalticMarine Biologists Publication No. 5, p 38Elbrächter, M, 1994. Green autofluorescence – a new taxonomicfeature <strong>for</strong> living dinoflagellate cysts <strong>and</strong> vegetative cells. Rev. Palaeobot.Palynol. 84: 101-105.Fritz, L., Triemer, RE 1985. A rapid simple technique using calcofluorWhite M2R <strong>for</strong> the study of dinoflagellate thecal plates. J.Phycol. 21: 662-664.Hallegraeff GM, Anderson, DM, Cembella AD (2004) Manual onHarmful Marine Microalgae. Unesco Publishing, Paris. ISBN 92-3-103871-0Hasle GR (1978a) The inverted-microscope method. In: Sournia,A. (ed.) Phytoplankton manual. UNESCO Monogr. Oceanogr.Method. 6: 88-96Hasle GR (1978b) Identification problems. General recommendations.In: Sournia A (ed.):Phytoplankton manual. UNESCOMonogr. Oceanogr. Method. 6: 125-128Heimdal BR (1978) Coccolithophorids. In: Sournia A (ed.):Phytoplankton manual. UNESCO Monogr. Oceanogr. Method.6: 148-150HELCOM Combine Manual, 2006. http://www.helcom.fi/Monas/CombineManualLund JWG., Kipling C, Le Cren ED. (1958) The inverted microscopemethod of estimating algal numbers <strong>and</strong> the statistical basisof estimations by counting. Hydrobiologia 11:2, pp. 143-170Nauwerck A (1963) Die Beziehungen zwischen Zooplankton undPhytoplankton im See Erken. Symb. Bot. Ups. 17(5): 1-163Throndsen J (1978) Chapter 4. Preservation <strong>and</strong> storage. In: SourniaA (ed.): Phytoplankton manual. UNESCO Monogr. Oceanogr.Method. UNESCO. 6: 69-74Tikkanen T, Willén T (1992) Växtplanktonflora. Naturvårdsverket.ISBN 91-620-1115-4. pp. 280Utermöhl H (1931) Neue Wege in der <strong>quantitative</strong>n Erfassung desPlanktons. (Mit besonderer Berücksichtigun des Ultraplanktons).Verh. Int. Ver. Theor. angew. Limnol. vol. 5, no. 2. p. 567-596Utermöhl H (1958) Zur Vervollkommnung der <strong>quantitative</strong>nPhytoplankton-Methodik. Mitt int. Verein. theor. angew. Limnol.9: 1-38Venrick EL (1978) How many cells to count? In: Sournia A (ed.):Phytoplankton manual. UNESCO Monogr. Oceanogr. Method.6: 167-180Willén E (1976) A simplified method of <strong>phytoplankton</strong> counting.British Phycology Journal. 11:265-278Willén T (1962) Studies on the <strong>phytoplankton</strong> of some lakes connectedwith or recently isolated from the Baltic. Oikos. 13: 169-19920
<strong>Microscopic</strong> <strong>and</strong> Molecular Methods <strong>for</strong> Quantitative Phytoplankton AnalysisChapter 3 Settlement bottle method3 Settlement bottle method <strong>for</strong> <strong>quantitative</strong><strong>phytoplankton</strong> analysisGeorgina McDermott* 1 <strong>and</strong> Robin Raine 21Environmental Protection Agency, (Castlebar), Co. Mayo, Irel<strong>and</strong>2Martin Ryan Institute, National University of Irel<strong>and</strong>, Galway, Irel<strong>and</strong>*Author <strong>for</strong> correspondence: G.McDermott@epa.ieIntroductionThe settlement bottle technique is a modified Utermöhl technique(Hasle 1978) <strong>for</strong> quantifying <strong>phytoplankton</strong>. It relieson the observation <strong>and</strong> enumeration of <strong>phytoplankton</strong> cellsafter sedimentation using an inverted microscope. It differsfrom other similar methodologies as once a sample has beentaken <strong>and</strong> is preserved, there is no further requirement <strong>for</strong>any more sub-sampling or manipulation. Once a water samplehas been taken, it is transferred directly into a plastic tissueculture flask, a preservative is added <strong>and</strong> the sample isstored until analysis. For counting, the contents of the flaskare gently shaken, allowed to settle onto one of the flat sidesof the flask which is then placed directly onto an invertedmicroscope. As with other Utermöhl <strong>methods</strong>, it requires theskills of an analyst experienced in the identification of <strong>phytoplankton</strong>cells.MaterialsLaboratory facilitiesThe settlement bottle method is simple in that all it requiresare tissue culture flasks (acting as sample jars <strong>and</strong> countingchambers), some preservative <strong>and</strong> an inverted microscope.Thus all that is required is a room, preferably without directsunlight, with enough space <strong>and</strong> a power supply to use aninverted microscope.EquipmentTissue culture bottles of 50-60 mL capacity are used. Largervolume bottles are difficult to place on a microscope <strong>and</strong> sufferfrom movement of water inside them during examination.Smaller sized bottles will probably not contain enough sample.The bottles should be rectangular in shape, as opposed tohaving a triangular <strong>for</strong>m, as this makes the calculation at theend much simpler.The base of the tissue culture bottles are examined using aninverted microscope. This should be equipped with 10X, 20X<strong>and</strong> 40X objective lenses. The 20X <strong>and</strong> 40X lenses shouldhave a long focal length. The technique can be applied using achoice of either brightfield or phase contract microscopy. Differentialinterference contrast (DIC) <strong>and</strong> epifluorescence microscopyare unsuitable. A specialised plate <strong>for</strong> secure mountingof the settlement bottle onto the stage of the invertedmicroscope may need to be manufactured. See Appendix <strong>for</strong>examples of equipment.Chemicals <strong>and</strong> consumablesThe only chemicals that are required are solutions of preservative.Lugol’s iodine, neutral <strong>for</strong>malin or glutaraldehyde are allsuitable.MethodsPreparation of sampleBe<strong>for</strong>e taking a sample, a tissue culture bottle should be labelledwith appropriate in<strong>for</strong>mation (Date, location, stationnumber, depth) with a permanent marker pen. Labels shouldbe written on the edge or narrow side of the bottle, not on thebroad side (see Fig. 1) so that it does not interfere with theidentification <strong>and</strong> enumeration of cells.The tissue culture bottle should be filled to the top with thewater sample, leaving just enough air space to add preservative.This prevents the introduction of large air bubbles whichcan degrade the optical path when examining through or nearthe edge of the bubble.Be<strong>for</strong>e the sample is allowed to settle it should be wiped clean<strong>and</strong> acclimated to room temperature <strong>for</strong> 24 hours <strong>and</strong> thengently shaken to disrupt any aggregation of <strong>phytoplankton</strong>cells. This can be achieved by a combination of horizontallyrolling <strong>and</strong> vertically turning the sample bottle upside downas gently as possible to prevent the break-up of colonies <strong>and</strong>the accumulation of air bubbles. The contents of the tissueculture flask should be allowed to settle <strong>for</strong> a period of at leastsix hours.Analysis of sampleThe <strong>phytoplankton</strong> cells can then be counted using an invertedmicroscope. The entire base of the bottle or a numberof strips, going across the length or width of the bottle, can beexamined <strong>and</strong> the cells of each species or type are scored (seeFig. 2 <strong>for</strong> details).Preservation <strong>and</strong> storageAs with all samples of <strong>phytoplankton</strong>, deterioration is extremelyfast in direct sunlight. All samples should there<strong>for</strong>ebe stored in the dark, stacked, preferably horizontally, tominimise storage space. Samples should also be kept cool, althoughrefrigeration is not absolutely necessary. Storage overlong periods of time (months) is not as effective using Lugol’siodine, as opposed to <strong>for</strong>malin or glutaraldehyde, as leachingof iodine into the plastic will occur which will deteriorate thequality of microscopic observations.21
IOC Manuals & Guides no 55Chapter 3 Settlement bottle methodThe fundamentals ofThe settlement bottle methodScopeQualitative <strong>and</strong> <strong>quantitative</strong> analysis of <strong>phytoplankton</strong>.Detection rangeDetection range is dependent on the volume of sample settled<strong>and</strong> the number of strips analysed. Counting over the base ofa 50 mL settlement bottle will give a detection limit of ca. 20cells per Litre.AdvantagesAvoidance of errors arising from sub sampling. Qualitative aswell as <strong>quantitative</strong> analysis. Identification <strong>and</strong> quantificationof multiple or single species. Detection of harmful species. Sedimentbottles are available at low cost.DrawbacksOptical resolution is reduced due to the thickness of the wall ofthe settlement bottles. This is a time consuming analysis thatrequires skilled personnel. Sedimentation time prevents the immediateanalysis of samples. DIC <strong>and</strong> epifluorescence microscopyare not suitable with this method. Special long distanceobjectives must be used at higher magnifications.Type of training neededAnalysis requires continuous training over years with in-depthknowledge of taxonomic literature.Essential EquipmentInverted microscope, settlement bottles, identification literature.Equipment cost*Inverted microscope: 7,500 – 50,000 € (11,000 – 70,000 US $).Identification literature: 1,000 – 3,000 € (1,400 – 4,300 US $).Consumables, cost per sample**Less than 5 €/4 US $.Processing time per sample be<strong>for</strong>e analysisA minimum of 6 hours sedimentation time <strong>for</strong> a 50 mL settlementbottle.Analysis time per sample2-10 hours or more depending on type of sample <strong>and</strong> analysis.Sample throughput per person per day1-4 depending on type of sample <strong>and</strong> analysis.No. of samples processed in parallelOne per analyst.Health <strong>and</strong> Safety issuesAnalysis sitting at the microscope is tiresome <strong>for</strong> eyes, neck <strong>and</strong>shoulder. Frequent breaks are needed. If <strong>for</strong>malin is used as preservationagent appropriate health <strong>and</strong> safety guidelines mustbe followed.*service contracts not included**salaries not included22
IOC Manuals & Guides no 55Chapter 3 Settlement bottle methodrectly put into a tissue culture bottle, preserved <strong>and</strong> capped inthe field, after which there is no further need <strong>for</strong> any futuresub-sampling. Samples fixed with <strong>for</strong>malin can be stored intact<strong>for</strong> an extended period of time. If noxious chemicals suchas <strong>for</strong>malin or glutaraldehyde are used as preservatives, thenthere is no danger of contamination or fumes resulting fromthem as the sample is in an air- <strong>and</strong> water-tight container.Additionally, many samples can be prepared <strong>for</strong> analysis atany given time as there is no need <strong>for</strong> an extended range ofrelatively expensive settlement chambers.No technique is without imperfections. In the case of the settlementbottle method the most irritating of these is probablythe leaching of iodine into the sides of the tissue culture bottleif either acidic or neutral Lugol’s iodine is used to preserve thesamples. This occurs after a few weeks, <strong>and</strong> reduces the qualityof the observations. As the sample is enclosed, sedimentedspecimens of <strong>phytoplankton</strong> cannot be manipulated whichcan on occasion make identification very difficult. Observationsof cells at the extreme edges sides of the bottle can bedifficult. However, the method is ideal <strong>for</strong> long-term storageespecially if the samples are stored with <strong>for</strong>malin. The methodis also very low cost relative to other techniques.AcknowledgementsOne of the authors (GMcD) wishes to acknowledge the financialassistance of Bord Iascaigh Mhara <strong>for</strong> attendance atthe WKNCT workshop in Kristineberg, Sweden.ReferencesHasle GR (1978) Counting <strong>phytoplankton</strong> cells In Sournia A (ed.)Phytoplankton Manual. UNESCO, Paris, p337.AppendixTable 1. Equipment <strong>and</strong> suppliers.Equipment Supplier <strong>and</strong> model reference € US $Inverted Microscope e.g. Nikon TS100F, Olympus CKX41 5,000-6000 † 6,500-8,500Tissue Culture Bottles Any medical laboratory supplier 0.5-1 each Ca. 1 each†The price can vary considerably depending on the quality of the objective lenses used. The price hereis <strong>for</strong> a reasonable quality set of 10X, 20X <strong>and</strong> 40X lenses.24
<strong>Microscopic</strong> <strong>and</strong> Molecular Methods <strong>for</strong> Quantitative Phytoplankton AnalysisChapter 4 Counting chamber <strong>methods</strong> - Haemocytometer, Palmer-Maloney cell <strong>and</strong> Sedgewick-Rafter cell4 Counting chamber <strong>methods</strong> <strong>for</strong> <strong>quantitative</strong> <strong>phytoplankton</strong>analysis - haemocytometer, Palmer-Maloney cell <strong>and</strong>Sedgewick-Rafter cellMurielle LeGresley* 1 <strong>and</strong> Georgina McDermott 21Fisheries & Oceans Canada, Biological Station, 531 Br<strong>and</strong>y Cove Road, St. Andrews, NB E5B 2L9, Canada2Environmental Protection Agency, John Moore Road, Castlebar, Co. Mayo, Irel<strong>and</strong>*Author <strong>for</strong> correspondence e-mail: Murielle.LeGresley@dfo-mpo.gc.caGeneral introductionThe counting chamber <strong>methods</strong> are established <strong>methods</strong>to count <strong>phytoplankton</strong>. The three most common types ofcounting chambers <strong>for</strong> <strong>phytoplankton</strong> enumeration are theSedgewick-Rafter counting slide, the Palmer-Maloney countingslide <strong>and</strong> the haemocytometer counting slide. All three<strong>methods</strong> are easy to learn <strong>and</strong> use, requiring preserved sample,a good quality compound microscope <strong>and</strong> counting slides.The set up cost is low <strong>and</strong> it is beneficial to have a selectionof all three on h<strong>and</strong> in the laboratory. These <strong>methods</strong> areparticularly suitable <strong>for</strong> samples containing a high concentrationof cells, as in bloom situations or in <strong>phytoplankton</strong> cultureswith the haemocytometer being reserved <strong>for</strong> extremelyhigh cell densities of small organisms. The capability of theSedgewick-Rafter <strong>and</strong> the Palmer-Maloney to view the whole<strong>phytoplankton</strong> community including the presence of harmfulspecies is a definite asset. Nevertheless correct identificationof the <strong>phytoplankton</strong> community still requires highly trainedanalysts <strong>for</strong> its implementation.Sedgewick-Rafter counting slideIntroductionThe Sedgewick-Rafter counting slide is a traditional countingmethod using a compound microscope <strong>and</strong> a highly trainedtaxonomist. This is a rapid method <strong>for</strong> quantifying sampleswith high cell numbers. The slide is comprised of a transparentbase, which has a centrally mounted chamber (50 mmx 20 mm x 1 mm deep) <strong>and</strong> can hold 1 mL of sample. Thebase of this chamber has a ruled 1 mm grid, so that the 1 mLsample is subdivided into single microlitres. This chamber iscovered over by a cover glass, which protects the sample fromdrying out <strong>and</strong> disturbances by air currents. The sample isthen counted using a compound microscope.MaterialsEquipment• A st<strong>and</strong>ard, compound microscope with 10X <strong>and</strong> 20Xobjectives <strong>and</strong> brightfield <strong>and</strong> phase contrast. A 40X objectivemay not be able to be used <strong>for</strong> this analysis, thisdepends on the working distance of the objective lenses.• A Sedgewick-Rafter slide: This can be made from plasticor glass.• A tally counter is useful when counting high cell numbers.Chemicals <strong>and</strong> consumables• A pipette is needed to dispense the sample into the cell.• Sample bottles <strong>for</strong> storing the samples.Solutions <strong>for</strong> preservation• Lugol’s iodine or <strong>for</strong>malin.Methods1 Prior to analysis the sample should first be homogenised.This is achieved using a combination of horizontally rolling<strong>and</strong> vertically turning the sample bottle as gently aspossible to prevent the breakup of colonies <strong>and</strong> the accumulationof bubbles;2 From a well mixed sample, 1 mL is removed using a pipette.The pipette should have a wide opening that doesnot restrict the movement of larger <strong>phytoplankton</strong> species(such as Noctiluca scintillans, Ceratium species). Thisis especially important when using a 1 mL pipette withremovable tips, the end of the tip should be cut off towiden the opening;3 The cover glass should be placed carefully onto the countingslide, perpendicular to the long axis of the slide, soone corner is left open <strong>for</strong> filling <strong>and</strong> another <strong>for</strong> the escapeof air;4 The sample aliquot is then dispensed into the countingcell (Fig. 1a – f):5 Slowly swing the cover glass so that it completely coversthe sample. Careful alignment of the cover glass will preventair bubbles from being introduced into the sample<strong>and</strong> will ensure that the sample holds its complete volume.If a bubble develops, refill the counting cell.6 Preserved samples should be left to settle <strong>for</strong> 15 minutesbe<strong>for</strong>e enumeration;7 The sample is then examined using a compound microscope.The slide should first be scanned under low magnificationto estimate the concentration of cells. Usingthis in<strong>for</strong>mation a counting strategy is decided upon asto whether the whole slide or a noted fraction is to becounted;8 If the concentration of <strong>phytoplankton</strong> in the Sedgewick-Rafter slide is too dense <strong>and</strong> the cells are overlapping thushindering identification, a dilution step should be per<strong>for</strong>medusing filtered seawater <strong>for</strong> marine samples;9 After analysis is completed the slide is washed <strong>and</strong> cleanedbetween samples to prevent cross-contamination. Apure detergent like soap is recommended (Hallegraeff etal. 2004);25
26The fundamentals ofThe counting chamber <strong>methods</strong>Counting chamber Sedgewick-Rafter Palmer-Maloney HaemocytometerScope Cultures <strong>and</strong> high cell numbers Cultures <strong>and</strong> high cell densities as in bloomconditionsCultures <strong>and</strong> extremely high cell concentration ofsmall organismsDetection range 1,000 cells L -1 Limit of Detection (LOD) 10,000 cells L -1 (LOD) 10,000,000 cells L -1 (LOD)Advantages A rapid estimate of cell concentrations A rapid estimate of high cell concentrations A rapid estimate of extremely high cellconcentrationsDrawbacksType of training neededEssential EquipmentAccurate results only when sample contains high<strong>phytoplankton</strong> cell densitiesMethod-easy to learn <strong>and</strong> use.Highly trained taxonomist needed <strong>for</strong> verification ofspecies identificationCompound MicroscopeCover slipsPipettesAccurate results only when sample contains veryhigh cell densitiesMethod-easy to learn <strong>and</strong> use.Highly trained taxonomist needed <strong>for</strong> verificationof species identification.Compound MicroscopeCover slipsPipettesAccurate results only when sample containsextremely high cell densitiesMethod-easy to learn <strong>and</strong> use.Highly trained taxonomist needed <strong>for</strong> verification ofspecies identificationCompound MicroscopePipettesSedgewick-Rafter slides Palmer Maloney slides Haemocytometer slide with cover glassEquipment cost Compound Microscope: € 2500 / 3250 US $ Compound Microscope: € 2500 / 3250 US $ Compound Microscope: € 2500 / 3250 US $Sedgewick-Rafter slides:Perspex :€50/ 65 US $Glass: €166/ 213 US $Palmer-Maloney slides:Ceramic- €60/ 80 US $Stainless Steel-€170/$230 US $Haemocytometer slide:€200/ 230 US $Consumables, cost per sample € 1/$1.3 US $ € 1/$1.3 US $ € 1/$1.3 US $Processing time/sample: 20 minutes 5 minutes 5 minutesAnalysis time /sample: This depends on the sample density 10-30 min/ sample depending on the sample < 20 min / sample depending on the sample densitydensitySample/throughput/person/ day This depends on the sample density 14-20 dependent on target species <strong>and</strong> density of < 30 dependent on target speciessamplesSamples processed in parallel Only one sample at a time Only one sample at a time Only one sample at a timeHealth <strong>and</strong> Safety issues Dependent on preservative used Dependent on preservative used Dependent on preservative usedChapter 4 Counting chamber <strong>methods</strong> - Haemocytometer, Palmer-Maloney cell <strong>and</strong> Sedgewick-Rafter cellIOC Manuals & Guides no 55
<strong>Microscopic</strong> <strong>and</strong> Molecular Methods <strong>for</strong> Quantitative Phytoplankton AnalysisChapter 4 Counting chamber <strong>methods</strong> - Haemocytometer, Palmer-Maloney cell <strong>and</strong> Sedgewick-Rafter cellPreservation <strong>and</strong> storageSamples should be stored in the dark (closed boxes) to avoiddirect light (which affects the Lugol’s iodine preservative) <strong>and</strong>at room temperature. Samples preserved with Lugol’s iodinecan deteriorate over time resulting in a paler solution whichcould impare preservation. If the samples are stored <strong>for</strong> extendedperiods, preservation should be checked regularly <strong>and</strong>further Lugol’s iodine added as appropriate.Formulas <strong>for</strong> calculating resultsThe Sedgewick-Rafter slide has a volume of 1 mL with thebase of the cell being divided into 1,000 squares (50 rowsby 20 rows), each representing 1/1,000 of the volume of theslide.1,000F =*1,000Number of Squares countedTo obtain a final result expressed as cells L -1 , the followingequation is used to calculate the multiplication factor (F). Fis dependent on the number of squares of the base of the cellcounted during the analysis.Examples of F <strong>for</strong> the Sedgewick-Rafter slide:ABCD4 rows (200 squares) are counted.1,000F = *1,000 = 5*1,000 = 5,00020050 rows (1000 squares) or the entire slide is counted.E1,000F = *1,000 = 1*1,000 = 1,0001,000DiscussionThe Sedgewick-Rafter slide is best used when analysing culturesor high biomass blooms. As this method does not requirean overnight settling period, it is rapid <strong>and</strong> can providea quick assessment of a water sample. It has been proven toprovide accurate results between 10,000 (ICES 2006) <strong>and</strong>100,000 cells L -1 (McAlice 1971). The set up cost is low dueto the use of a compound microscope.The Sedgewick-Rafter slide tends to per<strong>for</strong>m better withsamples containing larger <strong>phytoplankton</strong> cells. Another countingmethod may have to be used <strong>for</strong> samples with low celldensities. It may be possible to pre-concentrate cells using afiltering/settling step when the target organism is present inlow concentrations.Plastic Sedgewick-Rafter slides tend to scratch easily <strong>and</strong> careFFigure 1. A – F: Loading Lugol’s iodine preserved sample intoSedgewick-Rafter cell.must be taken when cleaning the cell. Scratches may hinderthe accurate identification of cells. Due to the design of theSedgewick-Rafter slide it may be difficult to use the 40X magnification.This could prove a problem in the identification ofsmaller (10-15 µm) <strong>phytoplankton</strong> cells. In addition extemecare must be taken to load the Sedgewick-Rafter slide correctly<strong>and</strong> avoid the introduction of air bubbles to ensure theeven distribution of <strong>phytoplankton</strong> in the slide.27
IOC Manuals & Guides no 55Chapter 4 Counting chamber <strong>methods</strong> - Haemocytometer, Palmer-Maloney cell <strong>and</strong> Sedgewick-Rafter cellPalmer-Maloney counting slideIntroductionABThe Palmer-Maloney counting slide method is a rapid <strong>and</strong>straight<strong>for</strong>ward technique that was first employed to enumeratenanoplankton. The counting chamber is round, measures17.9 mm in diameter, 400 µm depth <strong>and</strong> holds a volume 0.1mL of sample. Two loading channels are located on eitherside of the counting slide (Fig. 2 a-d). The Palmer-Maloneyslide does not have any rulings or grid. This counting slide isuseful with cultures, samples with high cell densities or preconcentratedsamples. The detection level is 10,000 cells L -1or 10 cells mL -1 (Guillard 1978).CDEquipmentA st<strong>and</strong>ard compound microscope or an inverted microscopewith 10X <strong>and</strong> 20X objectives. Phase contrast <strong>and</strong> epifluorescencecapability are valuable asset to the identification of <strong>phytoplankton</strong>.• Palmer-Maloney counting slide• Cover glass (22mm X 22mm or 50mm X 22 mm)• Pipettes (Pasteur or disposable) needed to dispense thesample• A tally counter is useful when counting high cell numbersChemicals <strong>and</strong> consumables• Preservative (Lugol’s iodine, Formalin) (see chapter 2 <strong>for</strong>recipes)• Alcohol <strong>for</strong> cleaning slidesMethod1 The cover glass should initially be placed over the countingchamber;2 The preserved sample should be inverted gently about10-20 times to ensure homogenisation. A pipette is filledwith the well-mixed sample;3 The chamber of the counting slide is then filled by graduallydispensing an aliquot of sample from the pipette intoone of the loading channels (Fig. 2 a-d). It is importantthat no air bubbles are present in the chamber. Trappedair may be removed by slowly sliding the cover slip backthen replacing it in its original position however it maybe nessecary to repeat steps 1-3;4 The slide should be left to settle <strong>for</strong> 5 minutes;5 Counting organisms should begin at the top or bottomedge <strong>and</strong> continue until all area of the chamber is examinedexcluding loading channels. The centre of the loadingchannels are effective reference points to count halfof the slide;6 Once the count has been completed the slide <strong>and</strong> coverglass should be rinsed thoroughly with water then withalcohol <strong>and</strong> wiped clean with lint-free wipes.Figure 2 A –D: Loading sample into the Palmer Maloney cellPreservation <strong>and</strong> storageAny preserved samples can be used with this method.Note: samples preserved in Lugol’s iodine- should be kept inthe dark <strong>and</strong> checked periodically <strong>for</strong> light tea colour, addingmore preservative if needed.Formulas <strong>for</strong> calculating resultsSince the volume of a Palmer-Maloney slide is 0.1 mL, multiplythe total count by 10,000 to obtain the number ofcells L -1 .For example:Cells per Litre= total cell count * 10,000Final count in the Palmer-Maloney slide is 200 cells; 200 *10,000= 2,000,000 cells L -1DiscussionThe Palmer-Maloney counting slide method is excellent toenumerate dense blooms, net tows, cultures or pre-concentratedsamples. It is an inexpensive <strong>and</strong> rapid counting methodin which the entire <strong>phytoplankton</strong> community may be observedincluding harmful algae species.This counting slide is appropriate <strong>for</strong> enumerating most speciesbut is not as useful <strong>for</strong> counting large organisms (>150µm) or long chain-<strong>for</strong>ming diatoms as these may not be distributedevenly in the sample (Guillard <strong>and</strong> Sieracki 2005).Because of the thickness of the Palmer-Maloney slide the highestmagnification objective lenses possible to use with somecompound microscopes is 10X or 20X. Thus this slide is nota good choice when the proper identification or enumerationof an organism requires a higher magnification. This can beaddressed by using an inverted microscope with a higher objective.The Palmer-Maloney slide may also be used with calcofluorstain <strong>and</strong> an epifluorescence microscope <strong>for</strong> thecatedinoflagellate identification.When using the small cover slips (22 mm x 22 mm) the samplemay have a tendency to evaporate. This problem can besolved by using longer cover slips (22 mm x 55 mm) or byapplying parafilm to cover the loading channels. This methodmay be used to monitor target species that are deemed to beharmful only at very high cell concentrations.28
<strong>Microscopic</strong> <strong>and</strong> Molecular Methods <strong>for</strong> Quantitative Phytoplankton AnalysisChapter 4 Counting chamber <strong>methods</strong> - Haemocytometer, Palmer-Maloney cell <strong>and</strong> Sedgewick-Rafter cellHaemocytometer counting methodIntroductionThe haemocytometer (also used <strong>for</strong> counting blood cells) is acounting slide method specially practical <strong>for</strong> cultures <strong>and</strong> extremelyhigh concentrations of cells of small sized organisms(< 30 µm). The middle of the slide has the appearance of an“H” which separates the 2 thin silver-coloured chambers bothengraved with a nine-square grid. Haemocytometers may bepurchased in either 0.1 mm or 0.2 mm depth <strong>and</strong> may possessdifferent grid subdivisions. The most common slide of thistype is 0.1 mm deep with Improved Neubauer ruling (Fig.3); each chamber holding nine 1-mm large squares separatedby double or triple rulings. The volume in nine large squaresis 0.0009 mL, with the 2 chambers having 18 squares with atotal volume of 0.0018 mL.Equipment• A st<strong>and</strong>ard compound microscope or an inverted microscopewith 10X <strong>and</strong> 20X objectives, phase contrast• Haemocytometer counting slide (Improved Neubauerrulings)• Cover glass supplied with haemacytometer• Pipettes (Pasteur)Chemicals <strong>and</strong> consumables• Preservative (Lugol’s iodine, Formalin) ( see chapter 2 <strong>for</strong>recipes)• Alcohol <strong>for</strong> cleaning slidesFigure 3. Drawing of haemocytometer with improved Neubauer ruling.A1 mmMethods1 A cover glass is placed over both chambers of the haemocytometer;2 With a soft undulating motion, the preserved sample isgently inverted appoximately 10-20 times to ensure thesample is mixed thoroughly;B3 A Pasteur pipette is filled with the well-mixed sample;4 Each chamber of the haemocytometer is loaded by holdingpipette at a 30 to 45 degree angle with the opendispensing tip in the V-shaped slash, allowing the pipettetip to touch the slot then slowly expelling a drop of theliquid. The capillary action will fill the chamber with thesample. It is important to check that the liquid spreadsover the silver- coloured chamber without overflowinginto the moats. (Fig 4);5 Step 2-4 is repeated to fill the other side of the chamber.Allow 2-3 minutes <strong>for</strong> cells to settle;6 The slide should be scanned initially in the microscope todetermine the counting strategy. The whole slide or a selectednumber of large squares should be counted to obtaina statistically significant number of cells (Andersen<strong>and</strong> Throndsen 2004). Each side of the haemocytometerslide has a grid with nine large 1 mm 2 squares which arefurther subdivided depending on the type of haemocytometer;CFigure 4 A-C: Loading sample into haemocytometer.29
IOC Manuals & Guides no 55Chapter 4 Counting chamber <strong>methods</strong> - Haemocytometer, Palmer-Maloney cell <strong>and</strong> Sedgewick-Rafter cell7 The number of organisms <strong>and</strong> the number of squarescounted should both be noted. To avoid counting cellstwice, it must be determined be<strong>for</strong>eh<strong>and</strong> to include cellsthat touch 2 of the 4 sides of each square (i.e. the top <strong>and</strong>left side of each large square while ignoring the cells thattouch the bottom <strong>and</strong> right side);8 After the count has been completed the haemocytometerslide must be cleaned thoroughly by rinsing the slide <strong>and</strong>cover glass with running water then with alcohol, wipingclean with lint-free wipes.Preservation <strong>and</strong> storageAny preserved samples can be used.Note: samples preserved in Lugol’s iodine- should be kept inthe dark <strong>and</strong> checked periodically <strong>for</strong> light tea colour, addingmore preservative if needed.Formulas <strong>for</strong> calculating resultsTotal the cells <strong>and</strong> divide by the number of large 1 mm squarescounted to obtain the average number of cells per square.Multiply this average cell number by 10,000 to obtain numberof cells per mL. (Alternately to obtain the number ofcells per Litre, multiply the average number of cells per largesquare by 10,000,000).The average number of cells per mL = average count per largesquare X 10,000For example: In total 200 cells in 4 large squares are counted:200 Average number of cells counted = = 504−1Cells per mL 50*10,000 500,000 cells mLDiscussionThe haemocytometer counting method is excellent <strong>for</strong> countingcultures or an extremely high concentration of small cells.The slide can be used with 10X objective with the compoundmicroscope or with 10X or 20X objectives with an invertedmicroscope. This method is not suitable <strong>for</strong> routine watermonitoring because of the high cell biomass needed to getstatistically significant numbers. It will not give an overviewof the whole <strong>phytoplankton</strong> community especially organismswith a low cell density. It is not compatible with large organismsbecause of the shallow 0.1 mm depth of the slide. It isbetter to use the slide <strong>for</strong> extremely high cell estimates.Pre-concentration of sampleConcentration of sample may be necessary when cell densityis low. This can be achieved using a settlement method wherea sample is poured into a graduated cylinder (of volume (A))<strong>and</strong> allowed sufficient time <strong>for</strong> cells to settle (one hour <strong>for</strong>each cm height of cylinder or overnight). After settling, thewater from the upper portion of the sample is gently removed<strong>and</strong> the final volume (B) noted. Another method involves filteringthe sample through a 10 or 20 µm mesh (i.e. planktonnet). The concentration factor (CF) is calculated by dividingthe initial volume (A) by the final volume (B). The remainingvolume should be mixed well <strong>and</strong> the instructions of thecounting method followed, remembering to divide the totalcell count by the CF.Example:A 100CF = = = 10B 10The original volume (A) = 100 mLFinal volume (B) = 10 mLAcknowledgementsOne of the authors (GMcD) wishes to acknowledge the assistanceof Bord Iascaigh Mhara (The Irish Fisheries Board).<strong>for</strong> assistance in attending the WKNCT workshop in Kristineberg,Sweden.ReferencesAndersen P, Throndsen J (2004) Estimating cell numbers. In: HallegraeffGM, Anderson DM, Cembella AD (eds) Manual on HarmfulMarine Microalgae 99-129Guillard RRL (1978) Counting Slides. In: A. Sournia (ed) PhytoplanktonManual. UNESCO Publishing 182-189Guillard RRL, Sieracki MS (2005) Counting cells in cultures withthe light microscope. In: Andersen RA (ed) Algal CulturingTechniques Elsevier Academic Press 239-252Hallegraeff GM, Anderson DM, Cembella AD (2004) Manual onHarmful Marine Microalgae. UNESCO Publishing 793ppICES (2006) Report on the ICES/IOC workshop on new <strong>and</strong> classictechniques <strong>for</strong> the determination of numerical abundance <strong>and</strong>biovolume of HAB species – evaluation of the cost, time-efficiency<strong>and</strong> intercalibration <strong>methods</strong> (WKNCT), 22-27 August2005, Krinstineberg, Sweden. ICES CM 2005/C:10McAlice BJ (1971) Phytoplankton sampling with the Sedgewick-Rafter cell. Limnol Oceanogr 16(1)19-28.30
<strong>Microscopic</strong> <strong>and</strong> Molecular Methods <strong>for</strong> Quantitative Phytoplankton AnalysisChapter 5 Filtering - Calcofluor staining - <strong>quantitative</strong> epifluorescence microscopy5 Filtering – calcofluor staining – <strong>quantitative</strong> epifluorescencemicroscopy <strong>for</strong> <strong>phytoplankton</strong> analysisPer Andersen*Orbicon A/S, Johs. Ewalds Vej 42-44, DK-8230 Åbyhøj, DENMARK*Author <strong>for</strong> correspondence e-mail: pea@orbicon.dkIntroductionIdentification <strong>and</strong> enumeration of thecate dinoflagellates,which include several toxic species, is frequently a timeconsuming exercise. Species from the genera Dinophysis <strong>and</strong>Prorocentrum (the causative organisms of diarrhetic shellfishpoisoning, DSP), Alex<strong>and</strong>rium <strong>and</strong> Pyrodinium (the causativeorganisms of paralytic shellfish poisoning, PSP), Ostreopsis<strong>and</strong> Gambierdiscus (responsible <strong>for</strong> ciguatera fish poisoning,CFP) may cause problems to the aquaculture <strong>and</strong> fishingindustries even when they occur in low concentrations. Traditionally,<strong>quantitative</strong> analysis of <strong>phytoplankton</strong> samples isper<strong>for</strong>med using the well established Utermöhl sedimentationprocedure (Utermöhl 1958). The Utermöhl procedureinvolves sedimentation of the plankton sample (5-50 mL) <strong>for</strong>a period of 8 -24 hours depending on the sample volume.The long sample sedimentation time prior to analysis <strong>and</strong> thecomplexities of identification of thecate dinoflagellates meansthat this method cannot provide a rapid result. Quantitativeepifluorescence techniques, basically adapted from the acridineorange technique by Hobbie et al. (1977), involves filtration<strong>and</strong> staining of the organisms on polycarbonate filters.This method, which was originally described <strong>for</strong> counting ofpelagic bacteria has been modified <strong>for</strong> counting of hetero- <strong>and</strong>autotrophic nanoflagellates as well as larger <strong>phytoplankton</strong><strong>and</strong> protozooplankton organisms (see e.g. Haas 1982, Andersen<strong>and</strong> Sørensen 1986). Examples of fluorochromes usedare acridine orange (Andersen <strong>and</strong> Sørensen 1986) or DAPI(Porter <strong>and</strong> Feig 1980). Apart from the DNA, these fluorochromesalso stain other compounds found in cells. Whenworking in coastal waters <strong>and</strong> shallow fjords where the pelagicbiomass is high <strong>and</strong> often dominated by diatoms, quantificationof thecate dinoflagellates present in low concentrationsmust be carried out on relative large water samples (50-100mL). In such cases the analysis can be rendered practically impossibleusing either acridine orange or DAPI. This is becausethecate dinoflagellates must be identified among high concentrationsof other organisms such as diatoms, which alsofluorescence heavily.In this chapter, a method is presented which is based uponthe <strong>quantitative</strong> epifluorescence technique using CalcoflourWhite M2R as a stain. The method has previously been describedin Andersen (1995), Andersen <strong>and</strong> Kristensen (1995),Andersen <strong>and</strong> Throndsen (2004). Calcofluor is a specific stain<strong>for</strong> the cellulose in the thecal plates of the thecate dinoflagellates(Lawrence <strong>and</strong> Triemer 1985). The stain does not stainstructures in most other pelagic organisms including the diatoms.Using this method it is possible to analyse sample volumesfrom 10 to 500 mL, thereby obtaining reliable estimatesof thecate dinoflagellates present in low concentrations in thepresence of large concentrations of diatoms.MaterialsLaboratory facilitiesThe method can be used in a basic laboratory. No special facilitiesare required.EquipmentA filtration unit <strong>and</strong> a vacuum pump as well as an epifluorescencemicroscope equipped with a mercury lamp <strong>and</strong> filter set<strong>for</strong> DAPI (UV excitation (330-380 nm), emission filter (420nm) is required, see Table 1.Chemicals <strong>and</strong> consumablesThe stain, Calcofluor White M2R (Polysciences, WarringtonPA) is especially useful <strong>for</strong> qualitative as well as <strong>quantitative</strong>analysis of thecate dinoflagellates because it stains the cellulosein the thecal plates of dinoflagellates <strong>and</strong> not other planktonorganisms or detritus.Calcofluor White M2R is a fluorescent brighter. The chemical<strong>for</strong>mula of Calcofluor White M2R is: C 40H 42N 12O 10S 2Na 2.Calcofluor White M2R can be stored at room temperature.Table 1. Equipment <strong>and</strong> consumables required <strong>for</strong> the <strong>quantitative</strong>epifluorescence method using Calcofluor White M2R.• Calcofluor White M2R or a similar product• A 10 mL glass bottle• Polycarbonate membrane filters (pore size 5 µm)• Paraffin oil• Neutral Lugol’s iodine• A filtration unit• A vacuum pump• Glass microscope slides• Cover slips (24x24 mm)• An epifluorescence microscope equipped with a mercurylamp <strong>and</strong> filter set <strong>for</strong> DAPI (UV excitation, 330-380 nm,emission filter, 420 nm)MethodHow to make the Calcofluor working solutionAdd approximatley 2 µg Calcofluor to 10 mL of distilled waterin a clean acid rinsed (5% HCl) glass bottle. The Calcofluorwill dissolve immediately, <strong>and</strong> the working solutionis ready to use. If the glass bottle is not completely clean theCalcofluor may precipitate <strong>and</strong> the solution can not be used.The working solution of Calcofluor does not require preservation.It can remain viable <strong>for</strong> a few days to several weeks atroom temperature in the laboratory.31
IOC Manuals & Guides no 55Chapter 5 Filtering - Calcofluor staining - <strong>quantitative</strong> epifluorescence microscopyThe fundamentals ofThe filtering - calcofluor staining - <strong>quantitative</strong> fluorescence microscopyScopeQualitative <strong>and</strong> <strong>quantitative</strong> analysis of thecate dinoflagellates.Detection rangeDetection range is dependent on the volume of sample filtered.Counting all of the cells from a 200 mL sample will give a detectionlimit of 5 cells per Litre.AdvantagesPreparation time is short. Specific identification of thecate dinoflagellatesis feasible as the staining makes the relevant morphologicalfeatures visible. Preparations can be stored <strong>for</strong> analysisor re-examination <strong>for</strong> weeks/months.DrawbacksThis method is limited to analysis of thecate dinoflagelllatesonly. This means that other <strong>methods</strong> will have to be used ifthe rest of the <strong>phytoplankton</strong> community needs to be studied.Type of training neededA basic knowledge of light <strong>and</strong> epifluorescence microscopy isneeded. Analysis requires continuous training over years within-depth knowledge of taxonomic literature.Essential EquipmentEpifluorescence microscope with UV excitationFiltration unit incl. pump.Consumables, cost per sample**Less than 1-2 €/$1-2.Processing time per sample be<strong>for</strong>e analysisApp. 15 minutes <strong>for</strong> filtration <strong>and</strong> mounting of filter.Analysis time per sampleDepending on the number of species to be quantified <strong>and</strong> volumefiltered. A routine analysis of 5-10 species requires approx.15 min. per sample, excl. reporting/database h<strong>and</strong>ling ofresults.Sample throughput per person per day10-20.No. of samples processed in parallelOne per analyst.Health <strong>and</strong> Safety issuesAnalysis sitting at the microscope is tiresome <strong>for</strong> eyes, neck <strong>and</strong>shoulder. Frequent breaks are needed. The stain Calcoflour is<strong>for</strong> laboratory use only. Caution: Avoid contact <strong>and</strong> inhalation!The relevant health <strong>and</strong> safety guidelines should be followed.*service contracts not included**salaries not includedEquipment cost*20000-50000 US$ (see Appendix to this chapter <strong>for</strong> details).32
<strong>Microscopic</strong> <strong>and</strong> Molecular Methods <strong>for</strong> Quantitative Phytoplankton AnalysisChapter 5 Filtering - Calcofluor staining - <strong>quantitative</strong> epifluorescence microscopyFigure. 1. The filtration equipment used to concentrate <strong>phytoplankton</strong>on polycarbonate membrane filters <strong>for</strong> quantification usingepifluorescence microscopy.Sample preparationA known volume of sample, fixed using neutral Lugol’s iodine,is vacuum filtered using a polycarbonate filter with a poresize 5 µm (Fig. 1). Filters with larger or smaller pore sizes canbe used depending upon the organisms of interest.When approximatley 1 mL of sample is left in the filter chimney,0.2 mL (3-4 drops) of Calcofluor White M2R workingsolution is added <strong>and</strong> filtration is continued until the filter isdry (Table 2).Note that Calcofluor White M2R will only work at a neutralpH (= 7). In more acidic samples Calcofluor will precipitatewhich will interfere with the identificaiton <strong>and</strong> enumerationof dinoflagellate cells. If the sample is fixed using acidicLugol’s iodine, the sample must be neutralised prior to the additionof the Calcofluor. To achieve this, the filtration shouldbe stopped when there is approximatley 0.5 mL of sample leftin the filtration chimney. The filter should then be washed byadding approx. 2-5 mL of filtered seawater fixed in neutralLugol’s iodine. The filtration procedure is then continued asdescribed as described in Table 3.The dry filter should be mounted on top of a drop of paraffinoil on a microscope slide. Another drop of paraffin oil is thenplaced on top of the filter <strong>and</strong> a cover glass is mounted ontop of the paraffin oil (Fig. 2). The filter can then be analysedusing epifluorescence microscopy, using UV excitation (330-380 nm) <strong>and</strong> an appropriate emission filter (420 nm). Forroutine use an OLYMPUS BH-2 microscope equipped witha mercury lamp (100 W) or a similar microscope is appropriate.Thecate dinoflagellates can be identified <strong>and</strong> enumerated,either by counting the whole surface of the filter or selectedfractions of the filter surface. Large organisms (diameter >20Figure. 2. How to mount the polycarbonate filter on a slide <strong>for</strong>observation using epifluorescence microscopy.µm) such as cells from the genus Dinophysis, Prorocentrumor Alex<strong>and</strong>rium, can be counted using 100X magnification.Higher magnifications can be used when it is necessary to seethe morphology of the thecal plates to allow identification tospecies level.The prepared slides <strong>for</strong> <strong>quantitative</strong> analysis can be stored ina refrigerator (< 5ºC) <strong>for</strong> weeks with no/very little loss of cellsor fluorescence.Trouble shootingThe most frequent problems encountered when working withthe <strong>quantitative</strong> Calcofluor method are:1 The filter set on the epifluorescence microscope does notwork with Calcofluor White M2R;2 The pH of the sample to be analysed is not 7;3 The working solution of Calcofluor has precipitated <strong>and</strong> thesolution looks milky.Preservation <strong>and</strong> storageSamples to be analysed with this method should preferablybe fixed using neutral Lugol’s iodine. If samples are to be stored<strong>for</strong> more then a few days the samples should be stored inbrown glass bottles <strong>and</strong> stored in the dark. Samples storedaccording to these guidelines can be kept <strong>for</strong> months/years,however, it must be ensured that there is sufficient neutralLugol’s iodine in the sample to maintain the perservation.If the sample has the colour of weak tea there is sufficientLugol’s present. If the sample is clear, more neutral Lugol’siodine must be added.Counting procedure <strong>and</strong> calculation of concentrationsInitial analysis of the sample can be per<strong>for</strong>med using a lowmagnification such as 100X. The per<strong>for</strong>mance of the Cal-33
IOC Manuals & Guides no 55Chapter 5 Filtering - Calcofluor staining - <strong>quantitative</strong> epifluorescence microscopyTable 2. Summary of how to prepare samples preserved withneutral Lugol’s iodine <strong>for</strong> the <strong>quantitative</strong> epifluorescence methodusing Calcofluor White M2R.Figure 3. Dinophysis sp. stained with calcofluor as seen in the epifluorescencemicroscope. The cell height is approximately 50 µm.1. Measure the required sample volume using a graduatedcylinder;2. Add the sample to the filtration unit;3. Turn on the vacuum pump (maximum pressure = 200mmHg);4. Turn off the vacuum pump when there is approximately 1mL left in the filtration chimney;5. Add 3-5 drops of CalcoFluor working solution (concentration2 mg L -1 );6. Turn the vacuum pump on again <strong>and</strong> filter until the filtergoes dry;7. Remove the filter from the chimney <strong>and</strong> dry the back of itgently on a tissue to remove surplus water;8. Mount the filter on a drop of paraffin oil on a slide, addanother drop of paraffin oil on top of the filter <strong>and</strong> put on thecover slip (24 x 24mm);9. Observe your preparation using an epifluorescence microscope.cofluor stain must first be assessed by establishing that thethecate dinoflagellates light up blue on a dark background.After this has been checked, the sample analysis can be per<strong>for</strong>med.The counting strategy employed depends on the number ofcells on the filter. It is preferable to count the entire surface ofthe filter. If there are a high number of cells on the filter, subsamplingor counting only a fraction of the filter (half of thefilter surface or diagonals), can be per<strong>for</strong>med.Calculation of cell concentrations:To calculate the concentration (cells L -1 ) of the different speciesin your preparation you must know:V = Volume of sample concentrated on the filter (mL).B a= Area of the filter (mm 2 ).B c= Area of the part of the filter counted (mm 2 ).N = Number of cells counted <strong>for</strong> the species of interest.The conversion factor (CF):BCF =BThe concentration of the species C (cells mL -1 ) is then:CFC = N *VThe conversion factors must be calculated <strong>for</strong> each filteringunit <strong>and</strong> microscope as well as <strong>for</strong> each combination of subsamplingarea <strong>and</strong> magnification (Table 4).Examples of calculations of concentrations using the conversiontable are presented in Table 5.acTable 3. Summary of how to prepare samples preserved withacidic Lugol’s iodine, <strong>for</strong>maldehyde or gluteraldehyde <strong>for</strong> the<strong>quantitative</strong> epifluorescence method using Calcofluor White M2R.1. Measure the required sample volume using a graduatedcylinder;2. Add the sample to the filtration unit;3. Turn on the vacuum pump (maximum pressure = 200mmHg);4. Stop the filtration when there is about 1-0.5 mL left in thechimney;5. Wash the filter by adding approx. 2-5 mL of filtered seawaterfixed in neutral Lugol’s iodine <strong>and</strong> turn on the vacuumpump;6. Turn off the vacuum pump when there is approximatley 1mL left in the filtration chimney <strong>and</strong> add 3-4 drops of theCalcofluor working solution (concentration 2 mg L -1 );7. Turn on the vacuum pump again <strong>and</strong> filter until the filtergoes dry;8. Remove the filter from the chimney <strong>and</strong> dry the back of itgently on a tissue to remove surplus water;8. Mount the filter on a drop of paraffin oil on a slide, addanother drop of paraffin oil on top of the filter <strong>and</strong> put on thecover slip (24x24mm);9. Observe your preparation using an epifluorescence microscope.Table 4. Example of a calibration table used <strong>for</strong> calculating concentrationsof microalgae using epifluorescence microscopy (filterarea = 189 mm 2 . Note: CF is the conversion factor to be appliedwhen the count of cells in e.g. one diagonal window is to be calculatedto the concentration on the total filter surface.MagnificationWindow countWindow area (mm 2 )Diagonal window countDiagonal window area (mm 2 )40X 4.08 31.52100X 0.66 12.64200X 0.16 6.2CF: windowCF: diagonal window40X 46.3 6.04100X 286 15.1200X 1181 30.534
<strong>Microscopic</strong> <strong>and</strong> Molecular Methods <strong>for</strong> Quantitative Phytoplankton AnalysisChapter 5 Filtering - Calcofluor staining - <strong>quantitative</strong> epifluorescence microscopyTable 5. Examples of calculations of cell concentrations using theconversion table.Example 1 (counting the entire filter)Volume of sample concentrated on the filter = 100 mLCounts (entire filter area) = 50 Dinophysis acuminataCalculating cell concentration(50/100) = 0.5 cells mL -1 = 500 cells L -1Example 2 (counting one diagonal window)Volume of sample concentrated on the filter = 100 mLCounts (Diagonal window 100X) = 50 D. acuminataCF = 15.1Calculating cell concentration(50 x 15.1)/100 = 7.5 cells mL -1 = 7500 cells L -1DiscussionThe method described is excellent <strong>for</strong> the rapid processing ofsamples, <strong>for</strong> example as required in many toxic <strong>phytoplankton</strong>monitoring programmes. Low concentrations of thecatedinoflagellates are easily detected in the presence of high pelagicbiomass (e.g. diatoms). This is particularly relevant <strong>for</strong>concentrated net tow samples. It is possible to identify thecatedinoflagellates to species level because of the easy recognitionof the thecal plates of taxonomical importance which can notalways be recognised using the Utermöhl procedure usingLugol’s iodine preservation.Samples preserved with neutral Lugol’s iodine produce excellentslide preparations. There is no requirement to use moretoxic preservatives like <strong>for</strong>maldehyde or glutaraldehyde. Thefluorochrome Calcoflour White MR2 is considered to be oflow toxicity.Depending upon the organisms to be quantified, the describedmethod can easily be modified by using other filters suchas low cost glass fiber filters (GFC filters). Large <strong>and</strong> robustspecies e.g. from the genus Ceratium, occurring in low concentrations,can be investigated using large volumes of water(500 mL) <strong>and</strong> GFC filters with excellent results.The procedure can be used to separate auto- from heterotrophicthecate dinoflagellates on the basis of the presence orlack of chlorophyll <strong>and</strong> other pigments by switching betweenappropriate filter sets (Lessard <strong>and</strong> Swift 1986, Hallegraeff<strong>and</strong> Lucas 1988, Carpenter et al. 1991 ).It has been observed that species from the genus Alex<strong>and</strong>riumcan break/implode (maximum 10% of the cells) during samplepreparation. Breakage of cells appears to occur in caseswhere the filtration time is prolonged as a result of the filterblocking due to high sample biomass. This problem may becommon to all filtration based <strong>methods</strong>. It is strongly recommendedthat this problem be investigated more fully. It is suggestedthat the loss of cells can be minimised by adjusting thecombination of filter pore size <strong>and</strong> the volume of sample filteredthus reducing the total number of particles in the sample.When counting, one has to be aware that empty thecae(”ghost” cells) can be hard to distinguish from cells whichwere viable when sampled. When counting viable cells, the”ghost” cells can lead to a slight overestimation of the concentrationof viable cells. ”Ghost” cells can be confirmed by switchingbetween filter sets, e.g. to blue light excitation, whichwill reveal the cell content of the thecae under examination.The resulting high contrast between thecate dinoflagellates<strong>and</strong> the dark background common in this technique as well asthe lack of interference from other organisms such as diatomsmeans that this technique may be very useful in combinationwith image analysis to develop automated procedures <strong>for</strong>computerised identification <strong>and</strong> counting of specific thecatedinoflagellates.ReferencesAndersen P (1995) Design <strong>and</strong> Implementation of Harmful AlgalSome Monitoring Systems. IOC Technical Series No. 44Andersen P, Kristensen HS (1995) Rapid <strong>and</strong> presize identification<strong>and</strong> counting of thecate dinoflagellates using epifluorescence microscopy.In Harmful Marine Algal Blooms (Lassus PG, Arzul P,Gentian P. Marcaillou P eds) pp. 713-718. Lavoisier Publishing,ParisAndersen P, Sørensen HM (1986) Population dynamics <strong>and</strong> trophiccoupling in pelagic microorganisms in eutrophic coastal waters.Mar. Ecol. Prog. Ser. 33: 99-109Andersen P, Throndsen J (2004). Estimating cell numbers. In Hallegraeff,G. M., D. M. Anderson & A. D. Cembella (eds) Manualon Harmful Marine Microalgae. Monographs on OceanographicMethodology no. 11. p. 99-130. UNESCO PublishingCarpenter EJ, Chang J, Shapiro LP (1991). Green <strong>and</strong> blue fluorescingdinoflagellates in Bahamian waters. Mar. Biol. 108: 145-149Haas LW (1982). Improved epifluorescence microscopy <strong>for</strong> observingplanktonic microorganisms. Ann. L’Inst. Oceanogr.58(s):261-266Hallegraeff GM, Lucas I (1988). The marine dinoflagellate genusDinophysis (Dinophyceae): Photosynthetic, neretic <strong>and</strong> non-photosynthetic,oceanic species. Phycologia 27: 25-42Hobbie J E Daley R, Jasper S (1977) Use of Nuclepore filters <strong>for</strong>counting bacteria by fluorescence microscopy. Appl. Environ. Microbiol.33:1225-1228Lawrence F, Triemer RE (1985). A rapid simple technique utilizingCalcofluor White M2R <strong>for</strong> the visualization of dinoflagellate thecalplates. J. Phycol. 21: 662-664Lessard EJ, Swift E (1986) Dinoflagellates from the North Atlanticclassified as phototrophic or heterotrophic by epifluorescence microscopy.J. Plankton. Res. 8: 1209-1215Porter K, Feig YS (1980). The use of DAPI <strong>for</strong> identifying <strong>and</strong> countingaquatic microflora. Limnol. & Oceanogr. 25(5): 943-948Utermöhl H (1958) Zur vervollkomnung der <strong>quantitative</strong>n <strong>phytoplankton</strong>metodik. Mitt. int. ver. Limnol. 935
IOC Manuals & Guides no 55Chapter 5 Filtering - Calcofluor staining - <strong>quantitative</strong> epifluorescence microscopyAppendixTable 1. Equipment <strong>and</strong> costsItemPriceEpifluorescence microscope with UV excitation 20000-50000 US $Mercury burner100 US $/approx. 1200 samples, 0,08 US $/sampleFiltration unit incl. pump. 1000-1500 US $Polycarbonate filter0,5-1 US $/sampleCalcofluor (<strong>for</strong> a life time)50-100 US $/approx 5.000 samples, 0,02 US $/sampleNeutral Lugol´s (1 Litre)approx. 50 US $ /approx. 500 samples, 0,10 US $/sampleSlides <strong>and</strong> coverslips0,05 US $/sampleParaffin oil0,05 US $/sample36
<strong>Microscopic</strong> <strong>and</strong> Molecular Methods <strong>for</strong> Quantitative Phytoplankton AnalysisChapter 6 Filtering - semitransparent filters6 Filtering – semitransparent filters <strong>for</strong> <strong>for</strong> <strong>quantitative</strong><strong>phytoplankton</strong> analysisEinar Dahl & Lars-Johan Naustvoll*Institute of Marine Research, Flødevigen Marine Research Station, N-4817 HIS, Norway*Author <strong>for</strong> correspondence e-mail: larsjn@imr.noIntroductionPhytoplankton species such as large dinoflagellates are oftenpresent in the water column in low cell densities. Thus, samplesmust first be concentrated in order to accurately quantifythese species. One method <strong>for</strong> concentrating <strong>phytoplankton</strong>cells in water samples is the use of semitransparent membranefilters (Fournier 1978). In this method water samples are directlyfiltered on a membrane filter which then is placed underthe microscope <strong>for</strong> the identification <strong>and</strong> enumeration of<strong>phytoplankton</strong> cells.MaterialsLaboratory facilitiesNo specialised laboratory facilities are necessary <strong>for</strong> this method.Water samples using preservatives with potential harmfuleffects should be h<strong>and</strong>led following the appropriate health<strong>and</strong> safety procedures.EquipmentThe following equipment is required:• Compound light microscope, with at least 100X <strong>and</strong>200X times magnification.• Filter manifold <strong>and</strong> vacuum pump (h<strong>and</strong>pump or electric)with manometer to gauge the pressure.• Forceps <strong>for</strong> h<strong>and</strong>ling filters.Chemicals <strong>and</strong> consumablesThe following consumables are required:• Semitransparent membrane filter (e.g. PALL GN-6). Thefilters are availaible in a variety of diameters <strong>and</strong> pore sizes.A filter diameter of 25 mm <strong>and</strong> a pore size of 0.45µm is recommended <strong>for</strong> use in this method.• Glass microscope slides <strong>and</strong> coverslips.• Lugol’s iodine solution is recommended.• Glass bottles (dark) <strong>for</strong> sampling, transport <strong>and</strong> storageof water samples.MethodsThe recommended preparation procedure is as follows:1 The filtration manifold is assembled <strong>and</strong> the vacuumpump tested (Fig. 1);2 Using <strong>for</strong>ceps, the filter is placed in the filter holder. Thefunnel <strong>and</strong> holder are connected securely to prevent leakage;3 The preserved sample is gently agitated, by inverting thesample bottle at least 10 times;4 The volume to be filtered is measured using a graduatedcylinder. The most appropriate volume <strong>for</strong> analysis mayvary with location <strong>and</strong> time of year. Too many organismsFigure 1. Filtration manifold <strong>and</strong> h<strong>and</strong> held vacuum pump.on the filter will prevent the identification of some species.A guiding volume could be 25 mL <strong>for</strong> estuaries withhigh production, 50 mL <strong>for</strong> inshore stations <strong>and</strong> 100 mL<strong>for</strong> offshore stations;5 The contents of the graduated cylinder are transferredinto the funnel above the filter;6 A gentle vacuum is applied <strong>for</strong> filtration, less than 1/6atmosphere (125 mm Hg), using a h<strong>and</strong> or electric pumpwith manometer. A low vacuum pressure prevents destructionof <strong>and</strong> minimises distortion of fragile cells.7 Filtering continues until the filter is “dry”;8 The filter is removed from the filtration apparatus using<strong>for</strong>ceps <strong>and</strong> placed on a microscope slide;9 The slide is analysed using a compound light microscopeat the desired magnification. The concentration of <strong>phytoplankton</strong>is calculated based on the number of cellscounted on the whole filter <strong>and</strong> the volume of sampleinitially filtered.To calculate the concentration (cells L -1 ) of the different speciesin your preparation you must know:V = Volume of sample concentrated on the filter (mL).B a= Area of the filter (mm 2 ).B c= Area of the part of the filter counted (mm 2 ).N = Number of cells counted <strong>for</strong> the species of interest37
IOC Manuals & Guides no 55Chapter 6 Filtering - semitransparent filtersThe fundamentals ofThe filtering - semitransparent filters methodScopeConcentration <strong>and</strong> enumeration of <strong>phytoplankton</strong>, particularlylarge <strong>and</strong> more physically robust species.Detection range10-50 cells per Litre, depending on volume filtered.AdvantagesThis is a rapid <strong>and</strong> flexible method <strong>for</strong> the concentration of<strong>phytoplankton</strong> using st<strong>and</strong>ard easy to use laboratory equipment.The volume to be analysed can be easily adjusted dependingon cell density.DrawbacksFragile cells can be destroyed during the filtration process.Type of training neededNo special training is required <strong>for</strong> the preparation of samples.Taxonomic competence required <strong>for</strong> identification <strong>and</strong> enumeration.Essential equipmentCompound light microscope, filtration manifold, vacuumpump, <strong>for</strong>ceps, semitransparent filters <strong>and</strong> microscope slides.Equipment cost*Microscope: Depending on manufacturer <strong>and</strong> type, from 4000€ (6000 US $)Filtration manifold: from 250 € (320 US $)Vacuum pump: h<strong>and</strong> held from 180 € (240 US $)Consumables, cost per sample**Cost <strong>for</strong> filters <strong>and</strong> glass is approximately 1 € (1.5 US $).Processing time per samplePreparation time <strong>for</strong> the filters is 5 to 10 minutes, dependingvolume filtered, amount of <strong>phytoplankton</strong> <strong>and</strong> filtration volume.Analysis time per sampleAnalysis time is about 30 minutes <strong>for</strong> target species, dependingon skill, quantity of <strong>phytoplankton</strong> cells <strong>and</strong> number of targetspecies.Sample throughput per person per day10-12 samples per day.Health <strong>and</strong> Safety issuesSome fixatives that are used <strong>for</strong> <strong>phytoplankton</strong> preservationcould be potential harmful. Appropriate health <strong>and</strong> safety proceduresmust be followed at all times. Continual microscopework could result in strain injury. It is important to incorporatebreaks into the daily analyses time. Ergonomic adjustments tothe microscope <strong>and</strong> the working place is recomended.*service contracts not included**salaries not included38
<strong>Microscopic</strong> <strong>and</strong> Molecular Methods <strong>for</strong> Quantitative Phytoplankton AnalysisChapter 6 Filtering - semitransparent filtersFigure 2. Dinophysis sp. observed on a semitransparent filter.The conversion factor (CF):BCF =BThe concentration of the species C (cells mL -1 ) is then:The conversion factors must be calculated <strong>for</strong> each filteringunit <strong>and</strong> microscope as well as <strong>for</strong> each combination of subsamplingarea <strong>and</strong> magnification.Preservation <strong>and</strong> storageWater samples can be preserved with neutralised <strong>for</strong>maldehydeor neutral Lugol’s iodine solution. Formaldehyde shouldbe used with care because of its toxicity <strong>and</strong> potential to triggerallergic reactions. Neutral Lugol’s iodine solution is recommended<strong>for</strong> this method. If necessary, the brownish colorationof the algae caused by this preservative can be removedby oxidising the Lugol’s iodine using a few drops of sodiumthiosulfate per mL (3 g Na 2S 2O 3in 100 mL water). Whenusing Lugol’s iodine solution the water samples should be storedin dark glass bottles in the dark. Samples should retain thecolour of ‘weak tea’. The fixation of archived samples shouldbe checked every third month <strong>and</strong> additional Lugol’s iodineshould be added if the sample has lost its colouration. Properlyfixed samples can last <strong>for</strong> years with appropriate maintenance.Once a sample has been filtered it should be analysed immediately.It is possible to store samples <strong>for</strong> one day, but thismay impede taxonomic identification. If samples are to bestored the filter should be kept moist. A drop of filtered seawatershould be added to the filter on the microscope slide.A cover slip should be placed on top of the filter <strong>and</strong> gentlypressed downward. The microscope slide is then placed in therefrigerator to reduce any evaporation. If the filter has drieda new drop of seawater should be added without lifting thecover slip prior to analysis of the sample on the microscope.acCFC = N *VFigure 3. Rhizosolenia sp. observed on a semitransparent filter.DiscussionFiltering with semitransparent filters is a rapid method <strong>for</strong>concentrating <strong>phytoplankton</strong> samples be<strong>for</strong>e enumeration usinglight microscopy. It is a flexible method as the volume filteredcan be easily altered depending on the target species <strong>for</strong>analysis. The detection limit can be improved by increasingthe volume filtered. The equipment needed <strong>for</strong> this concentrationmethod is st<strong>and</strong>ard laboratory equipment <strong>and</strong> relativelyinexpensive to purchase.The main advantage of using the filtration method is theshort h<strong>and</strong>ling time from when the water sample arrives inthe laboratory to when it is analysed. The pore size of thefilters determines the size of the cells retained. If only a definedsize fraction of the <strong>phytoplankton</strong> is of interest, usingfilters with a specific pore size could be advantageous as thisreduces the amount of background non target particles. Theequipment needed <strong>for</strong> the method is in most cases relativelystraight<strong>for</strong>ward, compact <strong>and</strong> easy to use in the field.The method has some disadvantages compared to other<strong>methods</strong>. Some difficulties may arise in the taxonomic characterisationof <strong>phytoplankton</strong> cells on filters as they cannot bephysically manipulated to change their orientation to allowbetter examination of morphological features. Any non r<strong>and</strong>omdistribution on the filter could interfere with the resultsif only a portion of the filter is analysed. The main disadvantageof this method is that cells can become distorted, ordestroyed during the filtration process. This method is notrecommended <strong>for</strong> fragile <strong>and</strong> delicate <strong>phytoplankton</strong> species,e.g. Haptophytes <strong>and</strong> Chrysophytes, since these species wouldbe unidentifiable after the treatment. The semitransparent filtermethod favours the more robust species, e.g. diatoms <strong>and</strong>thecate dinoflagellates (Figs. 2 <strong>and</strong> 3).ReferencesFournier RO (1978) Membrane filtering. In: Sournia, A (ed)Phytoplankton manual. Monographs on oceanographic methodology6, Unesco, Paris, p. 108-11239
<strong>Microscopic</strong> <strong>and</strong> Molecular Methods <strong>for</strong> Quantitative Phytoplankton AnalysisChapter 7 Filter - transfer - freeze7 The filter - transfer - freeze method <strong>for</strong> <strong>quantitative</strong><strong>phytoplankton</strong> analysisAllan Cembella* 1 <strong>and</strong> Cheryl Rafuse 21Alfred Wegener Institute <strong>for</strong> Polar <strong>and</strong> Marine Research, Am H<strong>and</strong>elshafen 12, D-27570 Bremerhaven, Germany2Institute <strong>for</strong> Marine Biosciences, National Research Council of Canada, 1411 Ox<strong>for</strong>d Street, Halifax, Canada*Author <strong>for</strong> correspondence: Allan.Cembella@awi.deIntroductionPrecise <strong>and</strong> accurate identification <strong>and</strong> enumeration of <strong>phytoplankton</strong>cells in field samples is fundamental to the maintenanceof time-series data on distribution <strong>and</strong> abundanceof taxa, as well as <strong>for</strong> biological oceanographic research <strong>and</strong>plankton surveillance programmes, e.g. <strong>for</strong> harmful algalblooms. Such counting <strong>methods</strong> are also required <strong>for</strong> cell enumerationin unialgal or multialgal cultures <strong>for</strong> laboratory ormesocosm experiments on <strong>phytoplankton</strong>. In this sense, theterm “<strong>phytoplankton</strong>” is used loosely to include all eukaryoticmicroalgae, protists, cyanobacteria <strong>and</strong> unicellular benthic<strong>and</strong> epiphytic taxa, including cysts <strong>and</strong> other resting stages.Both “classical” <strong>methods</strong> based upon microscopic observationsof morphological features of whole cells <strong>and</strong> <strong>molecular</strong><strong>methods</strong> (nucleic acid hybridisation, antibodies, lectins, etc.)are now available <strong>for</strong> comparison (Godhe et al. 2007).Although the filter-transfer-freeze (FTF) technique is consideredamong the classical approaches <strong>for</strong> cell counting <strong>and</strong>identification, it is not specifically a cell enumeration method,but rather a means of cell concentration, collection,<strong>and</strong> transfer <strong>for</strong> counting by alternative means. When appliedcorrectly, the accuracy <strong>and</strong> reproducibility of cell countsper<strong>for</strong>med by the FTF technique is more a function of thesubsequent counting <strong>and</strong> identification <strong>methods</strong> than of theFTF procedure itself. The FTF method was introduced morethan two decades ago (Hewes <strong>and</strong> Holm-Hansen 1983), butin spite of its simplicity <strong>and</strong> proven effectiveness, the methodhas not been widely employed. This is regrettable because theFTF method can be applied <strong>for</strong> both critical taxonomy (withsome caveats) <strong>and</strong> <strong>for</strong> rapid but superficial analysis of <strong>phytoplankton</strong>samples. The original method was designed withrespect to nanoplankton <strong>and</strong> indeed appears to work best <strong>for</strong>taxa in the size range of ca. 5 – 200 µm diameter. Smaller cellstend to get lost to the filter <strong>and</strong> larger organisms do not transferwell. Nevertheless, this size-range embraces most of thediatoms <strong>and</strong> nanoflagellates of interest <strong>and</strong> chain-<strong>for</strong>mationdoes not markedly decrease transfer efficiency from the filterto slide. The method has been rigorously tested <strong>for</strong> use infield monitoring of <strong>phytoplankton</strong> in the Gulf of St. Lawrenceregion of Atlantic Canada (J. Smith <strong>and</strong> K. Pauley, Dept.of Fisheries <strong>and</strong> Oceans, Canada, unpublished manual) <strong>and</strong>in comparison with alternative <strong>methods</strong> <strong>for</strong> counting cells incultures of the marine dinoflagellate genus Alex<strong>and</strong>rium (Rafuse2004). Consolidation of the methodological variants inthis chapter may assist in wider dissemination of this ratherneglected method <strong>for</strong> <strong>phytoplankton</strong> cell enumeration.MaterialsEquipment• Electric or manual vacuum pump (preferably with vacuumgauge)• Filtration apparatus (funnel, clamp, frit, rubber stopper,connecting rubber or Tygon tubing) – single or multipleas required• Vacuum trap flask (if connected to electric pump)• Waste disposal flask (<strong>for</strong> filtered fixatives/preservatives)• Freezer (-20 ˚C), dry ice or cold block (prefrozen)• Digital or mechanical cell counter (optional)• Research microscope equipped with bright-field, phasecontrastor Normarski optics• St<strong>and</strong>ard glass microscope slides• Glass cover slips (24 x 24 or 24 x 50 mm)• Watch glass• Polycarbonate membrane filters (25 mm); Poretics orNuclepore (pore size: 3 µm or dependent upon sizedistribution of taxa of interest)• Pasteur pipettes with rubber bulb• 0.5 or 1.0 l plastic squirt bottle• Millipore-type flat <strong>for</strong>ceps• Grease pencil (optional)• Source of filtered (0.22 µm) seawater• Fixatives/preservatives (if desired)• 95% or 70% ethanol (<strong>for</strong> cleaning)Laboratory facilitiesThe FTF method <strong>and</strong> subsequent microscopic analysis requireno sophisticated facilities. The technique can be per<strong>for</strong>medeven in a rudimentary “laboratory”, at dockside or on boardship, if a means of quick freezing of the slide is available. Inthe absence of a laboratory freezer, the slide can be frozenupon dry ice, liquid nitrogen (carefully!) or upon an aluminumor plastic cold block that has been prefrozen at -20 to-80 ˚C <strong>and</strong> maintained in a well-insulated container. The ba-Figure 1. Filtration <strong>and</strong> vacuum apparatus used in the FTF method.41
IOC Manuals & Guides no 55Chapter 7 Filter - transfer - freezeThe fundamentals ofThe filter - transfer - freeze methodScopeAppropriate <strong>for</strong> fixed, labelled, or unfixed planktonic chain-<strong>for</strong>mingor unicellular organisms.Detection rangeDetection range is dependent on the volume filtered. Best precision<strong>and</strong> counting accuracy is achieved with transfer of 200– 400 cells per taxon of interest to the slide surface.AdvantagesCan be applied <strong>for</strong> enumeration of cells prepared with a varietyof different preservation <strong>and</strong> labelling <strong>methods</strong> or from freshsamples. The method can accommodate alternative microscopictechniques: bright field, phase-contrast, Normarski, <strong>and</strong>epifluorescence <strong>methods</strong>. The preparation is extremely simple<strong>and</strong> rapid (minutes) <strong>and</strong> is limited only by the filtration time.DrawbacksPotential loss of cells in the transfer process <strong>and</strong> some morphologicaldistortion of delicate specimens is possible. The filtration<strong>and</strong> microscopic method is normally applied serially, i.e. onesample at a time, although in principle multiple filtration funnelscould be used to filter samples in parallel. Other limitationsof the method are generic to all optical microscopic techniques(resolution limit, operator error in identification, etc.).Type of training neededOnly a simple practical demonstration of the filtration <strong>and</strong>transfer method is required – this method can be mastered in60,000 € <strong>for</strong> a fully equippedresearch microscope with Normarski or epifluorence capabilities.Consumables, cost per sample**Less than 2 €/2 US $ (determined mostly by the cost of thefilter).Processing time per sample be<strong>for</strong>e analysisVaries with the volume of water filtered, but typically
<strong>Microscopic</strong> <strong>and</strong> Molecular Methods <strong>for</strong> Quantitative Phytoplankton AnalysisChapter 7 Filter - transfer - freezeadvantage <strong>for</strong> corralling the cells on the slide;2 Mount a polycarbonate membrane filter (25 mm diameter)onto the the filtration apparatus <strong>and</strong> ensure that thefilter remains centred when clamping or threading the filtrationfunnel (Fig. 1);3 Filter a suitable volume of plankton sample (must be determinedempirically after initial trials <strong>and</strong> rough counting oftaxa of interest) under gentle vacuum (
IOC Manuals & Guides no 55Chapter 7 Filter - transfer - freeze2 A drop or two of filtered seawater can be useful in seatingthe filter on the filter apparatus. Make sure the filter is alwaysmounted in the same orientation, usually shiny-sideup <strong>for</strong> most types (but check!);3 It is not usually feasible to count more than a few hundredcells of a given taxon on a single slide, but counts must besufficiently high (see Andersen <strong>and</strong> Throndsen 2004) toavoid having to count many replicate slides <strong>for</strong> statisticalvalidity. The sample must be thoroughly homogenised inthe bottle by a gentle end-to-end <strong>and</strong> side-to-side rollingmotion between the h<strong>and</strong>s be<strong>for</strong>e filtration;4 A wet filter will result in the loss or mobilisation of cells onthe filter as it is removed from the funnel. This is likely tobe the largest source of error in the method. On the otherh<strong>and</strong>, sucking the filter under high vacuum to completedryness or <strong>for</strong> a prolonged time will embed the cells in themembrane <strong>and</strong> they will not transfer efficiently from thefilter;5 Make sure that there are no pleats or folds in the filter <strong>and</strong>that the entire surface is in good contact with the slide;6 Per<strong>for</strong>m a cursory examination of the upper filter surface<strong>for</strong> residual cells that were not transferred. This can bedone quickly with a stereo-microscope or a st<strong>and</strong>ard microscopeunder low power (40X). If more than a few cellsare present, the filtration procedure must be repeated;7 This procedure is designed <strong>for</strong> immediate observation ofspecimens without archiving. Techniques <strong>for</strong> preparingsemi-permanent mounting <strong>and</strong> embedding with variouspreparations of glycerol <strong>and</strong> embedding medium <strong>for</strong> latertaxonomic analysis may be consulted in Hewes <strong>and</strong> Holm-Hansen (1983);8 Either of two techniques can be used <strong>for</strong> placing the coverslip: 1) gently lowering one end of the coverslip until contactis made with the water droplet, then letting surfacetension act as the cover slip is lowered at an angle; or 2) the“bombardier principle”, whereby the cover slip is droppedgently from just above the water droplet. Take care to avoidbubbles under the coverslip.Preservation <strong>and</strong> storageThe FTF method can be applied to microscopic analysis ofplankton samples directly from seawater, since filtration firstimmobilises <strong>and</strong> quick-freezing kills the cells. Cells frozen tothe filter may be stored in the freezer <strong>for</strong> several hours (or evenovernight) without apparent damage or effect on subsequenttransfer. Nevertheless, <strong>for</strong> archival purposes, fixation <strong>and</strong>/orpreservation of cells may be desired to reduce decomposition<strong>and</strong> to maintain morphology <strong>for</strong> future identification <strong>and</strong>enumeration. Aldehyde preservatives affect steric configurationby cross-linking of proteins via multiple interaction withvarious amino acid residues <strong>and</strong> even peptide bonds (Shi et al.2000), whereas ethanol is a coagulant fixative causing limited<strong>and</strong> unstable cross-linkages. Although exhaustive comparativetrials have not been conducted specifically <strong>for</strong> the FTF method,all commonly used preservatives <strong>and</strong> fixatives (Keller <strong>and</strong>Manak 1993, Amann 1995, Cañete et al. 2001), includingLugol’s iodine solution, <strong>for</strong>mulation of gluteraldehyde, <strong>for</strong>malinor para<strong>for</strong>maldehyde (PFA) in various buffer solutions,as well as saline-ethanol mixtures <strong>for</strong> application of <strong>molecular</strong>probes are generally compatible with this method.Details of fixation <strong>and</strong> preservation are beyond the scope ofthis chapter, but a few general observations here with respectto the FTF method are relevant. Lugol’s iodine solution hasbeen traditionally used to preserve microalgae <strong>for</strong> counts viaUtermöhl settling chamber method (see Chapter 2, this volume)<strong>and</strong> as such can be employed also <strong>for</strong> the FTF technique.The disadvantages of this solution are that it stronglycolours cells so that autotrophic <strong>and</strong> heterotrophic cells cannoteasily be distinguished <strong>and</strong> cells cannot be readily stained<strong>for</strong> epifluorescence microscopy. Decolourisation (i.e. withthiosulphate) is possible but often results in a loss of morphologicaldetails <strong>and</strong> even cell lysis. Lugol’s solution is particularlyeffective with highly silicified structures, e.g. mostdiatoms <strong>and</strong> silicoflagellates, but less so <strong>for</strong> naked <strong>and</strong> thecateflagellates <strong>for</strong> which details are often obscured.Gluteraldehyde is excellent <strong>for</strong> fixation <strong>and</strong> preservation ofstructures, particularly <strong>for</strong> subsequent analysis by SEM orTEM, but is relatively expensive <strong>and</strong> highly toxic. Use ofgluteraldehyde is there<strong>for</strong>e discouraged <strong>for</strong> the FTF method,which does not usually yield the highest quality samples <strong>for</strong>electron microscopy in any case. Other aldehydes fixatives arepreferred, <strong>for</strong> a compromise preservation of siliceous, calcareous<strong>and</strong> cellulosic structures of <strong>phytoplankton</strong>. Acidic <strong>for</strong>malinpreparations can be very destructive to calcareous structures,such as those of coccolithophorids.A high quality universal preservative <strong>for</strong> most <strong>phytoplankton</strong>samples based upon buffered para<strong>for</strong>maldehyde (PFA) hasbeen extensively tested with the FTF method. This <strong>for</strong>mulationstabilises most cell structures <strong>and</strong> provide a robust resistanceto filtration <strong>and</strong> freeze-thaw damage. The recipe isthere<strong>for</strong>e given here as follows:Preparation of 10% PFA:1 Add 100 g of PFA powder to 800 mL dH 2O (or a suitablebuffer);2 Heat to about 60-80 ºC with constant magnetic stirring;3 Add NaOH (1N) gradually until PFA is just completelydissolved (do not add too much!);4 Let the solution cool to room temperature5 Adjust to desired pH using NaOH or HCl (1N);6 Add H 2O (or buffer) to make up to 1000 mL.For most plankton samples, acidity should be adjusted to pH4 <strong>and</strong> final concentration in the sample should be 1 – 2%.Thereafter, samples can be archived <strong>for</strong> many months prior tofiltration <strong>for</strong> FTF microscopic analysis.DiscussionThe FTF technique has some of the advantages <strong>and</strong> drawbacksof other filtration-based techniques. Nevertheless, theproblems cited <strong>for</strong> direct counting of cells upon filters (morphologicaldistortion of cells, poor contrast, low resolution,difficulty in applying stains, etc.) (Hewes <strong>and</strong> Holm-Hansen1983) are effectively eliminated in the FTF method. Relativeto other classical counting <strong>methods</strong>, such as the Uter-44
<strong>Microscopic</strong> <strong>and</strong> Molecular Methods <strong>for</strong> Quantitative Phytoplankton AnalysisChapter 7 Filter - transfer - freezemöhl settling chamber method, the FTF technique has theadvantage that there is no time-lag <strong>for</strong> sedimentation, withattendant concerns about physical disturbance of the settingregime (e.g., on board ship). Counts can be per<strong>for</strong>med with ast<strong>and</strong>ard research microscope rather than with a less commoninverted optical system. As a cell concentration <strong>and</strong> transfertechnique, the FTF method can be successfully combinedwith other <strong>methods</strong> <strong>for</strong> critical taxonomy by epifluorescencemicroscopy, such as the calcofluor staining method <strong>for</strong> thecellulose plates of dinoflagellates, or application of fluorescenceprobes <strong>for</strong> nucleic acids or antibody targets. In the fluorescenceapproach, the appropriate stains can be applied at theedge of the cover slip <strong>and</strong> drawn across the sample by applyinga laboratory tissue at the opposite corner of the cover slip.Furthermore, FTF preparation time is only a few minutes,with filtration as the rate-limiting step. This makes it easy toadjust the cell concentration on the counting slide <strong>for</strong> optimalaccuracy <strong>and</strong> precision of counting (typically 200 - 400cells per taxon of interest) by varying the volume filtration orby diluting the sample with filtered seawater. The latter maybe important to avoid cell overlap, e.g. of diatom chains, orclumping of aggregated cells, particularly of concentrated netplankton hauls.As with other filtration-based techniques, the physical lossor damage of cells must be carefully monitored during thepreparation procedures. Sloppy filtration techniques, leakageof the filtration funnels, overloading the filter <strong>and</strong> failure tothoroughly clean the filtration apparatus with detergent betweenusages, followed by rinsing with ethanol then deionisedwater between each sample, can cause cell loss. Sometimes thesample may leak outside of the grease chalk circle <strong>and</strong> there<strong>for</strong>emay not be counted; <strong>for</strong> this reason it is often preferableto eliminate this circle <strong>and</strong> merely count the entire surfacearea under the cover slip.In comparative testing of the FTF method against whole-cellfluorescence in situ hybridization (FISH) <strong>and</strong> the Utermöhlsettling chamber <strong>methods</strong> <strong>for</strong> counting cultured cells of themarine dinoflagellates Alex<strong>and</strong>rium tamarense <strong>and</strong> A. ostenfeldii(Rafuse 2004), the filtration-based <strong>methods</strong> yielded aconsistently higher coefficient of variation, most of which wasattributed to variable cell loss. Yet in a detailed comparison of17 alternative cell counting <strong>methods</strong> <strong>for</strong> A. fundyense (Godheat al. 2007), the FTF method exhibited among the lowestst<strong>and</strong>ard errors among replicate counts (n = 4 or 5) within theconcentration range of 102 to 105 cells L -1 . During the filtrationstep, cells can be lost within the filtration apparatus, i.e.between the funnel <strong>and</strong> base or via leakage from the interfacebetween the filter holder <strong>and</strong> the filter. All st<strong>and</strong>ard funnel filtrationapparatus (Fig. 1), such as the common clamp-systemsobtainable from Millipore, Gelman/Pall, Sartorius,etc., are acceptable <strong>for</strong> this method, including the threadedmounting (Radnoti-type) systems <strong>for</strong> attaching the funnelto the filter base. The clamp-type systems are preferable becausethey are simpler <strong>and</strong> do not permit the possible loss ofcells between the O-rings (Rafuse 2004) that may occur <strong>for</strong>threaded-type filter systems. Evidence of this cell loss fromconcentrated samples may be observed by visual inspectionof the funnels <strong>and</strong> other components after the filter is removed.Use of glass versus plastic (polystyrene) funnels does notappear to be critical, but the funnels should be transparentto observe the filtration process. To maximize transfer of allcells to the filter, the filtration should proceed until the filtersurface is just dry (i.e. the upper surface is no longer shiny),but not beyond this point, to preserve cell integrity. Dirty apparatus<strong>and</strong> ultra-slow filtration (5% of cells under a worst case scenario<strong>and</strong> often taxonomically biased towards mucilaginouscells or aggregates. In any case, this selective loss from theharvested sample can be verified if necessary by thoroughlywashing down the walls of the funnel system with a highpressurestream of filtered seawater from a squirt bottle <strong>and</strong>recovering the cells on a fresh filter under gentle vacuum. Iffew cells are found, loss of cells in the system can be assumedto be minimal.Breakage of cells upon contact with the filter surface, <strong>and</strong> especiallysucking the filter beyond the dry point under high vacuumcan also account <strong>for</strong> considerable cell loss or distortionin all filter-based <strong>methods</strong>. For this reason, vacuum pressureshould be kept low (
IOC Manuals & Guides no 55Chapter 7 Filter - transfer - freezechem 103: 117-126Godhe A, Cusack C, Pedersen J, Andersen P, Anderson DM, BresnanE, Cembella A, Dahl E, Diercks S, Elbrächter M, Edler L,Galuzzi L, Gescher C, Gladstone M, Karlson B, Kulis D, LeGresleyM, Lindahl O, Marin R, McDermott G, Medlin MK, NaustvollL-J, Penna A, Töbe K (2007) Intercalibration of classical <strong>and</strong><strong>molecular</strong> techniques <strong>for</strong> identification of Alex<strong>and</strong>rium fundyense(Dinophyceae) <strong>and</strong> estimation of cell densities. Harmful Algae 6:56-72Hewes D, Holm-Hansen, O (1983) A method <strong>for</strong> recovering nanoplanktonfrom filters <strong>for</strong> identification with the microscope:the filter-transfer-freeze (FTF) technique. Limnol Oceanogr 28:389–394Keller GH, Manak MM (1993) DNA probes. Second Edition,Stockton Press, New York, USARafuse C (2004) Effects of physiological <strong>and</strong> environmental conditionson rRNA probes <strong>for</strong> two species of microalgae, Alex<strong>and</strong>riumostenfeldii <strong>and</strong> A. tamarense. MS dissertation, Dalhousie University,Halifax, CanadaShi S-R, Gu J, Taylor CR (eds) (2000) Antigen retrieval techniques:immunohistochemistry <strong>and</strong> <strong>molecular</strong> morphology. Eaton Publishing,Natick, MA, USA46
<strong>Microscopic</strong> <strong>and</strong> Molecular Methods <strong>for</strong> Quantitative Phytoplankton AnalysisChapter 8 Imaging flow cytometry - FlowCAM8 Imaging flow cytometry <strong>for</strong> <strong>quantitative</strong><strong>phytoplankton</strong> analysis — FlowCAMNicole J. Poulton* 1 <strong>and</strong> Jennifer L. Martin 21J.J. MacIsaac Aquatic Cytometry, Facility Bigelow Laboratory <strong>for</strong> Ocean Sciences, 180 McKown Point Road, P.O. Box 475 West BoothbayHarbor, ME 04575, USA2Fisheries <strong>and</strong> Oceans Canada Biological Station, 531 Br<strong>and</strong>y Cove Road, St. Andrews, NB E5B 2L9, Canada*Author <strong>for</strong> correspondence: npoulton@bigelow.orgIntroductionIn water quality analysis <strong>and</strong> monitoring the ability to count,capture <strong>and</strong> save images of the particles or organisms in a sampleis advantageous. Traditional “particle counting” <strong>methods</strong>,such as microscope particle analysis, can be slow <strong>and</strong> tedious.The FlowCAM, an imaging flow cytometer developed byFluid Imaging Technologies, captures digital images of particlesin a fluid stream using laser light detection, enabling themeasurement of many cell parameters, such as length, width,equivalent spherical diameter <strong>and</strong> fluorescence (Sieracki et al.1998). The captured images from a sample can be studied visuallyas well as post-processed by a computer to automaticallysearch <strong>for</strong> particles of a certain type or class. The FlowCAMdetects <strong>and</strong> measures fluorescence emissions at two differentwavelengths, typically red <strong>and</strong> orange fluorescence, indicatingthe presence of chlorophyll or phycoerythrin within the individualparticles/cells in a field sample. This technology is verysimilar to a flow cytometer that captures only fluorescence<strong>and</strong> scatter properties of a particle. However, the FlowCAMmerges the technologies of a flow cytometer <strong>and</strong> an imagingmicroscope – resulting in the Flow Cytometer <strong>and</strong> Microscope(FlowCAM – Fig. 1). The FlowCAM automatically counts<strong>and</strong> images particles or cells in a discrete sample. Using theimage analysis data generated during sample processing, theFlowCAM software uses image libraries previously created bythe user of target groups or classes that can assist in analysis<strong>and</strong> classification. Overall, the FlowCAM can be customisedto accommodate most field environments <strong>and</strong> can be usedto detect <strong>and</strong> quantify different algal groups within a sample(Zarauz et al. 2009), including harmful algal species (Buskey<strong>and</strong> Hyatt 2006).MaterialsEquipmentFor <strong>quantitative</strong> micro<strong>phytoplankton</strong> analysis (20-300 μm)a Benchtop or Portable FlowCAM (VS IV) is required (Figs2 & 3). The FlowCAM must be equipped with either a blue(488 nm) or green laser (532 nm) <strong>for</strong> fluorescent <strong>and</strong> particledetection. In addition the instrument should have <strong>and</strong>be setup with, a 4X or 10X objective depending on the size ofthe cells to be visualised <strong>and</strong> quantified. Each objective mustuse a corresponding rectangular. tubular glass Flow Cell (100or 300 µm depth) in which all cells are to be analysed. For discretevolume sampling a funnel st<strong>and</strong> or pipet tip apparatusmust be used, as provided with the instrument.Chemicals <strong>and</strong> consumables• Filtered Seawater (FSW)• Distilled waterFigure 1. Illustration of the fluidics <strong>and</strong> optics of the FlowCAM.• Calibration Beads (5, 10, 20, 50 & 100 µm)• Disposable plastic pipets tips (1-10 mLs)• Small funnels• FlowCAM Flow Cells (100 or 300 µm depth)• Silicone Tubing• Nylon mesh (100 or 300 µm)• Graduated cylinders to measure volumes to be processedSolutions <strong>for</strong> preservation• 10% buffered <strong>for</strong>malin solution (see Appendix 1 <strong>for</strong> preparationinstructions)• Formalin: Acetic acid (see Appendix 1)MethodsThe FlowCAM was originally developed <strong>for</strong> <strong>phytoplankton</strong>detection <strong>and</strong> quantification <strong>and</strong> is ideally suited <strong>for</strong> analysisof natural field samples that contain specific groups or speciesof microplankton that are usually counted using traditionalmicroscopic techniques. To begin, the FlowCAM (includingthe integrated computer) <strong>and</strong> laser need to be turned on, <strong>and</strong>the laser allowed to warm up <strong>for</strong> approximately 20 minutes(according to FlowCAM manual). FlowCAMs are equippedwith either a green or blue laser; both can be used <strong>for</strong> algalfluorescence detection. As the FlowCAM laser is warming47
IOC Manuals & Guides no 55Chapter 8 Imaging flow cytometry - FlowCAMThe fundamentals ofThe FlowCAM - maging flow cytometer methodScopeThe FlowCAM method captures digital images of particles <strong>and</strong>/or cells. This enables the instrument to measure cell abundance<strong>and</strong> many cell parameters, such as length, width, equivalentspherical diameter <strong>and</strong> fluorescence.Detection rangeThe detection range depends on the volume of sample analysed.AdvantagesManual labour required <strong>for</strong> processing <strong>and</strong> h<strong>and</strong>ling is minimised,compared to traditional microscopy techniques. Themethod produces a non-biased digital record <strong>and</strong> instantaneousimage analysis data on every particle or cell within a sample.The captured images from a sample can be studied visually aswell as post-processed by a computer to search <strong>and</strong> quantifycells of a certain type or class. Portable FlowCAMs are also available<strong>for</strong> field measurements.DrawbacksCells are required to have a distinct morphology to be readilyidentified by FlowCAM. Different objectives are needed <strong>for</strong>different <strong>phytoplankton</strong> size ranges. Preservation of the sampleis not recommended, live samples are optimal, as cell autofluorescencecan decline or is removed with certain preservationtechniques (ie. Utermohls). Heavy particle loads (riverine orestuaries) could interfere with image capture – dilution of thesample <strong>for</strong> accurate abundances may be required.Type of training needed1. To use FlowCAM: Approximately one-two days of trainingwould be required with guidance from a trained individual <strong>and</strong>follow-up support.2. To troubleshoot <strong>and</strong> QC: A more experienced analyst withup to 6 months experience would be more effective at troubleshootingthe instrument. The company that manufactures theFlowCAM, Fluid Imaging Technologies, provides on-site, webbased,<strong>and</strong> over the phone customer assistance when needed.3. Taxonomic expertise is required to interpret images <strong>and</strong> results.Essential EquipmentFlowCAM VS IV with 4X & 10X objectives, associated VisualSpreadsheet(ViSp) software, <strong>and</strong> Flow Cells.Equipment cost*$75,000-85,000 US (depends on the model – Benchtop or Portable),see Appendix 2.Consumables, cost per sample**1-5 US dollars.Processing time per sample be<strong>for</strong>e analysisRanges from 15 minutes-1 hour depending on the volume run<strong>and</strong> particle density.Analysis time per sampleRanges from 1 hour to minutes. The time consuming part isidentifying cells <strong>and</strong> developing image libraries <strong>for</strong> automatedsample analysis (hours of time upfront).Sample throughput per person per day4-36 depending on the time of run <strong>and</strong> analysis time.No. of samples processed in parallelOne sample at at time.Health <strong>and</strong> Safety issuesMinimal, caution <strong>and</strong> general safety practices must be usedwhen using the laser within the instrument <strong>and</strong> preserved samples.*service contracts not included**salaries not included48
<strong>Microscopic</strong> <strong>and</strong> Molecular Methods <strong>for</strong> Quantitative Phytoplankton AnalysisChapter 8 Imaging flow cytometry - FlowCAMTable 1. Recommended cell size range (diameter) <strong>and</strong> objectives<strong>for</strong> different FlowCAM Flow Cells.Cell Size Range Objective Flow Cell Flow CellDimensions(Depth x Width)10 µm – 100 µm 10 X FC100 100 µm x 2 mm20 µm – 300 µm 4 X FC300 300 µm x 3 mm60 µm – 600 µm 4 X FC600 600 µm x 6 mmFigure 2. Benchtop FlowCAM.Figure 3. Portable FlowCAM (VS IV).up, the FlowCAM VisualSpreadsheet (ViSp) software can bestarted.Be<strong>for</strong>e running natural field samples, the FlowCAM needs tobe ”setup”, meaning the values <strong>for</strong> triggering using fluorescentdetection (thresholds) <strong>and</strong> the cell size range of particlesto be collected need to be determined. The FlowCAM alsoneeds to be properly focused, similar to how a microscopewould work. In order to get good visualisation of the particlesin each sample optimal focus is required. The set up processusually takes between 20-40 minutes. Once the settings <strong>for</strong>microplankton detection are determined the settings do notchange between samples, unless the ecosystem or backgroundwithin a sample (such as particle load) changes. More detailson how to set up the instrument can be found in the Flow-CAM Operators Manual (Anonymous 2009).For analysing <strong>and</strong> counting microplankton in natural fieldsamples 4X, 10X or 20X objective are usually used in combinationwith an appropriate Flow Cell (Table 1). The FlowCell is a rectangular glass tube that can vary in size dependingon the objective used. Silicone tubing is affixed to bothends <strong>and</strong> allows the sample to pass through the tube to a peristalticpump downstream of the Flow Cell. The Flow Cellmimics the glass side of a microscope. Note that the FlowCell is oriented vertically in the instrument differing from themicroscope mounted slide that is positioned horizontally. Installationof a 100 µm depth Flow Cell is described in Fig. 4.Data Acquisition1 Each field sample needs to be thoroughly mixed by gentlerotation to resuspend any particles that may have settled;2 Using a graduated cylinder, a predetermined volume ofeach sample is dispensed into a funnel or pipet tip;3 Set the ViSp FlowCAM software to start analysis <strong>and</strong> collectthe data (file folder name <strong>and</strong> location) in Triggermode;4 Start the peristaltic pump, once data acquisition in theViSp FlowCAM software begins the sample will now beanalysed <strong>for</strong> fluorescent events (<strong>phytoplankton</strong>) that passby the laser that is aligned with the Flow Cell.For most field samples, between 10-100 mL of each sampleis analysed <strong>and</strong> processed. Sample processing rate (flow rate)will depend on the density of cells in the field sample, <strong>and</strong>the dimensions of the Flow Cell used. As a starting point, setthe st<strong>and</strong>ard VWR pump to fast mode <strong>and</strong> the speed dial to5. As the sample is flowing through the Flow Cell, check thefluorescence trigger rate using ”Trigger Mode Setup”. If theimages are appearing at a rate more than one per second beginto turn down the flowrate of the pump until the optimumlevel is attained. In somes cases the micro<strong>phytoplankton</strong> concentrationwill be low <strong>and</strong> there will appear to be no triggerevents. The user should be aware that increasing the flowratetoo much (PRIME mode) may cause image distortion <strong>and</strong>prevent accurate image capture. To test the fluorescence settings(thresholds) of the FlowCAM it is recommended that adiluted <strong>phytoplankton</strong> culture (100-1000 fold) be used initiallyto verify the settings being used. It is essential that theFlow Cell <strong>and</strong> funnel are rinsed throughly afterwards to preventcontamination of subsequent samples to be quantified<strong>and</strong> analysed. Typically, a field sample can be processed in30-40 minutes.During the run, the operator should occasionally mix thesample in the funnel using a pipette to prevent particles orcells from settling. The operator should also check the FlowCell <strong>for</strong> any potential clogs or blockages. If clogging occurs,the user would typically observe particles sitting at the entranceto the glass tubing. If a clog occurs the operator shouldend the run <strong>and</strong> restart the analysis. To prevent clogging fromoccurring, screening or sieving the sample prior to analysisis recommended using nylon mesh (100 or 300 µm) dependingon the depth of the Flow Cell being used. During a runthe operator should also periodically pinch the tubing downstream of the Flow Cell in order to prevent large particlesfrom blocking the entrance to the Flow Cell. Near the endof a run the funnel should be rinsed with FSW to ensure allparticles are removed from the funnel (<strong>and</strong> have entered the49
IOC Manuals & Guides no 55Chapter 8 Imaging flow cytometry - FlowCAMStep 1. Remove the CH300 Flow Cell Holder from the FocusingCollar by loosening the thumb screw <strong>and</strong> pulling the FlowCell Holder away from the focusing rails. Loosening the thumbscrew is accomplished by turning the screw counter-clockwise.The 10X objective can be replaced with a 4X objective.Step 2. Unscrew the retaining cap from the Flow Cell Holder.This is accomplished by turning the cap counterclockwise untilit separates from the Flow Cell Holder.Step 3. For some FlowCAM models the CH300 Flow Cell Holderhas a backer ring (previously installed) that needs to beadjusted when using the 100 μm depth flow cell. The backerring can be moved by crossing your index <strong>and</strong> middle fingers<strong>and</strong> inserting them into the inside diameter of the ring. Move thering in or out until it backs the flow cell achieving a good fit whenthe Flow Cell Holder cap is tightened.Step 4. Place a 100 μm Flow Cell into the pre-cut notches of theFlow Cell Holder. Ensure that the inlet tube is at the same endas the thumb screw. The silicone tubing has been previouslyattached to the Flow Cell.Step 5. Reinstall the retaining cap onto the Flow Cell Holderby turning the cap counter-clockwise. The cap is significantlytightened when the Flow Cell cannot be moved. The user willhave to hold the Flow Cell straight as cap tightening will tend totwist the Flow Cell. Caution – overtightening will break the 100μm Flow Cell.Step 6. Re-install the Flow Cell Holder onto the Focusing Collar<strong>and</strong> tighten the thumb screw. Connect the inlet tube of the FlowCell to the sampling funnel using the funnel st<strong>and</strong> apparatus.Step 7. Connect the outlet tubing to the fluid pump (peristalticpump). Ensure the effluent tube is connected to an appropriatewaste container. Once the 100 μm Flow Cell has been installedthe Flow Cell needs to be thoroughly rinsed with filtered seawater(FSW) <strong>and</strong> the fluid level brought to the neck of the funnel.Figure 4. Installation of a 100 μm depth Flow Cell.50
<strong>Microscopic</strong> <strong>and</strong> Molecular Methods <strong>for</strong> Quantitative Phytoplankton AnalysisChapter 8 Imaging flow cytometry - FlowCAMFigure 5. Representative black <strong>and</strong> white FlowCAM images from afield sample containing the following genera, Dinophysis, Alex<strong>and</strong>rium,Protocentrum <strong>and</strong> Ceratium.Flow Cell) be<strong>for</strong>e it runs dry. Preventing air from entering theFlow Cell between samples will prevent tiny bubbles from<strong>for</strong>ming that could be detected as particles <strong>and</strong> imaged in thenext sample. Any clogs can be removed by reversing the pumpdirection or inverting the Flow Cell <strong>and</strong> rinsing with FSW ordistilled water.Data AnalysisEach fluorescent particle/cell is digitally acquired <strong>and</strong> archivedby the FlowCAM ViSp software (Fig. 5). Analysis of thesamples is done either immediately upon completion of thesample acquisition or at a later timeconcentratafter manyionsamples(havebeen acquired or archived. The ViSp software allows the operatorto use previously acquired image libraries of target speciesor organisms to assist in sample analysis. The librariesare user generated <strong>and</strong> can be created from images obtainedfrom cultured organisms or from positively identified naturalfield images of the target organism. The libraries allow theoperator to pattern match each field sample by filtering <strong>and</strong>sorting the data into user defined catagories. This procedurecan be repeated <strong>for</strong> different target organisms within a singlesample or multiple samples. Once the analysis is completed,the positively identified images are verified by the operator,<strong>and</strong> a total count of each class or group is determined. Thefinal cell concentration of each class is determined using anequation that includes the cell count, volume analysed <strong>and</strong>Flow Cell Factor – see Formula <strong>for</strong> Calculating Results below.companies (10-100 µm, Duke Scientific, USA). To verify theFlowCAM calibration refer to the FlowCAM Operators Manual<strong>for</strong> a detailed step by step protocol.Preservation <strong>and</strong> storageUnpreserved samples are ideal <strong>for</strong> quantifying <strong>and</strong> analysingmicro<strong>phytoplankton</strong> in the field, <strong>and</strong> is recommended. However,this is not always appropriate. Preservation of samplesshould be done using a 10% buffered <strong>for</strong>malin solutionor <strong>for</strong>malin:acetic acid, such that the final concentration isapproximately 1-2%. Preserved samples should be processedas soon as possible, as fluorescence detection is essential <strong>for</strong>accurate cell detection <strong>and</strong> enumeration. Chlorophyll fluorescencewithin the cell decreases with prolonged storage.Preserved samples are best analyzed using Auto Image Mode,to assure accurate <strong>phytoplankton</strong> counts. However, more processingtime is required in this mode in order to analyze anadequate sample volume. If longer preservation is required,the effects of the storage length should be tested on the Flow-CAM prior to processing samples on a routine basis.Formulas <strong>for</strong> calculating resultsTo determine the concentration of the target microplanktongroup or species within a sample three values are needed:1 The volume processed by the FlowCAM;2 The cell count of the target group (based on classification)(N);3 The Flow Cell Factor.⎛ Cell count ( N ) ⎞=⎜Volume of sample ( mL)⎟⎝⎠−1⎛ Cell count ( N ) ⎞Cell cells mL ) =⎜* Flow Cell FactorVolume of sample ( mL)⎟⎝⎠−1Cell concentrat ion ( cells mL )*Since the camera on the FlowCAM can only visualise a portionof the Flow Cell (usually between 33-95% - dependingon the objective <strong>and</strong> Flow Cell used) the Flow Cell Factortakes into account the portion of the field of view that is notvisualised by the FlowCAM. The Flow Cell Factor will varydepending on the objective/Flow Cell combination utilised.The Flow Cell Factor is calculated automatically by the ViSpsoftware once the correct dimensions of the Flow Cell usedare provided by the user. Note that Fluid Imaging Technologieshas recently developed a new Flow Cell design that eliminatesthe need <strong>for</strong> Flow Cell Factor.DiscussionCalibrationPrior to micro<strong>phytoplankton</strong> sample analysis, the FlowCAMneeds to be properly calibrated using an optical micrometer.The micrometer is used to measure the field-of-view of thecamera <strong>for</strong> each magnification objective (4x & 10x), enablingan accurate size calibration <strong>for</strong> each pixel. This ”calibrationfactor” becomes part of the context settings <strong>for</strong> each magnification.Prior to shipment, a new FlowCAM is calibratedto assure accurate measurements of particle concentration(particles/mL) <strong>and</strong> <strong>for</strong> sizing particles. Although no in-fieldcalibration is required, a FlowCAM user can analyse polystyreneor latex beads (of known size) <strong>for</strong> calibration assurance.Calibration beads can be purchased at a variety of commercialThe ability to automate the detection <strong>and</strong> counting ofmicro <strong>phytoplankton</strong> in field samples is a huge advantage<strong>for</strong> monitoring aquatic systems. With the development ofmore automated techniques, such as the FlowCAM there isa movement to employing more remote automated monitoringtechniques. The FlowCAM, with further development,could assist in water quality monitoring <strong>for</strong> both marine <strong>and</strong>freshwater environments. The FlowCAM is ideally suited <strong>for</strong>quantifying micro<strong>phytoplankton</strong> between 20-300 µm in size(however, smaller <strong>and</strong> larger particles can also be detected).Cell classification using the FlowCAM ViSp software is bestused on species/groups of <strong>phytoplankton</strong> that have uniquecell characteristics, such as cell size, shape or colour. For ex-51
IOC Manuals & Guides no 55Chapter 8 Imaging flow cytometry - FlowCAMample, the genera Dinophysis, Ceratium, <strong>and</strong> Chaetoceros havemany distinctive morphological features which are easier toclassify than different species within the genus Alex<strong>and</strong>rium.The FlowCAM is best used to examine a wide range of specieswithin one sample. It can be used as a monitoring tool <strong>for</strong>coastal projects or in the laboratory, processing discrete sampleswhen needed. In order to best evaluate the instrument alist of Advantages <strong>and</strong> Disadvantages of the FlowCAM methodare provided below:Advantages of the FlowCAM Method1 The amount of manual labour required <strong>for</strong> sample processing<strong>and</strong> h<strong>and</strong>ling is greatly reduced when using aFlowCAM <strong>for</strong> micro<strong>phytoplankton</strong> analysis. For discretesample analysis (as described in this chapter) the operatoris required to set up <strong>and</strong> begin a run, but will only occasionallymonitor the FlowCAM when it is running <strong>and</strong>detecting particles;2 The FlowCAM records a “non-biased” digital record ofevery particle/cell within a specific size range (determinedby the operator) <strong>for</strong> further analysis using the FlowCAMViSp software. Using traditional microscope techniques,the operator scans the slide <strong>and</strong> either seeks out the particles/cellsof interest or identifies all the observed cells onthe slide. This may result in a biased analysis <strong>and</strong> count ofa sample (which depends on the operator’s attention to detail<strong>and</strong> identification knowledge). The data generated bythe FlowCAM is archived <strong>and</strong> can be reanalysed by moreskilled individuals when problems arise or when differentanalyses are required;3 In addition to capturing an image <strong>for</strong> each particle detectedby the FlowCAM, the software provides instant imageanalysis on each particle , up to 30 different image parameters.For example, particle length, width, equivalentspherical diameter (ESD), area-based spherical diameter(ABD), fluorescence, time of flight <strong>and</strong> aspect ratio aresome of the the primary data measurements obtained. Giventhe data provided, the operator can develop specificalgorithms or use previously determined algorithms fromthe literature <strong>for</strong> values of interest such as bio-volume <strong>and</strong>Carbon:Chlorophyll ratio depending on the needs of theapplication or project;4 The FlowCAM is portable. Even the benchtop model hasa relatively small foot-print (100 x 70 cm) <strong>and</strong> can be usedin the lab or at sea on board ships. The image capture systemprevents problems usually associated with vibration;5 The FlowCAM allows <strong>for</strong> the visualisation <strong>and</strong>/or detectionof a wide particle size range (1 µm – 1 mm equivalentspherical diameter). To detect across this large size range aseries of objectives <strong>and</strong> flow cells would need to be used.Based on the size of the target organism to be detected(<strong>for</strong> example, Alex<strong>and</strong>rium), a 10 X objective with a 100µm depth flow cell would be used. To examine smaller orlarger particles within a sample, other objectives <strong>and</strong> flowcell combinations may need to be used.Disadvantages <strong>and</strong> Drawbacks1 In terms of cell identification it is essential to achieve thebest possible focus, otherwise the images will be blurry <strong>and</strong>will be difficult to analyse;2 Depending on the ecosystem that is being analysed the<strong>phytoplankton</strong> cell size range may vary greatly. Each objective<strong>and</strong> Flow Cell size that can be used has a minimum<strong>and</strong> maximum cell size range that’s possible (similar to thelimitations of microscopy). There<strong>for</strong>e, to best identify all<strong>phytoplankton</strong> within a given sample, two FlowCAM runsmay be required at two different magnifications. This dependson what magnification is acceptable <strong>for</strong> cell identification.If cells are too large to pass through the FlowCell clogging may occur. There<strong>for</strong>e, method developmentat the beginning of a particular project is important. However,if only one particle/cell size is required <strong>and</strong> cellidentification is not necessary– one FlowCAM run may besufficent;3 A limited number of preservation techniques <strong>for</strong> <strong>phytoplankton</strong>detection using fluorescent based triggering canbe used. To assure accurate cell concentrations using preservedsamples Auto Image Mode is recommended, butmore processing time is required (1-2 hours). The bestmethod of preservation is 1-2% final concentration <strong>for</strong>malin.Preserved samples should be stored cold <strong>and</strong> in thedark. Prior to processing let the samples acclimate to roomtemperature. Lugol’s iodine or other iodine based preservation<strong>methods</strong> are not recommended <strong>for</strong> use with the Flow-CAM as the fluorescence of the particles is lost <strong>and</strong> thehigh contrast of the images makes it difficult to identifydifferent <strong>phytoplankton</strong> groups/genera;4 In situations where cold samples are being analysed in highhumid environments (<strong>for</strong> example, samples of deep waterbeing analysed on board ships), condensation on the flowcell may interfere with particle detection. The solution tothis problem is to allow the sample to attain room temperatureprior to analysis. The sample should be preservedprior to manipulation;5 When the particle load is very high as in riverine samplescontaining high concentrations of detritus, more than oneparticle may be captured in a single field of view on the camerausing Trigger Mode. Although each particle will havedifferent image analysis values, such as particle length,width, ESD etc., the fluorescent value of both particles willbe the same. It is also possible to capture “non-fluorescent”material if the particle load (sediment) is too high <strong>and</strong> theinstrument is detecting particles in fluorescent detectionmode. In these cases, Auto Image Mode could be utilised;6 The operator or user should have some knowledge of <strong>phytoplankton</strong>identification <strong>for</strong> analysis of the FlowCAMdata.52
<strong>Microscopic</strong> <strong>and</strong> Molecular Methods <strong>for</strong> Quantitative Phytoplankton AnalysisChapter 8 Imaging flow cytometry - FlowCAMType of training required to operate a FlowCAM1 To per<strong>for</strong>m sample analysis: Approximately one-two daysof training would be required with guidance from a trainedindividual <strong>and</strong> follow-up support;2 To troubleshoot <strong>and</strong> QC: A more experienced analystwith up to 6 months experience would be more effectiveat troubleshooting the instrument. The company thatmanufactures the FlowCAM, Fluid Imaging Technologiesprovides on-site, web-based, <strong>and</strong> over the phone customerassistance when needed.AcknowledgementsWe would like to thank the support of Fluid Imaging Technologieswho kindly provided assistance <strong>and</strong> pictures, specifically,Harry Nelson, Brian Thompson, Jonathan Villeneuve,Gerald Brown <strong>and</strong> Doug Phinney. We also thank MurielleLeGresley <strong>for</strong> comments <strong>and</strong> suggestions to the manuscript.ReferencesAnonymous (2009). FlowCAM Operators Manual, Fluid ImagingTechnologies, Inc., March 2009 Revision 0109.Buskey, E . <strong>and</strong> Hyatt CJ (2006) Use of the FlowCAM <strong>for</strong> semiautomatedrecognition <strong>and</strong> enumeration of red tide cells (Kareniabrevis) in natural plankton samples. Harmful Algae 5:685-692Sieracki CK, Sieracki M <strong>and</strong> Yentsch CS (1998) An imaging-in-flowsystem <strong>for</strong> automated analysis of marine microplankton. MarineEcology Progress Series 168: 285-296Zarauz L, Irigoien X, <strong>and</strong> Fern<strong>and</strong>es JA (2009) Changes in planktonsize structure <strong>and</strong> composition, during the generation of a<strong>phytoplankton</strong> bloom in the central Canatabrian sea. Journal ofPlankton Research 2: 193-207Appendix 1Preparation of a Buffered Para<strong>for</strong>maldehyde/Formalin SolutionMaterialsPara<strong>for</strong>maldehyde powder1N NaOHStirring/hot plateChemical fume hoodpH meterPhosphate buffer ed saline (PBS) or filtered seawaterDistilled H 2OG/F filters1 Mix 900 mL distilled water <strong>and</strong> 100 g para<strong>for</strong>maldehyde powder;2 Set up on a stirring/hot plate under hood. Heat to approximately 60ºC. Do not boil;3 Stir <strong>for</strong> approx 1 hour. Turn off heat;4 Add 100 μL 1N NaOH to “clear” solution. Cool to room temperature. Note: In some cases, not all the para<strong>for</strong>maldehyde will go intosolution;5 Add 100 mL phosphate buffered solution or filtered seawater. , depending on whether the samples are freshwater or marine;6 Filter through GF/F filter to remove precipitate;7 Test pH. Should be 7.4 - 8.0 (approx. equal to seawater);8 If necessary, add more NaOH.This yields a 10% solution (approximately).Preparation of a Formalin: Acetic Acid SolutionMaterialsFormaldehyde (37%)Concentrated acetic acid1 Mix equal parts of <strong>for</strong>maldehyde <strong>and</strong> acetic acid;2 Using this solution, add 2.5 mL per 100 mL of sample.53
IOC Manuals & Guides no 55Chapter 8 Imaging flow cytometry - FlowCAMAppendix 2Table 1. Equipment <strong>and</strong> costs..Equipment Supplier Cat. Number € US $FlowCAM ® VS IV Fluid Imaging Technologies VS IV or portable VS IV 53,760 80,000(FIT), USA50um Flow Cell FIT, USA FC50 28 41100um Flow Cell FIT, USA FC100 19 28300um Flow Cell FIT, USA FC 300 19 28Nylon Mesh Wildco, USA www.wildco.com 24-C27 (53 µm)89 13224-C34 (100 µm)24-C48 (300 µm)Silicone Tubing (1.6mm ID)Cole Palmer, USA K-06411-62 12 18Calibration BeadsDuke Scientific, USAwww.dukesci.com4205A (5 µm diameter)4210A (10 µm diameter)4220A (20 µm diameter)4250A (50 µm diameter)4310A (100 µm diameter)623 927Plastic Pipets VWR, USA 14670-103 36 53Mini-funnelHutzler Manufacturing801 0.67 1www.usplastic.comPara<strong>for</strong>maldehyde VWR, USA MK262159 38 56Sum approx. 54,536 81,28454
<strong>Microscopic</strong> <strong>and</strong> Molecular Methods <strong>for</strong> Quantitative Phytoplankton AnalysisChapter 9 Whole cell hybridisation assays9 Detecting intact algal cells with wholecell hybridisation assaysKerstin Töbe* 1 , David Kulis 2 , Donald M. Anderson 2 , Melissa Gladstone 3 , <strong>and</strong>Linda K. Medlin 41Alfred Wegener Institute <strong>for</strong> Polar <strong>and</strong> Marine Research Am H<strong>and</strong>elshafen 12. D-27570 Bremerhaven, Germany2Biology Department, MS #32, Woods Hole Oceanographic Institution, Woods Hole, MA 02543, USA3Cawthron Laboratory Services, Cawthron University, Private Bag 2, Nelson, New Zeal<strong>and</strong>4Observatoire Océanologique de Banyuls-sur-Mer, Laboratoire Arago, 66651 Banyuls-sur-Mer, France*Author <strong>for</strong> correspondence e-mail: Kerstin.Toebe@awi.deIntroductionFluorescence in situ Hybridisation (FISH)Ribosomes are the sites <strong>for</strong> protein synthesis in all cells. Allcells are packed with many ribosomes because protein synthesisis an on-going cellular process. Each ribosome is composedof ribosomal RNAs (rRNAs) <strong>and</strong> accompanying proteins.The RNAs within the ribosome fold into a shape that permitsthe synthesis of the proteins <strong>and</strong> this folding of the moleculeis maintained <strong>for</strong> proper functioning of the ribosome. If mutationsoccur that violate the folding of the molecule, then themolecule is non-functional. Within the interior of the foldedRNA is the conserved sequence regions. These cannot changeotherwise the molecule will not fold properly. The more variableregions of the RNA molecule are found on the surface ofthe molecule which do not interfere with the folding of themolecule. Thus, based upon conserved <strong>and</strong> variable regions ofthe rRNA, signature base sequences of varying taxonomic specificitycan be found (Fig. 1). In other words, regions can beidentified in the rRNAs that will recognise all members fromas broad a group as a kingdom of organisms or be so selectiveto identify only a species or cluster of strains in that species.These short sequences have been used to develop probes <strong>for</strong>the identification of organisms at various taxonomic levels.Given the vast amount of rapidly accumulating sequence data<strong>for</strong> all kinds of organisms, it is now possible to develop theseprobes <strong>for</strong> a broad spectrum of taxa. When these probes arecoupled with a fluorescent marker, the target organism canbe easily identified by a technique known as Fluorescence insitu Hybridisation (FISH). Fluorescence in situ hybridisationenables the rapid detection of different species or strains(Amann 1995). This technique has been successfully applied<strong>for</strong> the detection of harmful algae (Anderson 1995, Miller<strong>and</strong> Scholin 1996, 2000, John et al. 2003, Anderson et al.2005) as well as algal classes (Simon et al. 1997, 2000, Rhodeset al. 2004a, 2004b, Eller et al. 2007) <strong>and</strong> other taxonomichierarchies (Groben et al. 2004, Groben <strong>and</strong> Medlin 2005,Töbe et al. 2006).Basic Principles of FISHThe target algal cells are hybridised with fluorescently (e.g.the fluorochrome fluorescein isothiocyanate; FITC) labelledoligonucleotide probes, which bind to the complementarytarget sequence of the rRNA in the ribosomes (Fig. 2). Thisresults in a bright labelling of the entire algal cell because ofthe high target number of ribosomes in cells (Figs. 2-4). A listof all algal probes can be found on the EU PICODIV (Diversityof Picoeukaryotic Organisms) website (http://www.sb-roscoff.fr/Phyto/PICODIV/). In each RNA molecule themore conserved positions can be used to develop taxonomicprobes e.g. on a class level, whereas the variable regions areused <strong>for</strong> lower taxonomic levels.Initially, the cells are fixed with a preservative that actuallymakes the cell membrane permeable <strong>for</strong> the entry of theprobe into the cell. The fluorescently labelled probe finds itsway to the ribosome <strong>and</strong> binds to the region of the rRNAto which it is complementary, <strong>for</strong>ming a duplex. When thesample is viewed under a fluorescent microscope using lightof the correct wavelength, the fluorochrome is excited <strong>and</strong>the cell of interest can easily be visualised. The three <strong>methods</strong>described in this chapter all incorporate these basic principlesof FISH; however, there are slight variations in their protocolsFigure 1. Variability map of the 18S rRNA molecule. Source:Bioin<strong>for</strong>matics.psb.ugent.be.55
IOC Manuals & Guides no 55Chapter 9 Whole cell hybridisation assaysThe fundamentals ofThe fluorescent in situ hybridisation (FISH) methodScopeDetection <strong>and</strong> quantification of target <strong>phytoplankton</strong> species.Detection rangeDetection of microalgal RNA by FISH is very sensitive. Thenumber of cells that can be detected depend on the sample volume.High biomass can obscure the view of target cells.AdvantagesRelatively inexpensive if appropriate fluorescence micrsocopyfacilities are available. Visible observation of cells is possible.Simple <strong>and</strong> easy to use. Sample volumes can easily be adjusted.Simultaneous labeling <strong>and</strong> detection of multiple species is possible.DrawbacksProbes are only available <strong>for</strong> a limited number of target species.Rigorous optimisation <strong>and</strong> specificity testing on local strains isrequired be<strong>for</strong>e the method can be implemented. Finite storagetime <strong>for</strong> samples. Processing procedure may result in cell loss.Relatively expensive start-up costs. Intensity of the positivereaction may vary with cell conditions. Access to <strong>molecular</strong> expertiseis essential. Appropriate laboratory facilities <strong>for</strong> storage<strong>and</strong> processing of probes <strong>and</strong> reagents are necessary.Type of training neededInstruction in setting up this technique should come from aperson with an in-depth knowledge <strong>and</strong> experience of <strong>molecular</strong>biology. Approximately one week of supervised trainingrequired to properly per<strong>for</strong>m the method.Essential EquipmentEpifluorescence microscope, filtration unit, hybridisation oven,various air displacement pipettes, vacuum pump.Equipment cost*Total set-up cost = 20000 € (30000 US $)See Appendix, Table 1 <strong>for</strong> details.Consumables, cost per sample**Cost per sample = 1.67 € (2.50 US $). See Appendix, Table 2<strong>for</strong> details.Processing time per sample be<strong>for</strong>e analysisIn total ca. 4 hours per sample. This excludes fixation timewhich is 1-24 hours.Analysis time per sample<strong>Microscopic</strong>al analysis 45 minutes to 2.5 hours/sample.Sample throughput per person per dayA trained person can process <strong>and</strong> count 16 or more samples/day.No. of samples processed in parallelNumber of samples processed in parallel: 14-24 (dependentupon manifold capacity).Health <strong>and</strong> Safety issuesFormamide, <strong>for</strong>malin, methanol <strong>and</strong> DAPI are hazardouschemicals. Proper safety guidelines should be employed whenusing them - lab coat, eye protection <strong>and</strong> gloves are required.Disposal of all waste products should follow prescribed laboratoryprocedures. Continual microscope work could result instrain injury. It is important to incorporate breaks into the dailyanalyses time. Ergonomic adjustments to the microscope <strong>and</strong>the working place is recommended.*service contracts not included**salaries not included56
<strong>Microscopic</strong> <strong>and</strong> Molecular Methods <strong>for</strong> Quantitative Phytoplankton AnalysisChapter 9 Whole cell hybridisation assaysABThe strongest positive signal from the target organism <strong>and</strong>lowest cross reactivity from non-target organisms will definethe optimal assay conditions <strong>for</strong> the probe.MaterialsFigure 2. Micrographs of Alex<strong>and</strong>rium fundyense cells using theFISH method: A FISH with FITC-labelled probe NA1 (Miller <strong>and</strong>Scholin 1998); B Negative control, no probe. 400X.Laboratory FacilitiesThis method can be used in laboratories <strong>and</strong> on board researchvessels.Required Equipment (essential)The whole cell method requires the following equipment:• Epifluorescence microscope• Filtration manifold• Hybridisation oven or water bath with thermometer• Air displacement pipettes (10 µL – 10 mL)Equipment, Chemicals <strong>and</strong> ConsumablesThe equipment, chemicals <strong>and</strong> consumables used in thismethod are presented in the Appendix, Tabels 1-2 at the endof this chapter. Suppliers, catalogue numbers <strong>and</strong> estimatedcost in Euros <strong>and</strong> US Dollars <strong>for</strong> the year 2007 are also listedin Appendix.MethodFigure 3. Fluorescence in situ hybridisation with Alex<strong>and</strong>riumfundyense cells with Cy3-labelled probe NA1. Note the autofluorescenceof the dinoflagellate cells of the genera Dinophysis <strong>and</strong>Ceratium in the background (arrows) 200X.ABFigure 4. In-Stu Hybridisation with Alex<strong>and</strong>rium ostenfeldii cells: AFISH with FITC-labelled probe Aost (John et al. 2003). B Negativecontrol, no probe. 400X. Cawthron laboratory.that offer the user various advantages depending upon theirspecific sample requirements. Optimisation of the FISH assayis required <strong>for</strong> each new probe/probe set <strong>and</strong> should involvetesting a matrix of conditions including:• Hybridisation buffer - 1X, 5X, respectively, depending onthe protocol used. Set buffer <strong>and</strong> if required, 5% intervalsof <strong>for</strong>mamide concentrations. See Appendix, Table 3 <strong>for</strong>more details on how to make up the different buffers• Hybridisation length - longer hybridisation times can resultin non-specific binding• Hybridisation temperature - low temperatures can causenon-specific binding <strong>and</strong> temperatures that are too highmay inhibit binding• Hybridisation wash buffer <strong>and</strong> wash duration – thesesteps influence the intensity of the target label as well thedegree of non-specific labellingThree different fluorescence in situ hybridisation(FISH) <strong>methods</strong> are presented. Method 1 <strong>and</strong> 3 usethe LSU probe, NA1, recognising the North AmericanAlex<strong>and</strong>rium ribotypes (Alex<strong>and</strong>rium fundyense/catenella/tamarense) 5’-Fluor/AGTGCAACACTCCCACCA-3’ (Anderson et al. 1999). In method 2 another LSU probe,NA2, which also discriminates North American ribotypeswas used: 5’-Fluor/ AACACTCCCACCAAGCAA -3’ (Johnet al. 2003). This probe has a 5 bp (base pair) shift of NA1sequence to avoid the hair pin loop that this probe makeswith itself that might reduce its hybridisation ability at lowtemperature.Methods 1-3 below are variations of the FISH assay using Alex<strong>and</strong>riumfundyense as the target organism. Each method differsslightly according to different personal preferences withregards to some of the equipment used, preservation <strong>methods</strong><strong>and</strong> the hybridisation protocol (see Table 1 <strong>for</strong> more details).With the appropriate filtration set, many samples can beprocessed in parallel. Samples in <strong>methods</strong> 1 <strong>and</strong> 2 can be easilyfiltered overnight <strong>for</strong> processing in the morning with probehybridisation. It is preferable that no significant delays occurduring the sample processing steps when using method3. With any of the <strong>methods</strong>, the hybridisation takes approximately2 hours <strong>and</strong> the filters can be enumerated thereafter.The number of samples to be processed <strong>and</strong> counted will varywith each worker; the majority of time is devoted to microscopicexamination of the sample. The time spent on eachsample varies depending upon the target cell density, the concentrationof non- target cells, detrital matter <strong>and</strong> countingmethod employed. The reader is referred to chapter 14 onthe laser scanning cytometer to avoid personal examinationof the filters.57
IOC Manuals & Guides no 55Chapter 9 Whole cell hybridisation assaysTable 1. Summary of the differences, advantages <strong>and</strong> disadvantages between the three <strong>methods</strong> discussed in this chapter.Differences between <strong>methods</strong> Advantages DisadvantagesMethod 1 Method 2 Method 3Fixative Saline ethanol Saline ethanol Formaldehydewith methanolextractionHybridisation buffer5X or 1X SetBuffer5X SET Buffer withFormamideFormaldehyde/methanolallows long term storageof samples (> 1 year @-20 ºC)Saline ethanol is nothazardous5X SET Buffer withFormamideWash buffer 1X Set Buffer 1X Set Buffer 0.2X Set buffer Method 1 does not requirea separate wash solution<strong>for</strong> dinoflagellates.Equipment Water bath Hybridisation oven Hybridisation oven Water bath is not veryexpensiveA hybridisation oven iseasy to useUse of hazardouschemicals <strong>and</strong> an extracentrifugation stepUse of an hazardouschemicalA water bath iscumbersome to work withA hybridisation oven ismore expensiveMethod 1MaterialsSolutions <strong>for</strong> Fixatives• Modified Saline Ethanol Solution (Miller <strong>and</strong> Scholin2000; see Appendix, Table 3 <strong>for</strong> details).This fixative is stable at room temperature <strong>for</strong> several monthswithout precipitate <strong>for</strong>mation. Note: 300 mL of fixative issufficient <strong>for</strong> approximately 70 reactions. The modified salineethanol does not <strong>for</strong>m precipitates <strong>and</strong> can be made inadvance, whereas the unmodified version with a higher ethanolconcentration <strong>for</strong>ms precipitates <strong>and</strong> should be made justbe<strong>for</strong>e use.• 25X SET buffer (discard after 12 months; see Appendix,Table 3 <strong>for</strong> details)Solutions <strong>for</strong> Fluorescence in situ HybridisationThe hybridisation buffer concentration needs to be optimised<strong>for</strong> each probe set (see the discussion in ‘Basic Principles ofFISH’).• 1X SET buffer (used <strong>for</strong> dinoflagellates from the generaKarenia <strong>and</strong> Alex<strong>and</strong>rium; see Appendix, Table 3 <strong>for</strong> details)or• 5X SET buffer (used <strong>for</strong> diatoms from the genus Pseudonitzschia;see Appendix, Table 3 <strong>for</strong> details)• Mix solutions into a baked 500 mL Duran bottle <strong>and</strong>filter through a 0.45 µm filter. Add 1 mL Polyadenalyicacid (12.5 mg mL -1 , Sigma Chemical, P-9403)• Wash buffer: 1X SET buffer (see Appendix, Table 3 <strong>for</strong>details) in sterile Milli-Q waterProbesProbes are received as a dried powder <strong>and</strong> need to be made upto a concentration of 200 ng µL -1 i.e. 50 µg of probe in 250µL of 1X TE buffer, pH 7.8- 8.0. Make sure all equipmentis RNase free <strong>and</strong> the area is in dim light. Divide into 50 µLaliquots <strong>and</strong> store at 4 ºC. Probes stored this way will remainstable <strong>for</strong> 4 months, otherwise, samples need to be lyophilised<strong>and</strong> stored at -80 ºC <strong>for</strong> long term storage.Additional Equipment• Milleriser Rig (includes tubes, bases, o-rings, lids)• Water bath with heater <strong>and</strong> thermometer• H<strong>and</strong> held vacuum pump <strong>and</strong> trap• 2-20 µL micropipette + sterile tips• 100 - 1000 µL micropipette + sterile tips• 1-10 mL pipette + sterile tips• Glassware (including Duran bottles) baked <strong>for</strong> 4 hours at160 °C• Latex disposable gloves• Glass slides• 22 mm x 22 mm glass cover slips• Fine tip tweezers• 500 mL volumetric flasks, acid washed in 3N HCl• Poretics Polycarbonate filters; 3.0 µm pore size; 13 mmdiameter (Osmonics Inc.). Note that 5-8 µm pore sizefilters can be used <strong>for</strong> larger cells• Slowfade® Gold antifade reagent (Molecular Probes, InvitrogenDetection Technologies, S36936)Fixation1 Gloves must be worn at all times to avoid contaminationof samples with human derived RNAases;2 Switch water bath heater on, set at 45 ºC;3 Set up Milleriser Rig (Fig. 5). Assemble one filter set <strong>for</strong>each species specific probe, plus a positive control, SSUtargeteduniversally conserved sequence (Embley et al.1992, Field et al. 1988), a negative control (the complementof UniC) <strong>and</strong> a ‘no probe’ control;4 Using tweezers, place the o-ring into the tube. Place afilter onto the o-ring ensuring that the shiny side facesthe sample. Screw the base into tube <strong>and</strong> tighten untilfinger tight. Do not over tighten. Place assembled tubeinto Milleriser Rig. Attach tube of vacuum trap flask tothe Milleriser Rig <strong>and</strong> tube of vacuum pump to outsideflask outlet;5 Ensure valves are closed (i.e. horizontal);58
<strong>Microscopic</strong> <strong>and</strong> Molecular Methods <strong>for</strong> Quantitative Phytoplankton AnalysisChapter 9 Whole cell hybridisation assays6 Live field samples: Add 5 mL saline ethanol fixative toeach tube. Add live sample to the fixative. Use 5-10 mLof field sample (the volume can be varied according tocell numbers present). Filter down to 3 mL <strong>and</strong> add afurther 3 mL of saline ethanol fixative;7 Lugol’s iodine treated samples: add 5 mL saline ethanolfixative to each tube. Add 10 mL of Lugols treatedsample to the saline ethanol fixative. Add 3 drops of 3%Sodium thiosulphate (decolouriser) to each tube using aPasteur pipette;8 Cap tubes <strong>and</strong> tap gently to ensure no air bubbles are sittingon the filter. Let the sample st<strong>and</strong> <strong>for</strong> 1 to 24 hours,occasionally tapping gently to remove any air bubbles;9 Filter fixed samples ensuring the solution level does notdrop below the level of the gasket. Do not let pressuregauge read over 10 mgHg. Fixed samples can be kept <strong>for</strong>up to 4 weeks when stored at 4 ºC.Fluorescence in situ hybridisation10 Add 2 mL 1X SET hybridisation buffer to each tube;11 Filter samples as above - do not let filters dry out;12 Add 0.5 mL 1X SET hybridisation buffer to each tube;13 Darken room as much as possible <strong>for</strong> following steps asprobes are light sensitive;14 Add 12 µL (final concentration in hybridisation 4.8 ngµL -1 ) probe to tubes. Gently mix the pipette tip in thehybridisation buffer taking care not to touch the filter;15 Put lids on tubes. Place the Milleriser Rig <strong>and</strong> tubes ina water bath, ensuring that the solution in the tubes iscovered by the water level. Cover water bath with lid (oraluminium foil) to prevent light exposure. Leave in waterbath <strong>for</strong> 1 hour;16 Remove from water bath <strong>and</strong> filter as above;17 Add 2 mL 1X SET hybridisation buffer <strong>and</strong> leave atroom temperature <strong>for</strong> a few minutes;18 Gently filter samples until dry;19 One by one disassemble tubes, remove filters using tweezers<strong>and</strong> place on labelled slides;20 Pipette 12 µL of Slowfade® Gold antifade reagent ontoeach filter <strong>and</strong> add coverslip;21 Keep slides covered (i.e. in the dark) until they are readyto be viewed. Colour reaction is enhanced if slides are leftto sit in the dark <strong>for</strong> about 30 minutes be<strong>for</strong>e analysing;22 Analyse slides using an epifluorescence microscope (excitation490 nm; emission 520 nm) at 200X magnification(Fig. 4);23 Cells fluoresce brightly if the probe hybridises with targetrRNA. This defines a positive result. Species-specificprobe filters need to be compared with the positive, negative<strong>and</strong> ‘no probe’ controls to discriminate positive fluorescencefrom autofluorescence exhibited by non-targetcells;24 Results may be recorded as a comment based on the intensityof colour <strong>and</strong> the pattern of fluorescence. For example:”++” indicates a strong positive result, where cellsare very brightly coloured with the flurochrome”+” indicates a positive result or positive cells present.”-” indicates no cells are showing a positive result, cellsmay have a natural orange autofluorescence;25 Cells should be counted after an initial examination ofeach filter. Positive cells on the positive control filter mustbe counted as well as cells on all the species filters;Method 2MaterialsSolutions <strong>for</strong> fixationSaline ethanol (Scholin et al. 1996; see Appendix, Table 3 <strong>for</strong>details), prepared freshly <strong>for</strong> each experiment because of the<strong>for</strong>mation of precipitates or modified saline ethanol (Miller<strong>and</strong> Scholin 2000; see Appendix, Table 3 <strong>for</strong> details) as describedin method one.Solutions <strong>for</strong> Fluorescence in situ hybridisation• Hybridisation buffer• 5X SET buffer (see Appendix, Table 3 <strong>for</strong> details)• 0.1 % (v/v) Nonidet-P40• x % (v/v) Formamide**Note: Formamide concentrations must be determined <strong>for</strong>every single probe by per<strong>for</strong>ming FISH assays with <strong>for</strong>mamideconcentrations in 5 % intervals <strong>and</strong> microscopically verified.The appropriate <strong>for</strong>mamide concentration will brightlylabel all of the target cells tested with no cross hybridisation.The <strong>for</strong>mamide addition will reduce the binding temperatureof the probe so that it can hybridise specifically at 50 ºC. Thehybridisation buffer should be filter sterilised if stored <strong>for</strong> alonger time.Wash buffer• 1X SET buffer (see Appendix, Table 3 <strong>for</strong> details) in sterileMilli-Q waterProbesFluorescently labelled probes purchased from Thermo Scientific,Germany are delivered lyophilised. Stock solution of 1 µgµL -1 should be prepared <strong>and</strong> working solutions of 500 µL -1 <strong>and</strong>50 ng µL -1 in 1X TE buffer, pH 7.8- 8.0. Probe stock solutionshould be stored at -80°C <strong>and</strong> working solutions at -20°C.Additional Equipment• Filter vacuum manifold (Millipore, Bed<strong>for</strong>d, USA) orglass filter equipment• Hybridisation oven• Vacuum pump• Pipettes 1-20 µL, 100-100 µL + sterile tips• 1-50 mL pipette + sterile tips• Autoclaved glassware• Disposable gloves• Glass slides• Coverslips• Tweezer• White polycarbonate filter membranes: 47 mm or 25mm diameter, pore size depending on cell size (Millipore,Bed<strong>for</strong>d, USA)• DAPI (4’-6-Diamidino-2-phenylindole, Invitrogen,Karlsruhe, Germany)• Citifluor (Citifluor Ltd., Cambridge, UK)• Colourless nail varnishFixation1 Filter approximately 5 mL sample down onto a polycarbonatefilter with the lowest possible vacuum <strong>and</strong> incubatein the fixative <strong>for</strong> at least 1 hour at room temperatureor overnight at 4 ºC;2 Incubate the filter <strong>for</strong> 5 minutes with hybridisation bufferat room temperature to avoid precipitation. Air dry the59
IOC Manuals & Guides no 55Chapter 9 Whole cell hybridisation assaysfilter <strong>and</strong> use directly <strong>for</strong> FISH. Alternatively the filter canbe stored at room temperature <strong>for</strong> at least 1 month.Filters can also be cut in several pieces <strong>and</strong> treated individually<strong>for</strong> the detection of additional algal species in one sample.This has to be taken into account when calculating the finalcell density.Fluorescence in situ Hybridisation3 Apply 60 µL of hybridisation buffer containing the labelledprobe onto the filter <strong>and</strong> hybridise <strong>for</strong> 2 h in thedark at 50°C. The final probe concentration in the buffershould be 5 ng µL -1 . Controls are espeically recommended<strong>for</strong> newly designed probes. These should include (1)A ’no probe’ control: the same procedure without the additionof a probe. (2) A ’positive control’ where a knownworking probe is used. (3) A ’negative hybridisation control’where a ’nonsense’ probe is used which would notbind to any of the cells because of its target sequence;4 Place the slide in a darkened box with moistened filterpaper to provide a humid chamber <strong>for</strong> the hybridisationto take place. The hybridisation temperature is kept at50°C <strong>for</strong> all probes as the thermal melting point of theprobe is compensated by the addition of <strong>for</strong>mamide to enhancethe specificity of each probe. Readers are referred toAmann (1995) <strong>and</strong> Groben <strong>and</strong> Medlin (2005) <strong>for</strong> a fulldescription of how probes should be developed. It is importantto ensure that the entire filter piece is covered withliquid <strong>and</strong> if necessary, more buffer-probe mixture shouldbe used. The fluorescently labelled probe is light sensitive,so the filters should be kept in the dark <strong>for</strong> the rest of theprocedure, i.e. cover them during incubation times <strong>and</strong>minimise exposure to light when they are h<strong>and</strong>led;5 Terminate hybridisation by washing the filters in prewarmed(50 ºC) 1X SET wash buffer <strong>for</strong> 10 minutesat 50 ºC. After washing, dry the filters by blotting ontoWhatman filter paper.Counterstaining <strong>and</strong> Validation using Microscopy6 Mix one mL of Citifluor antifade + 0.5 mL Milli-Q water+ 1.5 µL DAPI (1 µg µL -1 );7 Place the filters on a glass slide; two filters, 25 mm in diameter,can be placed side by side on one glass slide. Add 60µL DAPI/Citifluor mixture to the filters, place a cover slipover the filters <strong>and</strong> seal edges with nail varnish. Store slidesin the dark until examined. Slides can be kept frozen <strong>for</strong>several months without loosing fluorescence signal;8 Analyse by epifluorescent microscopy using the appropriatefilter set <strong>for</strong> the fluorochrome attached to the probe(Fig. 2). When bound to the rRNA of target cells, positivelabelled cells fluoresce bright <strong>and</strong> are counted as positivesignal. Also the intensity of the given fluorescence has tobe recorded. The presumed positive results must be comparedwith positive, negative <strong>and</strong> ’no probe’ controls todifferentiate between a real signal from the bound probe<strong>and</strong> nonspecific binding of probes or autofluoresence.Method 3MaterialsSolutions <strong>for</strong> Fixation• Formaldehyde, 37% (Fisher Scientific, F79P-4)• 100% ice-cold methanol (Fisher Scientific, A452SK-4)Figure 5. Custom made Milleriser Rig.Solutions <strong>for</strong> Fluorescence in situ hybridisation• 25X SET buffer (as described in the Appendix, Table 3)• 5X SET Hybridisation buffer (to process 14 samples)20.4 mL Milli-Q water6.0 mL 25X SET buffer300 µL Igepal CA-630 (Sigma Chemical, I 3021)300 µL Polyadenylic acid (poly A) 10 mg mL L -1(Sigma Chemical, P 9403)3.0 mL Super Pure Formamide(Fisher Scientific, BP228-100)ProbesFor the North American Alex<strong>and</strong>rium ribotypes (Alex<strong>and</strong>riumfundyense/catenella/tamarense) the NA1 oligonucleotide probecan be used: 5’-Fluor/ AGTGCAACACTCCCACCA -3’(Anderson et al. 1999). Probe stocks should be stored in dry100 µg aliquots at -80 ºC. Resuspend probe stocks in 500µL 1x TE [TE-Tris-EDTA buffer 100X concentrate (SigmaChemical, T-9285); working stock 200. Add 360 µL of resuspendedprobe to 15 mL hybridisation buffer <strong>for</strong> incubations.• Wash buffer (0.2X SET)120 µL 25X SET buffer14.880 mL Milli-Q waterAdditional Equipment• Filter vacuum manifold (Promega Corp., A7231) withcustom made 25 mm filter funnels, (modification of theones described by Scholin et al. (1997) <strong>and</strong> are similar tothose in Figure 5)• Filter membranes: 25 mm Cyclopore membrane (WhatmanInc., 5 mm pore size, 09-930-14E)• ProLong Gold antifade reagent (Molecular Probes, InvitrogenDetection Technologies, P36930)Fixation1 Preserve a 14 mL sample with 0.75 mL <strong>for</strong>maldehyde(5% v/v, final concentration = 1.9% <strong>for</strong>maldehyde) in adisposable 15 mL centrifuge tube;2 The 14 mL volume may be a raw water sample or a concentratedsample generated using filtration;3 In the field, 2-4 lof water is typically filtered through a 20µm Nitex sieve (Nitex mesh, Sefar America, Inc., fitted atthe end of a 3 in. diameter PVC tube) <strong>and</strong> the collected60
<strong>Microscopic</strong> <strong>and</strong> Molecular Methods <strong>for</strong> Quantitative Phytoplankton AnalysisChapter 9 Whole cell hybridisation assays( cells Lcell material is resuspended to the 14 mL mark <strong>and</strong> preservedwith 5% v/v <strong>for</strong>malin;4 Store the samples at 4 ºC <strong>for</strong> a maximum of 36 hoursuntil they can be centrifuged at 3000 x g, <strong>for</strong> 5 minutesat room temperature;5 Aspirate the supernatant <strong>and</strong> resuspend the cell pellet in14 mL of ice-cold methanol to extract the chlorophyll<strong>and</strong> to stabilise the rRNA. Samples are required to st<strong>and</strong>in methanol <strong>for</strong> at least 1 hour prior to hybridisation butare stable <strong>for</strong> many months when stored at -20 ºC.Fluorescence in situ Hybridisation6 Add a volume of sample to a filter funnel containing aCyclopore filter. Filter the sample to near dryness usingthe lowest possible vacuum;7 Add 1 mL of pre-hybridisation buffer <strong>and</strong> incubate <strong>for</strong>5 minutes at room temperature. Percentage Note: species The filter composition funnelvalves should only be open when filtering; they shouldremain closed at all other times;8 Filter the pre-hybridisation buffer <strong>and</strong> add 1 mL hybridisationbuffer with added probe. Cap the filter tubes <strong>and</strong>place the manifold in a black plastic bag. The bag shouldcontain several wet paper towels to provide a humid environment.Seal the bag <strong>and</strong> place the samples in a dry heatincubator at 50 ºC (±2 ºC ) <strong>for</strong> 1 hour;9 Complete the hybridisation reaction by filtering thehybridisation buffer plus probe <strong>and</strong> adding 1 mL prewarmed(50 ºC) 0.2X SET wash buffer. Allow this toincubate <strong>for</strong> 5 minutes at room temperature;10 Filter the wash buffer. Keep the filter funnel valve open<strong>and</strong> continue to apply vacuum to the sample until thefilter has been placed onto a microscope slide. Add 25µL ProLong Gold antifade reagent <strong>and</strong> a coverslip to thefilter. Samples can be stored at 4 ºC in the dark <strong>for</strong> severalweeks prior to observation, but, best results are obtainedby viewing the sample immediately after hybridisation;11 Samples can be observed <strong>and</strong> counted with epifluorescencemicroscopy, at 100X using the appropriate filterset. For Cy3, Chroma 41032 or FITC, Chroma 41012(Chroma Technology Corp.) filter sets are recommended(Fig. 3).Formulas <strong>for</strong> Calculating ResultsIdeally the entire filter is examined <strong>and</strong> positive cells enumerated.;hence, the cell number is reflective of amount o<strong>for</strong>iginal sample that was processed <strong>and</strong> preserved as well as tothe volume of the preserved sample that was placed onto thefilter <strong>for</strong> hybridisation. It should be noted, that only the filterarea is counted <strong>and</strong> not the entire area under the coverslip,which is usually larger than that of the sample filter. If targetcell densities are high <strong>and</strong> warrant only counting a portion ofthe filter, then a decision has to be made on how to proceedwith the count to af<strong>for</strong>d a statistically reliable value. Andersen<strong>and</strong> Throndsen (2004) provide a good review on this in theirchapter in the Manual on Harmful Marine Microalgae.where N is the number of positive cells on the whole filter <strong>and</strong>V (mL) is the volume of sample used.To calculate species composition of a bloomThe FISH assay can be used as a secondary test to light microscopyanalysis when a designated cell count <strong>for</strong> a particulargenus (e.g. Pseudo-nitzschia) has been exceeded <strong>and</strong> speciationis required to determine risk associated with toxicity. In caseswhere the cell count has been determined previously <strong>for</strong> thetarget genus, the percentage that each species comprises inthe sample (i.e. the total species positive counts) can be determinedusing the following <strong>for</strong>mula:where S is the number of positive cells on a species-specificfilter <strong>and</strong> T is the total number of genus positive counts.Percentages calculated from the FISH data can be applied tothe original cell count to get an approximate density of eachspecies in the sample. Pieces of a filter can also be analysed.Counts on the portion of the filter can be calibrated in a similarfashion to those of the Utermöhl method (chapter 2). Thisremoves the requirement <strong>for</strong> analysing the entire filter, providedthat a sufficient proportion of a filter is analysed <strong>for</strong>statistical significance <strong>and</strong> that the proportion is the same <strong>for</strong>each species-specific filter.DiscussionWhole cell, fluorescently labelled oligonucleotide enumeration-basedassays <strong>for</strong> HAB species can be a simple, effective<strong>and</strong> efficient tool <strong>for</strong> counting natural <strong>phytoplankton</strong> samples.Empirical trials with more traditional counting <strong>methods</strong>,as discussed in this manual <strong>and</strong> other studies (e.g. Andersonet al. 2005), need to be conducted to determine the specificityof the probe with the target species. This is because notall species-specific probes will label morphologically identicalorganisms because of their genetic dissimilarities. If a suitableprobe has been shown to hybridise with the target organism,<strong>and</strong> the required equipment to per<strong>for</strong>m the hybridisation<strong>and</strong> subsequent microscopic analysis are available, then thistechnique can easily be used to enumerate numerous samplesby researchers with limited laboratory <strong>and</strong> microscope experience.Automated counting systems, such as the ChemScan(Chemunex, France), make this operation much faster (Töbeet al. 2006).The specificity that each probe binds to the target speciesrRNA needs to be fully evaluated in optimisation <strong>and</strong> crossreactivity trials. To optimise the FISH hybridization parameters<strong>for</strong> each probe, assay conditions such as reagent concentrations,hybridisation temperature <strong>and</strong> time can be ma-A generic <strong>for</strong>mula to calculate cells L -1 <strong>for</strong> all 3 <strong>methods</strong>:nipulated to produce stronger epifluorescent signals. Methods−1⎛ Positive cell count on whole filter ( N)⎞Cell concentration ( cells L ) ⎜described in this manual (such ⎟ *1000 as light microscopy <strong>and</strong> Calcofluorsample staining), ( mL ) <strong>and</strong> in other ⎠ studies, (e.g. Anderson et al.⎝ Volume of1 ⎛ Positive cell count on whole filter ( N)⎞) ⎜⎟ *1000 2005) must be conducted to determine the extent (if any) of⎝ Volume of sample ( mL ) ⎠cross reactivity with non-target species.−⎛ Positive species cell counPercentage species composition ⎜⎝ Positive genus cell coun⎛ Positive species cell count on whole filter ( S ) ⎞ ⎜⎟ * 100⎝ Positive genus cell count on whole filter ( T ) ⎠61
IOC Manuals & Guides no 55Chapter 9 Whole cell hybridisation assaysCareful consideration must be given when determining theassay conditions to balance signal intensity against cross reactivity.Positive, negative <strong>and</strong> ‘no probe’ controls are critical <strong>for</strong>this. Signal intensity of the target species compared with thepositive control will give an indication of optimal assay conditions.The negative control will indicate non-specific bindingcaused by sub-optimal conditions. The ‘no probe’ control iscritical <strong>for</strong> assessing the amount of autoflourescence exhibitedby the cells, which must not be confused as a positive signal.Consideration also needs to be given to the choice of samplepreservation as two of the <strong>methods</strong> described herein utilisethe relatively safe ethanol/SET preservative, but, these do notaf<strong>for</strong>d the luxury of long-term sample storage. Formalin fixationfollowed by methanol extraction <strong>and</strong> -20 ºC storage allows<strong>for</strong> long-term sample archiving <strong>and</strong> subsequent hybridisation,but, involves the use of hazardous chemicals <strong>and</strong> anextra centrifugation step to remove the <strong>for</strong>malin seawater supernatantfrom the cell pellet. Both fixation <strong>methods</strong> will providethe user with good labelling intensity of the target cells.In New Zeal<strong>and</strong>, the FISH assay is used as a supporting toolto light microscopy providing additional in<strong>for</strong>mation to regulators.Multiple species-specific probes can be run as a screento determine the composition of a bloom when a sample hasreturned elevated cell counts of potential species of concern.The FISH assay enable rapid identification to the species levelin such cases; a task that would be both time consuming <strong>and</strong>require a significant level of experience to achieve the sameresults using light microscope techniques.To increase cell detection limits <strong>for</strong> field samples, large volumesof water (1-8 l) can be filtered through an appropriatemesh size <strong>for</strong> concentration purposes, if the target organismis amenable to this type of concentration (e.g. Anderson et al.2005). The captured cell material can then be washed into acentrifuge tube, preserved <strong>and</strong> an aliquot of the sample slurrycan then be processed <strong>for</strong> the FISH assay. One of the benefitsof using FISH is that samples with high biomass as well asdifficult to identify species can be easily examined <strong>and</strong> enumeratedby an inexperienced microscopist. A 2 Litre sampleof field material can be concentrated down to a volume of 15mL, of which, 7.5 mL is then processed <strong>for</strong> FISH af<strong>for</strong>ding alimit of detection of 1 cell L -1 . One Litre is more than sufficient,unless the study, e.g. picoplankton, calls <strong>for</strong> greater volumes.The sample volume used in the assay can be adjustedbased on cell counts derived from light microscope analysison test samples.This method is suitable <strong>for</strong> all species <strong>for</strong> which a probe hasbeen designed <strong>and</strong> are amicable to the preservation <strong>methods</strong>outlined here. The detection limit of one cell per filter caneasily be achieved by manual counts or if automatic countingdevices are used, such as the ChemScan solid phase cytometer(see chapter 14 <strong>and</strong> Töbe et al. 2006). The accuracy of manualcounting depends on the amount of debris in the sample <strong>and</strong>the skill of the microscopist to discriminate the positive signalagainst the weak autofluorescence of other cells. In order toensure that the method works well, it is important that goodtemperature control is achieved during the hybridisation step.It is also imperative that the excess probe is washed off thefilter in order to reduce background fluorescent interference.AcknowledgementsThe work done by LKM <strong>and</strong> KT was funded by the StiftungAlfred-Wegener-Institut für Polar und Meeres<strong>for</strong>schungin the Helmholtz-Gesellschaft, Bremerhaven, Germany <strong>and</strong>in part by EU DETAL, Project QLRT-1999-30778. Supportwas provided by the following grants to DMA: the Universityof New Hampshire Cooperative Institute <strong>for</strong> Coastal <strong>and</strong>Estuarine Technology (CICEET) as a subcontract through aNational Oceanic <strong>and</strong> Atmospheric Administration (NOAA)Grant NA05NOS4191149; NSF (National Science Foundation)Grant OCE-0136861 <strong>and</strong> the ECOHAB (The Ecology<strong>and</strong> Oceanography of harmful Algal Blooms) programthrough NOAA Grant NA16OP1438. This ef<strong>for</strong>t was supportedin part by the U.S. ECOHAB program sponsored byNOAA, the U.S. EPA (Environmental Protection Agency),NSF, NASA (National Aeronautics <strong>and</strong> Space Administration)<strong>and</strong> ONR (Office of Naval Research) - ECOHAB contributionnumber 323. Attendance at the workshop <strong>for</strong> MelissaGladstone was funded through the Technical ParticipationProgramme, New Zeal<strong>and</strong>, <strong>and</strong> the New Zeal<strong>and</strong> Food SafetyAuthority.ReferencesAmann RI (1995) In situ identification of micro-organisms by wholecell hybridisation with rRNA-targeted nucleic acid probes. In:Akkermans ADL, van Elsas JD, de Bruijn FJ (eds) Molecular microbialecology manual 336. Kluwer Academic Publishers, Dordrecht,NL, p. 1-15Andersen P, Throndsen J (2004) Estimating cell numbers. In: HallegraeffGM, Anderson DM, Cembella A (eds), Manual on harmfulmarine microalgae Intergovernmental Oceanographic Commission,UNESCO, Paris, France, p. 99-129Anderson DM (1995) Identification of harmful algal species using<strong>molecular</strong> probes: an emerging perspective. In: Lassus P, ArzulErard G, Gentien P, Marcaillou C, (eds) Harmful marine algalblooms. Lavoisier, Intercept Ltd, p. 3-13Anderson DM, Kulis DM, Keafer BA, Berdalet E (1999) Detectionof the toxic dinoflagellate Alex<strong>and</strong>rium fundyense (Dinophyceae)with oligonucleotide <strong>and</strong> antibody probes: variability in labelingintensity with physiological condition. J Phycol 35:870-883Anderson DM, Kulis DM, Keafer BA, Gribble KE, Marin R, ScholinCA (2005) Identification <strong>and</strong> enumeration of Alex<strong>and</strong>riumspp. from the Gulf of Maine using <strong>molecular</strong> probes. Deep-SeaRes II 52:2467-2490Eller G., Töbe, K, <strong>and</strong> Medlin, L.K. (2007) A set of hierarchicalFISH probes <strong>for</strong> the Haptophyta <strong>and</strong> a division level probe <strong>for</strong> theHeterokonta. Journal of Plankton Research, 29:629-640Embley TM, Finlay BJ, Thomas RH, Dyal PL (1992) The use ofrRNA sequences <strong>and</strong> fluorescent probes to investigate the phylogeneticpositions of the anaerobic ciliate Metopus palae<strong>for</strong>mis <strong>and</strong>its archaeobacterial endosymbiont. J Gen Microbiol 138:1479-87Field KG, Lane DJ, Giovanni SJ, Ghilselin MT, Raff EC, Pace NR,Raff RA (1988) Molecular phylogeny of the animal kingdom. Science.239:748-53Groben R, John U, Eller G, Lange M, Medlin LK (2004) Using fluorescently-labelledrRNA probes <strong>for</strong> hierarchical estimation of <strong>phytoplankton</strong>diversity-a mini review. Nova Hedwigia 79:313-320Groben R, Medlin LK (2005) In Situ Hybridisation of <strong>phytoplankton</strong>using fluorescently labelled rRNA probes. In: Zimmer EA,Roalson E (eds), Methods in enzymology. Elsevier, San Diego,62
<strong>Microscopic</strong> <strong>and</strong> Molecular Methods <strong>for</strong> Quantitative Phytoplankton AnalysisChapter 9 Whole cell hybridisation assaysCA. 395:29-310John U, Cembella A, Hummert C, Ellbrächter M, Groben R, MedlinLK (2003) Discrimination of the toxigenic dinoflagellatesAlex<strong>and</strong>rium tamarense <strong>and</strong> A. ostenfeldii in co-occurring naturalpopulations from Scottish coastal waters. Eur J Phycol 38:25-40Miller PE, Scholin CA (1996) Identification of cultured Pseudonitzschia(Bacillariophyceae) using species specific LSU rRNAtargeted fluorescent probes. J Phycol 32:646-655Miller PE, Scholin CA (1998) Identification <strong>and</strong> enumeration ofcultured <strong>and</strong> wild Pseudo-nitzschia (Bacillariophyceae) usingspecies-specific LSU rRNA-targeted fluorescent probes <strong>and</strong> filterbased whole cell hybridization. J Phycol 38: 371-382Miller PE, Scholin CA (2000) On detection of Pseudo-nitzschia(Bacillariophyceae) species using whole cell hybridization: Samplefixation <strong>and</strong> stability. J Phycol 36:238-250Rhodes L, Holl<strong>and</strong> PT, McNabb P, Adamson J, Selwood AR (2004a)Production of isodomoic acid C by Pseudo-nitzschia australis, asdetermined by DNA probe <strong>and</strong> LC-MS technologies. In: Proceedingsof HABTech03 Workshop, Nelson, November (2003)Holl<strong>and</strong> P, Rhodes L, Brown L (eds) Cawthron report No. 906,p127. ISBN 0-476-00622-8Rhodes L, Haywood A, Adamson J, Ponikla K, Scholin C (2004b)DNA probes <strong>for</strong> the detection of Karenia species in New Zeal<strong>and</strong>’scoastal waters. In: Steidinger K, L<strong>and</strong>sberg J, Vargo G (eds)Harmful algae. (2002) Florida Fish <strong>and</strong> Wildlife Cons Comm,Florida Inst Oceanography <strong>and</strong> IOC of UNESCO, p. 273-275Scholin CA, Buck KR, BritschigT, Cangelosi G, Chavez FP (1996)Identification of Pseudo-nitzschia australis (Bacillariophyceae) usingrRNA-targeted probes in whole cell <strong>and</strong> s<strong>and</strong>wich hybridization<strong>for</strong>mats. Phycologia 35:190-197Scholin C, Miller P, Buck K, Chavez F, Harris P, Haydock, P, HowardJ, Cangelosi G (1997) Detection <strong>and</strong> quantification of Pseudonitzschiaaustralis in cultured <strong>and</strong> natural populations using LSUrRNA-targeted probes. Limnol Oceanogr 42: 1265–1272Simon N, Brenner J, Edvardsen B, Medlin LK (1997) The identificationof Chrysochromulina <strong>and</strong> Prymnesium species (Haptophyta,Prymnesiophyceae) using fluorescent or chemiluminescent oligonucleotideprobes: a means of improving studies on toxic algae.Eur J Phycol 32:393-401Simon N, Campbell L, Örnólfsdóttir E, Groben R, Guillou L, LangeM, Medlin LK (2000) Oligonucleotide probes <strong>for</strong> the identificationof three algal groups by dot blot <strong>and</strong> fluorescent whole-cellhybridisation. J Euk Micro 47:76-84Töbe K, Eller G, Medlin LK (2006) Automated detection <strong>and</strong> enumerationof Prymnesium parvum (Haptophyta: Prymnesiophyceae)by solid-phase cytometry. J Plankton Res 28:643-65763
IOC Manuals & Guides no 55Chapter 9 Whole cell hybridisation assaysAppendixTable 1. Equipment <strong>and</strong> SuppliersEquipment Supplier Cat. Number € US $ MethodFilter Manifold Millipore XX2702550 400 587 2Vacuum pump Omnilab 9.881 391 574 2,3Incubator ”Shake’n’Stack” VWR 7996 2310 3387 2,3Epifluorescence microscope, Eclipse Nikon MAA600BA 25000 36.654 2E800Epifluorescence microscope, Carl Zeiss 4300050000000000 16000 25000 1,3Axioimager A1Milleriser Rig Custom made 55 80 1Waterbath Grant JBAqua-26 1130 1650 1Filter Manifold Promega A7231 76 114 3Pipette 2 µL – 20 µL Fisher Scientific 05-402-87 193 289 1,2,3Pipette 20 µL – 200 µL Fisher Scientific 05-402-89 193 289 1,2,3Pipette 200 µL – 1000 µL Fisher Scientific 05-402-90 193 289 1,2,3Pipette 1 mL – 10 mL Fisher Scientific 05-403-121 193 289 1,2,3Table 2. Chemicals <strong>and</strong> SuppliersEquipment Supplier Cat. Number € US $ MethodFixationEthanol, absolute,1l Merck 1.009.832.500 73 107 1,2,3Methanol, 100% Fisher Scientific A452SK-4 61 90 3Milli-Q waterMost labs have an in-house1,2,3supplySodium chloride, 1 kg Sigma-Aldrich S9888 23 34 1,2,3Tris/HCl, 500 g Sigma-Aldrich T3253 96 141 1,2,3Nonidet-P40, 100 mL Roche 11754599 74 109 2EDTA, 500 g Sigma-Aldrich E7889 56 82 1,2,3Formaldehyde, 37% Fisher Scientific F79P-500 27 40 3Isopore white polycarbonate membrane filter, 3 µm pore size, Qty. 100 Millipore TSTP02500 130 191 2Whatman,Cyclopore, 5 µm pore, 25 mm dia., Qty. 100 Whatman 7062-2513 67 100 3HybridisationFITC-labelled probe Thermo Scientific - 65 95 2FITC-labelled probe Oligos Etc. - 0.7* 1* 3Igepal CA-630, 50 mL Sigma Chemical I3021 16 23 1,3Polyadenylic acid (poly A) 10 mg/mL Sigma Chemical P-9403 29 42 1,3Deionized <strong>for</strong>mamide, 100 mL Sigma-Aldrich F 9037 46 67 2,3Nonidet-P40, 100mL Roche 11754599 74 109 2Counterstaining <strong>and</strong> microscopical validationDAPI (4’-6-Diamidino-2-phenylindole) Invitrogen, Karlsruhe, Germany D1306 97 142 2Slowfade® Gold antifade reagentMolecular Probes, Invitrogen S36936 82 120 1Detection TechnologiesCitifluor antifade Citifluor Ltd., Cambridge, UK X506 117 172 2ProLong Gold antifade reagentMolecular Probes, InvitrogenDetection TechnologiesP36930 71 104 364
<strong>Microscopic</strong> <strong>and</strong> Molecular Methods <strong>for</strong> Quantitative Phytoplankton AnalysisChapter 9 Whole cell hybridisation assaysTable 3. Buffers <strong>and</strong> solutionsSolution/Reagent Purpose ContentsModified Saline Ethanol SolutionSaline Ethanol Solution25X SET buffer5X SET buffer1X SET bufferFixative(after Miller <strong>and</strong> Scholin 2000)Fixative(after Scholin et al. 1996)Fixative(discard after 12 months)To make up 300 mL:220 mL 22 vol. 95% ethanol50 mL 5 vol. Milli-Q water30 mL 3 vol. 25X SET bufferTo make up 300 mL:250 mL 25 vol. 95% ethanol20 mL 2 vol. Milli-Q water30 mL 3 vol. 25X SET bufferTo make up:219.15 g 3.75 M NaCl157.60 g 0.5 M Tris/HCl , pH has to be near 8.0, be<strong>for</strong>eadding EDTA9.3 g 25 mM EDTA, pH 7.8, filter sterilised, 1 LitreHybridisation bufferTo make up 400 mL:(used <strong>for</strong> diatoms from the genus Pseudo-nitzschia) 316 mL Milli-Q Water80 mL 25X SET buffer4 mL 10% Igepal, CA-630 (Sigma Chemical, I 3021)Hybridisation buffer(used <strong>for</strong> dinoflagellates from the genera Karenia<strong>and</strong> Alex<strong>and</strong>rium)To make up 400 mL:380 mL Milli-Q Water16 mL 25X SET buffer4 mL 10% Igepal, CA-630(Sigma Chemical, I 3021)1X SET buffer, other use Wash buffer 1X SET buffer in sterile Milli-Q water0.2X SET Wash buffer To process 14 samples:120 µL 25X SET buffer14.880 mL Milli-Q water65
<strong>Microscopic</strong> <strong>and</strong> Molecular Methods <strong>for</strong> Quantitative Phytoplankton AnalysisChapter 10 Electrochemical detection of toxic algae with a biosensor10 Electrochemical detection of toxic algae with a biosensorSonja Diercks 1 *, Katja Metfies 1 <strong>and</strong> Linda Medlin 21Alfred Wegener Institute <strong>for</strong> Polar <strong>and</strong> Marine Research, Am H<strong>and</strong>elshafen 12, D-27570 Bremerhaven , Germany2Observatoire Océanologique de Banyuls-sur-Mer, Laboratoire Arago, 66651 Banyuls-sur-Mer, France*Author <strong>for</strong> correspondence: E-mail: sonja.diercks@awi.deIntroductionDNA-biosensors (devices that use <strong>molecular</strong> probes to detecttarget nucleic acids in a sample) are utilised in a number ofdifferent scientific fields. Glucose detection was one of thefirst applications developed using biosensors (Clark 1956).Electrochemical biosensors combine a biochemical recognitionwith signal transduction <strong>for</strong> the detection of specific molecules.The detection component such as a probe sequence,an antibody, an enzyme or other biomolecule, catalyzes a reactionwith, or specifically binds to, the target of interest. Atransducer component then trans<strong>for</strong>ms this detection eventinto a measurable signal. Different types of biosensors can useoptical, bioluminescent, thermal, mass <strong>and</strong> electrochemicalrecognition (Gau et al. 2005). Currently, biosensors are usedin many different applications, such as the identification of infectiousorganisms, hazardous chemicals <strong>and</strong> the monitoringof metabolites in environmental samples (Hartley & Baeumner2003). Biosensors can be produced very cheaply <strong>for</strong> massproduction. A new detection method <strong>for</strong> the identification ofharmful algae is currently being developed using a h<strong>and</strong> helddevice <strong>and</strong> biosensors (Fig. 1 <strong>and</strong> 2). The first prototype wasused to identify the toxic dinoflagellate Alex<strong>and</strong>rium ostenfeldii(Metfies et al. 2005). The second prototype, manufacturedby Palm Instruments BV (Houten, Netherl<strong>and</strong>s) (Fig. 1), hasbeen extensively used to improve the biosensors. The h<strong>and</strong>held device “PalmSens” is a compact portable potentiostat <strong>for</strong>all kinds of electrochemical sensors <strong>and</strong> cells. It was designed<strong>for</strong> applications in the field as well as laboratories. It can beconfigured <strong>for</strong> a single application but can also be used as ageneric electrochemical instrument.Figure 1. PalmSens device from Palm Instruments.Figure 2. Sensorchip of original prototype with counter <strong>and</strong> referenceelectrode <strong>and</strong> the reaction layer.Basic principles of electrochemical detectionof toxic algae with a biosensorMolecular probesIdentification of toxic algae is based on oligonucleotide probesthat specifically target ribosomal RNA. Targets <strong>for</strong> the probesare the small <strong>and</strong> large subunit rRNA genes in the ribosomesof the cells. The conserved <strong>and</strong> variable regions in these genesmake it possible to develop probes specific <strong>for</strong> different taxonomiclevels (Groben et al. 2004). The ARB (latin, “arbor”= tree) software package can be used <strong>for</strong> probe development(Ludwig et al. 2004). Theoretical probe specificity is dependenton the number of sequences of the targeted gene availablein the databases. If <strong>molecular</strong> probes are designed from onlya few sequences, there is a danger of cross hybridisation tonon target species <strong>and</strong> organisms whose sequences are not inthe GENBANK database. Prior to the analysis of field samples,<strong>molecular</strong> probes have to be tested <strong>for</strong> specificity withcultivated target species as well as closely related species as insilico (calculated by means of a computer simulation) <strong>and</strong> insitu results can show different specificity signals. Nucleic acidprobes have been developed <strong>for</strong> toxic micro-algal taxa includ-Figure 3. Principle of S<strong>and</strong>wich Hybridisation with capture <strong>and</strong>signal probe.Figure 4. Principle of redox-reaction presenting the electron transportfrom the surface of the sensor.67
IOC Manuals & Guides no 55Chapter 10 Electrochemical detection of toxic algae with a biosensorThe fundamentals ofElectrochemical detection of toxic algae with a biosensorScopeThe h<strong>and</strong> held device can be used <strong>for</strong> the rapid detection of<strong>phytoplankton</strong> in water samples. The device is a prototype <strong>and</strong>has been further automated in an EU-funded project (ProjectALGADEC).Detection rangeThe detection limit has to be determined <strong>for</strong> each probe set.The calculated detection limit with the h<strong>and</strong> held device <strong>for</strong>Alex<strong>and</strong>rium ostenfeldii is ~ 800 cells.AdvantagesSeveral probe sets have already been developed <strong>for</strong> this method.DrawbacksAt the time of publication of this Manual, the h<strong>and</strong> held deviceis still a prototype <strong>and</strong> not available <strong>for</strong> general purchase. Probes<strong>for</strong> only a limited number of <strong>phytoplankton</strong> exist. Probes mustbe validated <strong>for</strong> each region where they are applied. Generationof calibration curves are required <strong>for</strong> each probe set. Highsample volume is required if the cell densities are expected tobe relatively low. Manual RNA isolation should be done by atrained <strong>molecular</strong> scientist. The isolation of a sufficient amountof target rRNA from the sample to be tested is required <strong>for</strong>this assay. A validation of probe signals against total rRNA <strong>and</strong>over the growth cycle of the algae under different environmentalconditions has to be carried out be<strong>for</strong>e the method can beapplied to field samples.Type of training neededInstruction in setting up this technique should come from aperson with an in-depth knowledge <strong>and</strong> experience of <strong>molecular</strong>biology.a) per<strong>for</strong>m task: approximately five days are necessary to trainan individual in this method.b) troubleshoot <strong>and</strong> quality control: a skilled <strong>molecular</strong> biologistshould be available to solve any problems that may ariseusing this method.Essential EquipmentIncubatorThermoheaterVacuumpumpWashbottleMini-CentrifugeBeadbeaterRNeasy Mini Plant Kit (QIAGEN)Nanodrop SpectrophotometerH<strong>and</strong>held DeviceEquipment cost*€27350, $38400, <strong>for</strong> details see Table 4Consumables, cost per sample**0.24 € , $0.35 not including probesProcessing time per sample be<strong>for</strong>e analysisConcentration of cells by centrifugation ~20 minutes, coatingof electrodes ~ 2 hours <strong>and</strong> RNA isolation ~1 hour.Analysis time per sampleAnalysis time per sample: S<strong>and</strong>wich hybridisation ~ 2 hours.Sample throughput per person per day12 to 16 samples per dayNo. of samples processed in parallelSix to eightHealth <strong>and</strong> Safety issuesRelevant health <strong>and</strong> safety procedures must be followed. ReadMaterial Data Safety Sheets <strong>for</strong> all chemicals.The following three chemicals are particularly hazardous• Hydrogen peroxide 30 % (H 2O 2)• N-Phenyl-1,4-benzenediamine hydrochloride (ADPA)• β-Mercaptoethanol*service contracts not included**salaries not included68
<strong>Microscopic</strong> <strong>and</strong> Molecular Methods <strong>for</strong> Quantitative Phytoplankton AnalysisChapter 10 Electrochemical detection of toxic algae with a biosensoring diatoms <strong>and</strong> dinoflagellates such as Pseudo-nitzschia <strong>and</strong>Alex<strong>and</strong>rium (Scholin et al. 1996, Simon et al. 1997, Miller &Scholin 1998, John et al. 2003).Disposable sensor-chip <strong>and</strong> detection principleThe disposable biosensor chip is composed of a carrier materialon which a working electrode is printed <strong>and</strong> the detectionreaction takes place, a reference electrode <strong>and</strong> an auxiliaryelectrode (Fig. 2).The working electrode has a diameter of 1 mm <strong>and</strong> is madeof a carbon paste. A biotinylated probe is immobilised on thereaction layer of the working electrode via avidin. The nucleicacids are detected on the sensor chip via a s<strong>and</strong>wich-hybridisation(Zammatteo et al. 1995, Rautio et al. 2003) (Fig. 3).The underlying principle of the s<strong>and</strong>wich hybridisation isthat the target specific probe (capture probe) is immobilisedvia avidin on the surface of the working electrode. If a targetnucleic acid is bound to the immobilised probe on the workingelectrode, the detection of the nucleic acid takes placevia a hybridisation reaction to a second target specific probe,the signal probe that is coupled to digoxigenin (Metfies et al.2005).The digoxigenin specific antibody coupled to horseradishperoxidaseis added to the sensor chip. Horseradish-peroxidasecatalyses the reduction of hydrogen peroxide to water.Reduced peroxidase is regenerated by p-aminodiphenylamine(ADPA), which functions as a mediator. The oxidised mediatoris reduced at the working electrode with a potentialof -150 mV (versus Ag/AgCl) taking an electron from thesurface of the sensor (Fig. 4). A potential is applied betweenthe working <strong>and</strong> the reference electrode. The h<strong>and</strong> held devicemeasures the resulting current activated through the flowof the electrons from the surface. An electrochemical signalcan only be measured if the target nucleic acid binds to boththe capture <strong>and</strong> signal probes (Metfies et al. 2005). For eachtarget species the RNA concentration per cell has to be determined.A calibration curve must be developed <strong>for</strong> each newprobe set in order to determine the signal intensity at differentRNA concentrations. Using the in<strong>for</strong>mation on the curve, theelectrical measurement of the h<strong>and</strong> held device can be relatedto cell numbers in a field sample.MaterialsLaboratory facilitiesFume hood <strong>for</strong> RNA isolationEquipment, Chemicals <strong>and</strong> ConsumablesIn<strong>for</strong>mation on the equipment, chemicals <strong>and</strong> consumablesused in this method are presented in the Appendix, Tables1-2, at the end of this chapter (Tables 1-2). Suppliers, Cataloguenumbers <strong>and</strong> estimated cost in Euros <strong>and</strong> US Dollarsare also listed in Tables 1-2.Required Equipment (essential)• Centrifuge• Filter, 0.5 µm, ISOPORE, membrane filters, Millipore,Irel<strong>and</strong>• Frit, flask <strong>and</strong> funnel, Millipore, Irel<strong>and</strong>• Mini-Beadbeater, Biospec products, Biospec productsInc, USA• Mini-Centrifuge• Thermoshaker• Incubator• Vacuum pump with wash bottle• Biosensors, Gwent Electronic Materials, Pontypool, UK• Freezer -80 ºCSolutions <strong>for</strong> preservation of microalgal cellsRNAlater, Ambion, Huntingdon, UKMethodConcentration of cellsHarvesting of cells can be per<strong>for</strong>med by either centrifugation<strong>and</strong> the supernatant discarded or filtration using a filtrationdevice <strong>and</strong> a h<strong>and</strong> held vacuum pump (Fig. 5). A maximumof ~ 1 x 10 7 cells can be processed with the RNeasy PlantMini Kit.Preservation <strong>and</strong> storageAfter collecting water samples, the algae cells can be stored atroom temperature <strong>for</strong> several days using RNALater from Ambion,Huntingdon, UK <strong>for</strong> a later RNA isolation. Follow theinstructions that come with RNALater carefully. The cells canalso be frozen <strong>for</strong> long term storage by flash-freezing in liquidnitrogen <strong>and</strong> immediately transferred to -70 ºC.RNA Isolation with the RNeasy Plant Mini Kit(QIAGEN) (modified protocol)General h<strong>and</strong>ling of RNA: Ribonucleases (RNases) are verystable, active enzymes <strong>and</strong> are difficult to inactivate; evenminute amounts are sufficient to destroy RNA. All glasswaremust first be cleaned with a detergent, thoroughly rinsed, <strong>and</strong>oven baked at 240 ºC <strong>for</strong> four or more hours be<strong>for</strong>e use toavoid any RNase contamination. Gloves must always be wornwhile h<strong>and</strong>ling reagents <strong>and</strong> RNA samples to prevent contaminationfrom the surface of the skin or from dusty laboratoryequipment. Isolated RNA should be stored on ice whilebeing processed.RNA-Isolation1 Add 450 µL buffer RLT with ß-ME (ß-Mercaptoethanol)to the cells;2 Pipette the lysate onto the glass beads <strong>and</strong> disrupt thelysate in a bead beater <strong>for</strong> 2x 20 seconds;3 Pipette the lysate directly onto a QIAshredder spin column(lilac) placed in a 2 mL collection tube, <strong>and</strong> centrifuge<strong>for</strong> 15 minutes at maximum speed. Carefully transferthe supernatant of the flow-through fraction to a newmicrocentrifuge tube without disturbing the cell debrispellet in the collection tube. Use only this supernatant insubsequent steps;4 Add 0.5 volume (usually 225 µL) ethanol (96–100 %) tothe cleared lysate <strong>and</strong> mix immediately by pipetting. Donot centrifuge. Continue without delay;5 Apply sample (usually 650 µL), including any precipitatethat may have <strong>for</strong>med, into an RNeasy mini column(pink) placed in a 2 mL collection tube. Close the tubegently <strong>and</strong> centrifuge <strong>for</strong> 15 seconds at 8000 x g. Discardthe flow-through. Reuse the collection tube in the nextstep;69
<strong>Microscopic</strong> <strong>and</strong> Molecular Methods <strong>for</strong> Quantitative Phytoplankton AnalysisChapter 10 Electrochemical detection of toxic algae with a biosensorFigure 6: Applying of buffer onto the electrodes.D. Detection14 Wash the sensors in 1X POP buffer (pH 6.45) (Table 1)to remove excess RNA;15 Incubate the sensors with 1.5 µL Anti-Dig-POD [7.5U mL -1 in PBS-BT] at room temperature <strong>for</strong> 30 minutes(Table 1);16 Wash the sensors separately in 1x POP buffer to removeexcess Anti-Dig-POD <strong>and</strong> dry with a vacuum pump.17 Add 20 µL of POD substrate onto the electrode (PODsubstrate contains 1.1 mg N-Phenyl 1,4-phenylenediaminehydrochloride (ADPA) dissolved in 110 µL ethanol,250 µL of 100 mM H 2O 2are added <strong>and</strong> filled up to25 mL with 1X POP buffer);18 Plug the chip into the h<strong>and</strong> held device <strong>and</strong> record themeasurement (Fig. 12). A summary of the buffers usedduring the s<strong>and</strong>wich hybridisation process are presentedin Table 1.Formulas <strong>for</strong> calculating resultsA calibration has to be determined <strong>for</strong> each probe set to findthe signal intensity (nA) <strong>for</strong> 1 ng RNA. For each target species,the RNA concentration per cell has to be investigated.Subsequently the cell concentration of the target species in awater sample can be calculated from the electrochemical signals:nA (probe signal ) total ng RNA (present in the sample)Figure 7. Pump <strong>and</strong> washbottle <strong>for</strong> exhausting of buffers from theelectrodes.Let thenCell number nA (probesignal )ngRNA (per cell)Quality controlWhen developing this method it is useful to confirm the resultsignals <strong>and</strong> calculated cell counts with real cell count results.This QC system will also determine if the user trainingprovided is sufficient. A <strong>molecular</strong> biologist should be able tosolve any problems that arise during the experiments. Falsenegative signals can result <strong>for</strong> a number of reasons such asdegradation of antibodies or buffers.DiscussionFigure 8. Drying of chips using a vacuum pump <strong>and</strong> a wash bottle.Figure 9. Petri dish with Whatman filter <strong>and</strong> electrodes.The electrochemical detection method with the h<strong>and</strong> helddevice <strong>and</strong> biosensors is a rapid method to detect target algaein a water sample. Electrodes can be mass produced. Protocols<strong>and</strong> electrochemical readings of the h<strong>and</strong> held device aresimple <strong>and</strong> easy to use, read <strong>and</strong> interpret. This is useful <strong>for</strong>people with limited experience with the method.The h<strong>and</strong> held device has a st<strong>and</strong>ard operating procedure(SOP) with many manual steps. This has now been refinedwith many improvements resulting from the EU-project AL-GADEC. Today, most of the steps are automated (an automatedflow <strong>and</strong> heating chamber <strong>for</strong> the biosensors) whichnow allows the detection of 14 species in parallel. The initialsampling, filtering <strong>and</strong> RNA extraction steps remain the same.The present biosensor consists of a disposable sensor chipwith 16 electrodes (Diercks et al. 2008a). The redox reactiontakes place between the substrate probe <strong>and</strong> the signal probeto yield a flow of electrons. This allows <strong>for</strong> a electrochemi-71
IOC Manuals & Guides no 55Chapter 10 Electrochemical detection of toxic algae with a biosensorcal detection proportional to the RNA of the target capturedon the chips <strong>and</strong> thus to the number of cells in the watersample tested. Probes <strong>for</strong> other toxic algae (e.g., Alex<strong>and</strong>riumminutum <strong>and</strong> Gymnodinium catenatum) have been developed<strong>for</strong> their detection with this h<strong>and</strong> held device (Diercks et al.2008b). About 17 different toxic algae can now be detected,along with the negative <strong>and</strong> positive controls. These newlydeveloped probes are regularly reviewed <strong>for</strong> their specificity,since new sequences are added to the available online geneticdatabases daily. This cross check will help to determine ifthere is any cross reactivity with other marine organisms.The current detection limit of the h<strong>and</strong> held device can operatewith sample volumes of up to 8-10 Litres which is advantageousif only low cell densities of the target organismare present in the sample. In order to isolate target RNA, anappropriate cell density is required. The detection limit of theh<strong>and</strong> held device <strong>for</strong> Alex<strong>and</strong>rium ostenfeldii is ~ 16.00 ngµL -1 , with an average yield of ~ 0.02 ng cell -1 . This equates toca. 800 cells. A sampling volume of 6.4 l is required to obtaina detectable amount of RNA when the target organism ispresent at a cell density of 250 cells L -1 (Metfies et al. 2005).The manual isolation of RNA is currently the limiting factorof the system. This is because a certain quantity of highquality RNA is required <strong>for</strong> the assay. It has been found thatseparate users can isolate different qualities of rRNA from thesame sample with an equal number of algae cells present. Theresulting signal intensities cannot be compared to cell countsdetermined using another enumeration technique. Generationof calibration curves is required <strong>for</strong> each probe set. Avalidation of probe signals against total rRNA over the growthcycle of the target microalgae under different environmentalconditions has to be conducted to verify the calibrationcurves. This will allow the extrapolation of the electrochemicalreadings into more accurate values of cells per Litre. A highsample volume is required if the cell densities are low. Theautomated RNA isolation developed under the ALGADECproject will overcome some of these difficulties.AcknowledgementsSonja Diercks was supported by the EU-project ALGADEC(COOP-CT-2004-508435-ALGADEC) of the 6th FrameworkProgram of the European Union <strong>and</strong> the Alfred WegenerInstitute <strong>for</strong> Polar <strong>and</strong> Marine Research.Figure 10. Washing of chips in a petri dish with wash buffer.Figure 11. Schutron Thermoshaker <strong>for</strong> the fragmentation <strong>and</strong>denaturation of the sample.Figure 12. Measuring of chips with H<strong>and</strong>held device.Table 2. Hybridisation preparation.Detection of the species Negative control Positive control3.5 µL 4X Hybridasation buffer 3.5 µL 4X Hybridasation buffer 3.5 µL 4X Hybridasation buffer7.5 µL rRNA 1 µL Herring DNA (3480 ng µL -1 ) 1 µL Herring DNA (3480 ng µL -1 )1 µL Herring DNA (3480 ng µL -1 ) 1 µL DIG marked DNA probe (1.4 pM µL -1 ) 1 µL Test DNA (36 bases, 1.4 pM µL -1 )1 µL DIG marked DNA probe (1.4 pM µL -1 ) 8.5 µL milliQ water 1 µL DIG marked DNA probe (1.4 pM µL -1 )1 µl milliQwater 7.5 µl milliQwater72
<strong>Microscopic</strong> <strong>and</strong> Molecular Methods <strong>for</strong> Quantitative Phytoplankton AnalysisChapter 10 Electrochemical detection of toxic algae with a biosensorReferencesClark LC (1956) Monitor <strong>and</strong> control of blood <strong>and</strong> tissue oxygenation.Trans. Am. Soc. Artif. Intern. Organs 2:41-48Diercks S, Metfies K, Medlin, LK (2008a): Development <strong>and</strong> adaptationof a multiprobe biosensor <strong>for</strong> the use in a semi-automateddevice <strong>for</strong> the detection of toxic algae. Biosensors & Bioelectronics23: 1527-1533Diercks S, Metfies K, Medlin LK (2008b) Molecular probes <strong>for</strong> thedetection of toxic algae <strong>for</strong> use in s<strong>and</strong>wich hybridization <strong>for</strong>mats.J. Plankton Res. 30, 439 - 448Gau V, Ma S, Wang H, Tsukuda J, Kibler J, Haake DA (2005) Electrochemical<strong>molecular</strong> analysis without nucleic acid amplification.Methods 37:78-83Groben R, John U, Eller G, Lange M, Medlin LK (2004) Using fluorescently-labelledrRNA probes <strong>for</strong> hierarchical estimation of <strong>phytoplankton</strong>diversity – a mini-review. Nova Hedwigia 79:313-320Hartley HA, Baeumner AJ (2003) Biosensor <strong>for</strong> the specific detectionof a single viable B. anthracis spore. Anal. Bioanal. Chem376:319-327John U, Cembella A, Hummert C, Elbrächter M, Groben R, MedlinLK (2003) Discrimination of the toxigenic dinoflagellates Alex<strong>and</strong>riumtamarense <strong>and</strong> A. ostenfeldii in co occurring natural populationsfrom Scottish coastal waters. Eur. J. Phycol. 38:25-40Ludwig W, Strunk O, Westram R, Richter L, Meier H, Yadhukumar,Buchner A, Lai T, Steppi S, Jobb G, Förster W, Brettske I, GerberS, Ginhart AW, Gross O, Grumann S, Hermann S, Jost R, KönigA, Liss T, Lüßmann R, May M, Nonhoff B, Reichel B, StrehlowR, Stamatakis A, Stuckmann N, Vilbig A, Lenke M, Ludwig T,Bode A, Schleifer K-H (2004) ARB: a software environment <strong>for</strong>sequence data. Nucleic Acids Res 32:1363-1371Metfies K, Huljic S, Lange M, Medlin LK (2005) Electrochemicaldetection of the toxic dinoflagellate Alex<strong>and</strong>rium ostenfeldii with aDNA-biosensor. Biosens. Bioelectron 20:1349-1357Miller P, Scholin CA (1998) Identification <strong>and</strong> enumeration of cultured<strong>and</strong> wild Pseudo-nitzschia (Bacillariophyceae) using speciesspecificLSU rRNA-targeted fluorescent probes <strong>and</strong> filter-basedwhole cell hybridization. J. Phycol 34:371-382Rautio J, Barken KB, Lahdenpera J, Breitenstein A, Molin S, NeubauerP (2003) S<strong>and</strong>wich hybridisation assay <strong>for</strong> <strong>quantitative</strong> detectionof yeast RNAs in crude cell lysates. Microb. Cell Fact 2:4Scholin CA, Buck KR, Britschgi T, Cangelosi G, Chavez FP (1996)Identification of Pseudo-nitzschia australis (Bacillariophyceae)using rRNA-targeted probes in whole cell <strong>and</strong> s<strong>and</strong>wich hybridization<strong>for</strong>mats. Phycologia 35:190-197Simon N, Brenner J, Edvardsen B, Medlin LK (1997) The identificationof Chrysochromulina <strong>and</strong> Prymnesium species (Hyptophyta,Prymnesiophyceae) using fluorescent or chemiluminescentoligonucleotide probes: a means <strong>for</strong> improving studies on toxicalgae. Eur. J. Phycol. 32:393-401Zammatteo N, Moris P, Alex<strong>and</strong>re I, Vaira D, Piette J, Remacle J(1995) DNA probe hybridisation in microwells using a new bioluminescentsystem <strong>for</strong> the detection of PCR-amplified HIV-1proviral DNA. Virol. Methods 55:185-19773
IOC Manuals & Guides no 55Chapter 10 Electrochemical detection of toxic algae with a biosensorAppendixEquipment Supplier Cat. Number € US $Incubator ”Shake’n’Stack” VWR 7996 2310 3189Thermoheater ”Com<strong>for</strong>t” Eppendorf 5355R 2545 3512Vacuumpump Omnilab 9.880540 391 539Washbottle (250 mL) Omnilab 5051436 20 25Mini-Centrifuge Hereaus”Biofuge pico”Mini-BeadbeaterTable 1. Equipment <strong>and</strong> suppliers.Omnilab 7025235 938 1294Biospec products, Biospecproducts Inc, USA3110BX 715 986Nanodrop ND1000SpectrophotometerH<strong>and</strong>held DevicePeqlap Biotechnology 91-ND-1000 8995 12418Palm Instruments BV,Houten, Netherl<strong>and</strong>sPalmSens with PC software,Without Pocket PC3450 4739Sum approx. 19364 2670274
<strong>Microscopic</strong> <strong>and</strong> Molecular Methods <strong>for</strong> Quantitative Phytoplankton AnalysisChapter 11 Hybridisation <strong>and</strong> microarray fluorescent detection11 Hybridisation <strong>and</strong> microarray fluorescentdetection of <strong>phytoplankton</strong>Christine Gescher* 1 , Katja Metfies 1 <strong>and</strong> Linda K. Medlin 21Alfred Wegener Institute <strong>for</strong> Polar <strong>and</strong> Marine Research, Am H<strong>and</strong>elshafen 12, D-27570 Bremerhaven , Germany2Observatoire Océanologique de Banyuls-sur-Mer, Laboratoire Arago, 66651 Banyuls-sur-Mer, France*Author <strong>for</strong> correspondence e-mail: Christine.Gescher@web.deIntroductionThe introduction of DNA microarray technology in 1995 wasone of the latest <strong>and</strong> most powerful innovations in the fieldof microbiology. This technique allows the rapid acquisitionof copious data (Schena et al. 1995). It is a new experimentalapproach in <strong>molecular</strong> biology (Blohm <strong>and</strong> Guiseppi-Elie2001), which offers the possibility to analyse a large numberof samples using a range of different probes in parallel under adiverse spectrum of applications (Ye et al. 2001).Microarray technology was launched with a publication bySchena et al. (1995). Many functional genomic <strong>methods</strong>profit from microarrays, such as genome expression profiling,single nucleotide polymorphism detection <strong>and</strong> DNA resequencing(Lipshutz et al. 1999, Kauppinen et al. 2003, Ji <strong>and</strong>Tan 2004, Yap et al. 2004, Al-Shahrour et al. 2005, Broet etal. 2006, Gamberoni et al. 2006). Thus, DNA microarraysare a powerful <strong>and</strong> innovative tool that can facilitate monitoringin the marine environment.A microarray consists of DNA sequences that are applied tothe surface of a glass slide with special surface properties inan ordered array. It is based on a minimised <strong>for</strong>m of a dotblot(Gentry et al. 2006, Ye et al. 2001). A DNA microarrayexperiment involves microarray production, sample isolation<strong>and</strong> preparation, hybridisation <strong>and</strong> data analysis. Prior to thehybridisation, the target nucleic acid is labelled with a fluorescentdye, which can be incorporated directly to the nucleicacid or via indirect labelling of other substances (Cheung etal. 1999, Southern et al. 1999, Metfies et al. 2006). The hybridizationpattern is captured via fluorescent excitation in aspecial device, the microarray scanner (Ye et al. 2001).The application of DNA microarrays <strong>for</strong> the identification ofmarine organisms is a relatively new <strong>and</strong> innovative field ofresearch. It provides the possibility to analyse a large numberof targets (species or other taxa) in one experiment (Ye et al.2001), but is not yet widely applied to marine biodiversity<strong>and</strong> ecosystem science. For the use of microarray technologyas a st<strong>and</strong>ard tool with rapid <strong>and</strong> simple routine h<strong>and</strong>ling,further research into methodical optimisations is required(Peplies et al. 2003).A number of European research groups utilise DNA microarrays<strong>for</strong> the identification of marine organisms. The DNAmicroarrays, or the so called “phylochip”, have been used toidentify <strong>phytoplankton</strong> (Metfies <strong>and</strong> Medlin 2004, Ki <strong>and</strong>Han 2006, Medlin et al. 2006, Gescher et al. 2007), bacteria(Loy et al. 2002, Peplies et al. 2003, Peplies et al. 2004a,Peplies et al. 2004b, Lehner et al. 2005, Loy et al. 2005, Peplieset al. 2006) <strong>and</strong> fish (Kappel et al. 2003). Specific probesinitially developed <strong>for</strong> other hybridisation assays (e.g. wholecell) have been successfully modified <strong>and</strong> employed by themicroarray detection method.Basic principles of hybridisation, microarrayfluorescent detectionHybridisation refers to the reannealing of two single str<strong>and</strong>sof nucleic acids that contain complementary sequences. It utilisesthe basic physical structural property of DNA. DNA hasthe structure of a double helix with hydrogen bonds bindingthe two str<strong>and</strong>s of DNA together. When the DNA is heatedat a temperature above 90°C, the hydrogen bonds break<strong>and</strong> the DNA is subdivided in two separate complementarystr<strong>and</strong>s. When the temperature is decreased, the two separatestrains will reanneal. Complementary nucleic acids witha high degree of similarity anneal easier <strong>and</strong> will bind togethermore firmly. The probes on the DNA microarray representone str<strong>and</strong> of the DNA <strong>and</strong> if there are complementary sequencesin the examined sample, both st<strong>and</strong>s will hybridisetogether. This event can be detected by a fluorescence label onone of the two str<strong>and</strong>s that have bound together.The microarray experiment can be accomplished with ribosomalRNA (rRNA) or DNA, e.g. DNA-fragments generatedby a Polymerase Chain Reaction (PCR) from genomic DNA.When using this technique to identify microorganisms rRNAis advantageous over DNA because the cell contains rRNA ina high number that can be easily extracted using commercialkits. In contrast, if the number of copies of ribosomal genes inthe genomic DNA is too low then a PCR is needed to amplifythe target sequences.The utilisation of PCR-fragments can introduce a bias tothe analyses <strong>and</strong> it has been shown frequently that microbialcommunities may not be reflected correctly (Suzuki <strong>and</strong> Giovannoni1996, Wintzingerode et al. 1997, Simon et al. 2000,Speksnijder et al. 2001, Kanagawa 2003, Medlin et al. 2006).The hybridisation of RNA theoretically offers the possibilityof quantification <strong>and</strong> delivers a less biased view of true communitycomposition (Peplies et al. 2006). Possible disadvantagesare low yields of RNA from environmental samples <strong>and</strong>inhibition of extraction by complex organic molecules (Alm<strong>and</strong> Stahl 2000, Peplies et al. 2006). Furthermore, the RNAcontent can vary over the cell cycle, especially in prokayotes(Medlin 2003, Countway <strong>and</strong> Caron 2006).The method requires the use of a <strong>molecular</strong> laboratory. A cleanfume hood should be available because of ß-mercaptoethanol.DNA microarrays consist of glass microscope slides with particularsurface properties (Metfies <strong>and</strong> Medlin 2005). The77
IOC Manuals & Guides no 55Chapter 11 Hybridisation <strong>and</strong> microarray fluorescent detectionThe fundamentals ofThe hybridisation, microarray fluorescent detection methodScopeDetection <strong>and</strong> quantification of target <strong>phytoplankton</strong> species.At the time of publication of this Manual, this method is relativelynew <strong>and</strong> currently under development.Detection rangeThe detection range depends strongly on the sensitivity of thechosen probes. Calibration curves are required to correlate cellcounts with signal point intensities.AdvantagesAllows identification of target <strong>phytoplankton</strong> to the species level.DrawbacksAt the time of publication of this Manual, this microarray is stilla prototype <strong>and</strong> not available <strong>for</strong> general purchase. Probes <strong>for</strong>only a limited number of <strong>phytoplankton</strong> exist. Probes must bevalidated <strong>for</strong> each region where they are applied. The preparationof a calibration curve is required <strong>for</strong> each probe used.Type of training neededInstruction in setting up this technique should come from aperson with an in-depth knowledge <strong>and</strong> experience of <strong>molecular</strong>biology.a) per<strong>for</strong>m task: approximately five days are necessary to trainan individual in this method.b) troubleshoot <strong>and</strong> quality control: a skilled <strong>molecular</strong> biologistshould be available to solve any problems that may ariseusing this method.Essential equipmentA well equipped <strong>molecular</strong> biology laboratory, see Appendix,Table 1 <strong>for</strong> details of instrumentation.Equipment cost*Total set-up cost = approx. €55,000 or approx. $75,000 USSee Appendix, 2 Table 1 <strong>for</strong> details.Consumables, cost per sample**38 € (50 US $).Processing time per sample be<strong>for</strong>e analysisA trained person can process up to 8 samples in 6 hours:RNA Isolation = 1 hour;Labelling of RNA= 1 hour;Hybridisation= 4 hours.Analysis time per sampleA trained person can analyse up to 8 samples in 1 hour.Sample throughput per person per dayFour samples (with duplicates of each sample) or eight singlesamples.No. of samples processed in parallelFour samples (including duplicates) or eight single samplesHealth <strong>and</strong> Safety issuesRelevant health <strong>and</strong> safety procedures must be followed.The following chemical is particularly hazardous: β-Mercaptoethanol.*service contracts not included**salaries not included78
<strong>Microscopic</strong> <strong>and</strong> Molecular Methods <strong>for</strong> Quantitative Phytoplankton AnalysisChapter 11 Hybridisation <strong>and</strong> microarray fluorescent detectionFigure 1. <strong>Microscopic</strong>al view of a part of one glass slide with a gridof 12 spots of probes diluted in 3x SSC salt buffer.glass slide is coated with a special chemical surface e.g., withaminosilane, an epoxygroup or an aldehydegroup. The probesshould be ordered with the appropriate chemical group to belinked to the slide surface. Figure 1 shows a light microscopepicture of spots on a glass slide. Furthermore, the probes areimmobilised as spots on a glass slide in a defined pattern. Eachspot consists of many copies of an oligonucleotide probe thatis complementary to a specific target DNA sequence (Graves1999). The target (RNAs or DNAs) hybridises to the captureoligonucleotide probe on the microarray. The hybridisation isdetected via a fluorescent label that is attached to the targetsequence during PCR or directly to the RNA (Metfies <strong>and</strong>Medlin 2004). The flowchart of a microarray hybridisation isshown in Figure 2.It may be necessary to design new probes or to choose probesfrom other applications that are specific <strong>for</strong> the target taxonomicgroup or species. If the 18S rRNA gene sequence isused to design the probe, then it is important that the probebe designed using only the first 1000 base pairs (bp) of thegene.Figure 2. Flowchart of sample h<strong>and</strong>ling <strong>and</strong> hybridisation.MaterialsLaboratory FacilitiesThis method should be carried out in a <strong>molecular</strong> laboratorywith clean fumehood facilities.Required Equipment (essential)Microarray production requires the following equipment:A spotter <strong>and</strong> an oven that can be heated to 60°C. Orderedprobes can be spotted onto a glass slide using a commercialsupplier. It is more flexible <strong>and</strong> convenient to have a spotterin the laboratory. However, these machines are expensiveto purchase with prices ranging from €50,000-100,000 (US$67,000-134,000). It is advisable to outsource the spottingprocedure at the initial stage of use.RNA isolation requires the following equipment:• Mini-Beadbeater (e.g. BioCold Scientific Inc., USA)used to homogenise the algal cells with glass-beads• Conventional Mini-Centrifuge <strong>for</strong> small eppendorf tubes(1.0 mL <strong>and</strong> 1.5 mL)79
IOC Manuals & Guides no 55Chapter 11 Hybridisation <strong>and</strong> microarray fluorescent detectionThe hybridisation step requires the following equipment:• Thermoheater (Fig. 3)• Incubator• Bellydancer or shaker (Fig. 4)• Microarray scanner with software (Fig. 5)Chemicals <strong>and</strong> consumables• RNA isolation, labelling <strong>and</strong> purification:• Isolation: RNeasy Plant Mini Kit• Labelling of RNA: Biotin-ULS-Kit• Purification of labelled RNA: RNeasy MinElute CleanupKit• Removal of RNAse in fume hood <strong>and</strong> labware: RNase-Zap (Ambion Inc., Austin, USA)Figure 3. Thermoheater <strong>for</strong> denaturation of the labelled RNA.In<strong>for</strong>mation on the equipment, chemicals <strong>and</strong> consumablesused in this method are presented in the Appendix (Tables1-2) at the end of this chapter. Suppliers, Catalogue numbers<strong>and</strong> estimated cost in Euros <strong>and</strong> US Dollars are also listed inTables 1-2.MethodSample Preservation <strong>and</strong> Storage1 It is essential to begin with the correct amount of algalmaterial to obtain optimal RNA yield <strong>and</strong> purity withthe RNeasy columns. The required amount depends onthe target <strong>phytoplankton</strong> species <strong>and</strong> can range from 1 x10 4 to 1 x 10 7 cells L -1 ;2 Fresh or frozen tissue can be used. To freeze tissue <strong>for</strong>long-term storage, the material should be flash-frozenin liquid nitrogen <strong>and</strong> transfered immediately to -70 ºCwhere it can be stored <strong>for</strong> several months. When processing,the tissue should not be allowed to thaw duringweighing or h<strong>and</strong>ling prior to disruption in Buffer RLT.Homogenised lysates, in Buffer RLT, can also be stored at-70 ºC <strong>for</strong> several months;3 To process frozen lysates, thaw samples <strong>and</strong> incubate <strong>for</strong>15-20 minutes at 37 ºC in a water bath to dissolve salts;4 It is possible to store the hybridised microarrays <strong>for</strong> atleast one year at -20 ºC, although it is usually unnecessaryto keep them once they have been scanned. The reuseof “phylochips” <strong>for</strong> new hybridisations has been tested<strong>for</strong> expression analysis experiments where the microarrayswere reused 5 times (Dolan et al. 2001, Bao et al.2002);Figure 4. Washing of the microarrays on a belly dancer.Figure 5. Microarray scanner GenePix 4000B.RNA Isolation with the RNeasy Plant Mini Kit(Qiagen)5 Ribonucleases (RNases) are very stable <strong>and</strong> active enzymesthat break down RNA. They generally do not requirecofactors to function. As RNases are difficult toinactivate, even minute amounts are sufficient to destroyRNA. Plasticware or glassware, there<strong>for</strong>e, should not beused without first eliminating any possible trace of RNasecontamination. Care should be taken to avoid inadvertentlyintroducing RNases into the RNA sample duringor after the isolation procedure. Latex or vinyl glovesshould always be worn when h<strong>and</strong>ling reagents <strong>and</strong> RNAsamples to prevent RNase contamination from the skinsurface or dusty laboratory equipment. Gloves should bechanged frequently <strong>and</strong> tubes kept closed whenever possible.Samples should be kept on ice, particularly isolatedRNA, especially when aliquots are being pipetted. Theuse of sterile, disposable polypropylene tubes is recommendedthroughout. These tubes are generally RNasefree<strong>and</strong> do not require a pre-treatment to inactivateRNases. Glassware used <strong>for</strong> RNA work should be cleanedwith a detergent, thoroughly rinsed <strong>and</strong> oven baked at240 ºC <strong>for</strong> 4 or more hours be<strong>for</strong>e use;Important notes be<strong>for</strong>e getting starting6 Beta-Mercaptoethanol (ß-ME) must be added to BufferRLT be<strong>for</strong>e use. Beta-Mercaptoethanol is toxic so dispensein a fume hood <strong>and</strong> wear appropriate protectiveclothing. Add 10 µL ß-ME per 1 mL Buffer RLT. BufferRLT is stable <strong>for</strong> 1 month after the addition of ß-ME;7 Buffer RPE is supplied as a concentrate. Be<strong>for</strong>e using <strong>for</strong>the first time, add 44 mL of ethanol (96-100 %), as indi-80
<strong>Microscopic</strong> <strong>and</strong> Molecular Methods <strong>for</strong> Quantitative Phytoplankton AnalysisChapter 11 Hybridisation <strong>and</strong> microarray fluorescent detection(≥10000 rpm) to elute;23 To obtain a higher total RNA concentration, a secondelution step may be per<strong>for</strong>med by using the first eluate(from the previous step). Pipette the eluate back onthe column <strong>and</strong> centrifuge <strong>for</strong> 1 minute at ≥8000 x g(≥10000 rpm) to elute once again;24 Measure the concentration of the RNA with a Spectrophotometer(e.g. Nanodrop Spectrophotometer, Peqlab,Erlangen, Germany).Figure 6. Labelling of nucleic acids with Biotin-ULS (source:www.fermentas.com)cated on the bottle, to obtain a working solution.8 All steps of the RNeasy protocol should be per<strong>for</strong>medat room temperature (~20 ºC). Work quickly during theprocedure;9 All centrifugation steps are per<strong>for</strong>med at 20-25 ºC in ast<strong>and</strong>ard microcentrifuge;Harvesting of <strong>phytoplankton</strong> cells10 Harvest the cells by centrifugation or filtration;11 Discard the supernatant <strong>and</strong> process the cell pellet;RNA-Isolation12 Add 450 µL Buffer RLT with ß -ME to the cell pellet;13 Pipette the cells into an eppendorf cup containing glassbeads (212 µm- 300 µm <strong>and</strong> 312-600 µm) <strong>and</strong> homogenisethe cells in a bead beater <strong>for</strong> 20 seconds;14 Pipette the lysate directly onto a QIAshredder spin column(lilac colour) placed in 2 mL collection tube <strong>and</strong>centrifuge <strong>for</strong> 2 minutes at maximum speed;15 Carefully transfer the supernatant from the flow-throughfraction to a new microcentrifuge tube without disturbingthe cell debris pellet in the 2 mL collection tube.This supernatant/lysate is used in all subsequent steps;16 Add 0.5 volume (usually 225 µL) ethanol (96-100 %) tothe clear lysate, <strong>and</strong> mix immediately by pipetting. Donot centrifuge. Continue without delay;17 Apply the sample (usually 650 µL), including any precipitatethat may have <strong>for</strong>med, to an RNeasy mini column(pink colour) placed in a 2 mL collection tube. Close thetube gently <strong>and</strong> centrifuge <strong>for</strong> 15 seconds at ≥8000 x g(≥10000 rpm). Discard the flow-through;18 Reuse the collection tube in the next step;19 Add 700 µL Buffer RW1 to the RNeasy column. Closethe tube gently <strong>and</strong> centrifuge <strong>for</strong> 15 seconds at ≥8000 xg (≥10000 rpm) to wash the column. Discard the flowthrough<strong>and</strong> collection tube;20 Transfer the RNeasy column into a new 2 mL collectiontube (supplied with the kit). Pipette 500 µL Buffer RPEonto the RNeasy column. Close the tube gently <strong>and</strong> centrifuge<strong>for</strong> 15 seconds at ≥8000 x g (≥10000 rpm) towash the column. Discard the flow-through;21 Add another 500 µL Buffer RPE to the RNeasy column.Close the tube gently, <strong>and</strong> centrifuge <strong>for</strong> 2 minutes at≥8000 x g (≥10000 rpm) to dry the RNeasy silica gelmembrane;22 To elute the RNA, transfer the RNeasy column to a new1.5 mL collection tube. Pipette 30-50 µL RNase-free waterdirectly onto the RNeasy silica gel membrane. Closethe tube gently <strong>and</strong> centrifuge <strong>for</strong> 1 minute at ≥8000 x gLabelling of RNA with the Biotin-ULS-KitBackground: This Labelling Kit uses the Universal LinkageSystem (ULS) technique, which is based on the stable coordinativebinding of a platinum complex to nucleic acids.The platinum complex acts as a linker between a detectablemarker (label) molecule, i.e., fluorescein or biotin, <strong>and</strong>DNA or RNA. The marker is coupled directly to the nucleicacid without any significant interference. Universal LinkageSystem consists of a Pt complex stabilised by a chelating diamine.It has two binding sites, one of which is used to bind amarker. The other binding site is used to link the complex tothe aromatic nitrogen atoms of nucleobases <strong>and</strong> one nitrogenatom of guanine is strongly preferred (Fig. 6). The resultantPt-N bond is very stable both chemically <strong>and</strong> thermally.Features of the Biotin-ULS-Kit• One-step reaction.• Fast - only 30 minute to label the target.• Universal - any nucleic acid, independent of size orstructure can be labelled.• Easy to scale up <strong>and</strong> down. It allows labelling of as littleas 25 ng or as much as 10 µg of nucleic acid in a singlereaction25 Add 1 µL (= ½ U) of Biotin ULS reagent to 500 ng ofnucleic acid template;26 Adjust volume with labelling solution to 20 µL <strong>and</strong> mixwell;27 Incubate <strong>for</strong> 30 minutes at 85 ºC;28 Add 5 µL Stop solution <strong>and</strong> mix well;29 Incubate <strong>for</strong> 10 minutes at room temperature;30 Purify the solution with the RNeasy MinElute CleanupKit be<strong>for</strong>e hybridisation;Purification of labelled RNA with the RNeasy MinEluteCleanup Kit (Qiagen)31 Adjust sample to a volume of 100 µL with RNase-freewater. Add 350 µL of Buffer RLT <strong>and</strong> mix thoroughly;32 Add 250 µL of 96-100 % ethanol to the diluted RNA<strong>and</strong> mix thoroughly by pipetting. Do not centrifuge.Continue the next step immediately;33 Apply 700 µL of the sample to an RNeasy MinElute SpinColumn in a 2 mL collection tube. Close the tube gently<strong>and</strong> centrifuge <strong>for</strong> 15 seconds at ≥8000 x g (≥10000rpm). Discard the flow-through;34 Transfer the spin column into a new 2 mL collectiontube. Pipette 500 µL Buffer RPE onto the spin column.Close the tube gently <strong>and</strong> centrifuge <strong>for</strong> 15 seconds at≥8000 x g (≥10000 rpm) to wash the column. Discardthe flow-through;35 Add 500 µL of 80 % ethanol to the RNeasy MinEluteSpin Column. Close the tube gently, <strong>and</strong> centrifuge <strong>for</strong> 281
IOC Manuals & Guides no 55Chapter 11 Hybridisation <strong>and</strong> microarray fluorescent detectionFigure 7. Pipetting of hybridisation solution on one microarray.minutes at ≥8000 x g (≥10000 rpm) to dry the silica gelmembrane. Discard the flow through <strong>and</strong> collection tube;36 Transfer the RNeasy MinElute Spin Column into a new2 mL collection tube. Open the cap of the spin column<strong>and</strong> centrifuge in a microcentrifuge at full speed <strong>for</strong> 5minutes. Discard the flow through <strong>and</strong> collection tube;37 To elute the RNA, transfer the spin column to a new1.5 mL collection tube. Pipette 14 µL RNase-free waterdirectly onto the centre of the silica-gel membrane. Closethe tube gently <strong>and</strong> centrifuge <strong>for</strong> 1 minute at maximumspeed to elute;38 To obtain a higher total RNA concentration, a secondelution step may be per<strong>for</strong>med by using the first eluate(from the previous step);39 Measure the concentration of the RNA with a Spectrophotometer;Microarray Hybridisation40 The positive control in the microarray hybridisation experimentis a probe (ATGGCCGATGAGGAACGT)specific <strong>for</strong> a 250 bp fragment of the TATA-box bindingprotein(TBP) gene of Saccharomyces cerevisiae (Metfies<strong>and</strong> Medlin 2004);41 The gene is amplified with the primers TBP-F (5’-ATGGCC GAT GAG GAA CGT TTA A-3’) <strong>and</strong> TBP-R-Biotin (5’-TTT TCA GAT CTA ACC TGC ACC C- 3’)<strong>and</strong> is added to the hybridisation solution;42 A negative control probe that has no match to any sequencefound in the NCBI (National Center <strong>for</strong> BiotechnologyIn<strong>for</strong>mation) database should be used e.g. TCC-CCCGGGTATGGCCGC (Metfies <strong>and</strong> Medlin 2004);43 Pre-hybridisation step: incubate the microarrays in a microarraybox containing ~ 20 mL pre-hybridisation buffer[1X SET / 1 mg mL -1 BSA] <strong>for</strong> 60 minutes at thepredetermined hybridisation temperature (58 ºC). Subsequentlywash the microarrays briefly in deionised water<strong>and</strong> by centrifugation;44 Apply 30 µL of the 40 µL hybridisation solution to themicroarray. The solution contains labelled target nucleicacid dissolved in hybridisation buffer. The final concentrationof the target nucleic acid should be ~ 10 ng µL ‐1 .The solution should also contain the positive control(i.e. 250 bp PCR-fragment TBP from S. cerevisiae withbiotin-labelled primers) in a final concentration of 4.7 ngµL -1 ;45 Incubate the hybridisation solution <strong>for</strong> 5 minute at 94 ºCin a thermoheater (Fig. 3) to denature the target nucleicacid. The use of a special kind of coverslip, the Lifter Slipcoverslip (Implen, München, Germany) is recommendedto ensure an even dispersal of the hybridisation mixtureonto the microarray;46 Place the cover slip on the slide <strong>and</strong> pipette 30 µL of thehybridisation mixture under the cover slip (Fig. 7);47 Hybridise at 58 ºC <strong>for</strong> 1 hour in a wet chamber. A 50 mLFalcon-tube with a wet Whatman paper functions verywell as a moisture chamber. Apply approximately 1 mL ofhybridisation buffer onto the Whatman paper to obtainenough humidity in the chamber;48 After the hybridisation is complete, remove excessivetarget nucleic acid <strong>and</strong> unspecific bindings by stringentwashing of the microarrays. Remove the cover slip fromthe array <strong>and</strong> put the microarray into a Falcon-tube with50 mL wash buffer 1. Place the Falcon-tube on a bellydancer <strong>and</strong> shake <strong>for</strong> 10 minutes (Fig. 4). Repeat this stepwith wash buffer 2. Wash-buffer 1 contains: 2X SSC / 10mM EDTA / 0.05 % SDS; wash-buffer 2: 1X SSC / 10mM EDTA;49 Wash again <strong>for</strong> 5 minutes with increased stringency[wash-buffer 3: 0.2X SSC / 10 mM EDTA]. Whereasthe first washing buffer contains SDS, it is recommendedthat the next 2 washing buffers do not contain SDS. Thisis because residual SDS will generate high backgroundintensities on the microarray;50 Remove the last wash buffer <strong>and</strong> dry the microarrays bycentrifugation in the falcon-tube (approx. 3 minutes atapprox. 2000 rpm). There are also special microarraycentrifuges with only the optimal speed;Fluorescent Staining of the microarrays51 Visualise the hybridised biotinylated target nucleic acidsby staining the microarray <strong>for</strong> 30 minutes at room temperaturein a wet chamber containing 50 µL Streptavidin-Cy5 [0.1µg mL -1 Streptavidin / 1X hybridisation buffer];52 Remove excess stain by washing the microarrays twice<strong>for</strong> 5 minutes with wash-buffer 1 <strong>and</strong> once <strong>for</strong> 5 minuteswith wash-buffer 2. Carry out the washing steps atroom temperature <strong>and</strong> place the microarrays in a 50 mLFalkon-tube;53 Dry the microarrays by centrifugation (approx. 3 minutesat approx. 2000 rpm);Analysis54 Scan the microarray using the GenePix Axon 4000Bscanner at 635 nm;55 Analyse the obtained signal intensities with the GenePix6.0 software;56 Calculate the signal to noise-ratios according to Loy et al.(2002);57 All calculated ratios should be normalised to the signalof the TBP positive control. A schematic picture of theexcitation is shown in Figure 8.82
<strong>Microscopic</strong> <strong>and</strong> Molecular Methods <strong>for</strong> Quantitative Phytoplankton AnalysisChapter 11 Hybridisation <strong>and</strong> microarray fluorescent detectionlls L−1Formula <strong>for</strong> calculating results−1⎛ Positive cell count on whole filterCell concentrat ion ( cells L ) = ⎜⎝ Volume⎛ Positive cell count on whole filter ( N ) ⎞) = ⎜⎟ * 1000⎝ Volume of sample ( mL ) ⎠DiscussionThe utilisation of <strong>molecular</strong> <strong>methods</strong> has increased the potential<strong>for</strong> investigating the biodiversity of <strong>phytoplankton</strong> inthe marine environment. The identification of <strong>phytoplankton</strong>,especially of harmful algal species, is important froman ecological <strong>and</strong> economic point of view. Microorganismsdominate global biological diversity, in terms of their speciesnumbers, but their small size <strong>and</strong> lack of morphological featuresmake it difficult to assess their overall biodiversity.In the past, regular monitoring of <strong>phytoplankton</strong> has beenhampered by the lack of reliable morphological features insome groups of species. Even with the introduction of electronmicroscopy, it is difficult to make the correct classification,especially in picoplanktonic taxa or with hidden geneticdiversity in morphological indistinguishable species (Scholin1998, Zingone et al. 1999, Massana et al. 2002, Janson <strong>and</strong>Hayes 2006). As a result knowledge of the complexity of the<strong>phytoplankton</strong>ic ecosystems is still limited. Many species aresensitive to sample fixation (Gieskes <strong>and</strong> Kraay 1983) <strong>and</strong>some possess different life stages with varying morphologicalproperties (Partensky et al. 1988). The expertise of the scientistmay also influence the identification (Bornet et al. 2005,Godhe et al. 2007).The utilisation of microarrays <strong>for</strong> the detection <strong>and</strong> monitoringof marine microalgae, although a relatively new technique,has already undergone several trials (Metfies <strong>and</strong> Medlin2004, Ki <strong>and</strong> Han 2006, Medlin et al. 2006, Gescher etal. 2007). Previous work has shown that microarrays can beused <strong>for</strong> the identification of <strong>phytoplankton</strong> using 18S rDNAprobes at the class level (Metfies <strong>and</strong> Medlin 2004, Medlinet al. 2006). Ki <strong>and</strong> Han (2006) <strong>and</strong> Gescher et al. (2007)have also demonstrated the specificity of 18S <strong>and</strong> 28S rDNAprobes <strong>for</strong> the detection of harmful algae at the species level.Figure 8. Microarray detection.One drawback of the method is the dependency on the sequencedatabase <strong>for</strong> probe design. It is estimated that theknown rRNA sequence database is only a very small fractionof the overall biodiversity ( N present ) ⎞ in the environment.⎟The number of 18S rRNA sequences* 1000of sample ( mL )in public databases isconstantly growing. Developed probes ⎠ should be regularlychecked against all known sequences to ensure cross reactivitywith a non target organism does not occur.The the detection limit of the microarray depends on thesensitivity of the chosen probes. In general, a high samplingvolume of up to several Litres of seawater is required. This isespecially true if the number of cells present in the sample islow. Another limiting factor of the microarray method lies inthe manual isolation of RNA. The manual isolation of RNAfrom a set number of target cells can vary depending on theskill of the operator. This can result in different signal intensities<strong>and</strong> so the resulting cell counts cannot be compared. Theutilisation of an automatic device (e.g. pipetting robot) <strong>for</strong>RNA isolation may resolve this problem. The isolation of asufficient amount of RNA is very important because the targetRNA presents only a small fraction of the RNA isolatedfrom a wild sample.A calibration curve must be developed <strong>for</strong> each new probe tomonitor individual algal species. The signal must be validatedwith cell numbers. A good correlation of cell counts <strong>and</strong> RNAconcentration per cell with signal intensity is prerequisite <strong>for</strong> areliable analysis of field samples. Different physiological conditionsmay have an influence on the RNA content per cell.The development <strong>and</strong> evaluation of microarrays is time-consuming<strong>and</strong> costly, but once a microarray is well developed,it is a cost-effective, trusted <strong>and</strong> efficient tool to detect thetarget organism. Limitations <strong>and</strong> cost aside, the use of microarraysto answer ecological <strong>and</strong> biodiversity questions offers<strong>for</strong> the first time the possibility to analyse samples with a largenumber of different targets (species or other taxa) in parallel(Ye et al. 2001). One of the most likely future uses of microarraysin the field of <strong>phytoplankton</strong> ecology is to monitor thebiodiversity of <strong>phytoplankton</strong> over long-time scales (Medlinet al. 2006, Gescher et al. 2007c).AcknowledgementsChristine Gescher was supported by the EU-projectFISH&CHIPS (GOCE-CT-2003-505491).83
IOC Manuals & Guides no 55Chapter 11 Hybridisation <strong>and</strong> microarray fluorescent detectionReferencesAl-Shahrour F, Diaz-Uriarte R, Dopazo J (2005) Discovering <strong>molecular</strong>functions significantly related to phenotypes by combininggene expression data <strong>and</strong> biological in<strong>for</strong>mation. Bioin<strong>for</strong>matics21:2988-2993Alm EW, Stahl DA (2000) Critical factors influencing the recovery<strong>and</strong> integrity of rRNA extracted from environmental samples: useof an optimized protocol to measure depth-related biomass distributionin freshwater sediments. J Microbiol Meth 40:153-162Bao Z, Wenli M, Rong S, Ling L, Quiye G, Wenling Z (2002) Reuseof a stripped cDNA microarray. Br J Biomed Sci 59:118-119Blohm DH, Guiseppi-Elie A (2001) New developments in microarraytechnology. Curr Opin Biotech 12:41-47Bornet B, Antoine E, Francoise S, Marcaillou-Le Baut C (2005)Development of sequence characterized amplified region markersfrom intersimple sequence repeat fingerprints <strong>for</strong> the <strong>molecular</strong>detection of toxic <strong>phytoplankton</strong> Alex<strong>and</strong>rium catenella (Dinophyceae)<strong>and</strong> Pseudo-nitzschia pseudodelicatissima (Bacillariophyceae)from french coastal waters. J Phycol 41:704-711Broet P, Kuznetsov VA, Bergh J, Liu ET, Miller LD (2006) Identifyinggene expression changes in breast cancer that distinguishearly <strong>and</strong> late relapse among uncured patients. Bioin<strong>for</strong>matics 22:1477-1485Cheung VG, Morley M, Aguilar F, Massimi A, Kucherlapati R,Childs G (1999) Making <strong>and</strong> reading microarrays. Nat Genet21:15-19, (1 Suppl)Countway PD, Caron DA (2006) Abundance <strong>and</strong> distribution ofOstreococcus sp. in the San Pedro Channel, Cali<strong>for</strong>nia, as revealedby Quantitative PCR. Appl Environ Microbiol 72: 2496-2506Dolan PL, Wu Y, Ista LK, Metzenberg RL, Nelson MA, Lopez GP(2001) Robust <strong>and</strong> efficient synthetic method <strong>for</strong> <strong>for</strong>ming DNAmicroarrays. Nucleic Acids Res 29 :107Gamberoni G, Storari S, Volinia S (2006) Finding biological processmodifications in cancer tissues by mining gene expression correlations.BMC Bioin<strong>for</strong>matics 7:6Gentry TJ, Wickham GS, Schadt CW, He Z, Zhou J (2006) Microarrayapplications in microbial ecology research. Microbial Ecol52:159-175Gescher C, Metfies K, Medlin LK (2007) The Alex Chip - Developmentof a DNA chip <strong>for</strong> identification <strong>and</strong> monitoring of Alex<strong>and</strong>rium.Harmful Algae, 7 (4):485 - 494Gieskes WWC, Kraay GW (1983) Dominance of Cryptophyceaeduring the <strong>phytoplankton</strong> spring bloom in the central North Seaby HPLC analysis of pigments. Mar Biol 75:179-185Godhe A, Cusack C, Pedersen J, Andersen P, Anderson DM, BresnanE, Cembella A, Dahl E, Diercks S, Elbrächter M, EdlerL, Galluzzi L, Gescher C, Gladstone M, Karlson B, Kulis D,LeGresley M, Lindahl O, Marin R, McDermott G, Medlin LK,Naustvoll L-J, Penna A, Toebe K (2007) Intercalibration of classical<strong>and</strong> <strong>molecular</strong> techniques <strong>for</strong> identification of Alex<strong>and</strong>riumfundyense (Dinophyceae) <strong>and</strong> estimation of cell densities. HarmfulAlgae 6:56-72Graves D J (1999) Powerful tools <strong>for</strong> genetic analysis come of age.Trends Biotechnol 17:127-134Janson S, Hayes PK (2006) Molecular taxonomy of harmful algae.In: Granéli E, Turner JT (eds), Ecology of Harmful Algae. EcologicalStudies. Springer Verlag, Berlin, Heidelberg, p 9-21Ji L, Tan K-L (2004) Mining gene expression data <strong>for</strong> positive <strong>and</strong>negative co-regulated gene clusters. Bioin<strong>for</strong>matics 20:2711-2718Kanagawa T (2003) Bias <strong>and</strong> artifacts in multitemplate polymerasechain reactions (PCR). J Biosci Bioeng 96:317-323Kappel K, Westernhagen HV, Blohm DH (2003) Microarray-basedidentification of eggs <strong>and</strong> larvae from fish species common in theNorth Sea. Dechema Chip-Technology Meeting, Frankfurt, GermanyKauppinen S, Nielsen PS, Mouritzen P, Nielsen AT; Vissing H,Moller S, Ramsing NB (2003) LNA Microarrays in Genomics.PharmaGenomics:24-34Ki J-S, Han M-S (2006) A low-density oligonucleotide array study<strong>for</strong> parallel detection of harmful algal species using hybridizationof consensus PCR products of LSU rDNA D2 domain. BiosensBioelectron 21:1812-1821Lehner A, Loy A, Behr T, Gaenge H, Ludwig W, Wagner M, SchleiferK-H (2005) Oligonucleotide microarray <strong>for</strong> identificationof Enterococcus species. FEMS Microbiol Lett 246:133-142Lipshutz RJ, Fodor SP, Gingeras TR, Lockhart DJ (1999) High densitysynthetic oligonucleotide arrays. Nature Genet 21:20-24Loy A, Lehner A, Lee N, Adamczyk J, Meier H, Ernst J, SchleiferK-H, Wagner M (2002) Oligonucleotide microarray <strong>for</strong> 16SrRNA gene-based detection of all recognized lineages of sulfatereducingprokaryotes in the environment. Appl Environ Microbiol68:5064-5081Loy A, Schulz C, Lucker S, Schopfer-Wendels A, Stoecker K,Baranyi C, Lehner A, Wagner M (2005) 16S rRNA gene-basedoligonucleotide microarray <strong>for</strong> environmental monitoring of thebetaproteobacterial order ”Rhodocyclales”. Appl Environ Microbiol71:1373-1386Massana R, Guillou L, Díez B, Pedrós-Alió C (2002) Unveiling theorganisms behind novel eukaryotic ribosomal DNA sequencesfrom the ocean. Appl Environ Microbiol 68: 4554-4558Medlin LK (2003) Application of <strong>molecular</strong> techniques <strong>for</strong> geneticdifferentiation of microalgae. In: Norton T (ed) Out of the Past.Dataplus, Print & Design, Belfast. p 31-48Medlin LK, Metfies K, Mehl H, Wiltshire KH, Valentin K (2006)Picoeukaryotic plankton diversity at the Helgol<strong>and</strong> Time SeriesSite as assessed by three <strong>molecular</strong> <strong>methods</strong>. Microbial Ecol52:53-71Metfies K, Medlin LK (2004) DNA microchips <strong>for</strong> <strong>phytoplankton</strong>:The fluorescent wave of the future. Nova Hedwigia 79:321-327Metfies K, Medlin LK (2005) Ribosomal RNA probes <strong>and</strong> microarrays:Their potential use in assessing microbial biodiversity. In:Zimmer EA, Roalson, EH (eds) Methods in Enzymology, MolecularEvolution: Producing the Biochemical Data. AcademicPress, p 258-278Metfies K, Töbe K, Scholin CA, Medlin LK (2006) Laboratory <strong>and</strong>field applications of ribosomal RNA probes to aid the detection<strong>and</strong> monitoring of harmful algae. In: Granéli E, Turner JT (eds),Ecology of Harmful Algae. Ecological Studies. Springer Verlag,Berlin, Heidelberg, p 311-325Partensky F, Vaulot D, Couté A, Sournia A (1988) Morphological<strong>and</strong> nuclear analysis of the bloom <strong>for</strong>ming dinoflagellates Gyrodiniumcf aureolum <strong>and</strong> Gymnodinium nagasakiense (Dinophyceae).J Phycol 24: 408-415Peplies J, Glockner FO, Amann R (2003) Optimization strategies<strong>for</strong> DNA microarray-based detection of bacteria with 16SrRNA-targeting oligonucleotide probes. Appl Environ Microbiol69:1397-1407Peplies J, Glockner FO, Amann R, Ludwig W (2004a) Comparativesequence analysis <strong>and</strong> oligonucleotide probe design based on23S rRNA genes of Alphaproteobacteria from North Sea bacterioplankton.Syst Appl Microbiol 27:573-580Peplies J, Lau SCK, Pernthaler J, Amann R, Glockner FO (2004b)Application <strong>and</strong> validation of DNA microarrays <strong>for</strong> the 16S rR-NA-based analysis of marine bacterioplankton. Environ Micro-84
<strong>Microscopic</strong> <strong>and</strong> Molecular Methods <strong>for</strong> Quantitative Phytoplankton AnalysisChapter 11 Hybridisation <strong>and</strong> microarray fluorescent detectionbiol 6:638-645Peplies J, Lachmund C, Glockner FO, Manz W (2006) A DNAMicroarray Plat<strong>for</strong>m Based on Direct Detection of rRNA <strong>for</strong>Characterization of Freshwater Sediment-Related ProkaryoticCommunities. Appl Environ Microbiol 72:4829-4838Schena M, Shalon D, Davis RW, Brown PO (1995) Quantitativemonitoring of gene expression patterns with a complementaryDNA microarray. Science 270:467-470Scholin CA (1998) Morphological, genetic, <strong>and</strong> biogeographic relationshipsof the toxic dinoflagellates Alex<strong>and</strong>rium tamarense,A. catenella <strong>and</strong> A. fundyense. In: Anderson DM, Cembella AD,Hallegraeff GM [(eds), Physiological Ecology of Harmful AlgaeBlooms. Springer Verlag, Berlin, Heidelberg, p 13-27Simon N, Campbell L, Örnólfdóttir E, Groben R, Guillou L, LangeM, Medlin LK (2000) Oligonucleotide probes <strong>for</strong> the identificationof three algal groups by dot-blot <strong>and</strong> fluorescent whole-cellhybridization. J Eukaryot Microbiol 47:76-84Southern E, Mir K, Shchepinov M (1999) Molecular interactions onmicroarrays. Nat Genet 21:5-9 (1 Suppl)Speksnijder AGCL, Kowalchuk GA, De Jong S, Kline E, StephenJR, Laanbroek HJ (2001) Microvariation artifacts introduced byPCR <strong>and</strong> cloning of closely related 16S rRNA gene sequences.Appl Environ Microbiol 67:469-472Suzuki MT, Giovannoni SJ (1996) Bias caused by template annealingin the amplification of mixtures of 16S rRNA genes by PCR.Appl Environ Microbiol 62::625-630Wintzingerode FV, Goebel UB, Stackebr<strong>and</strong>t E (1997) Determinationof microbial diversity in environmental samples: pitfalls ofPCR-based rRNA analysis. FEMS Microbiol Rev 21:213-229Yap Y, Zhang X, Ling M, Wang X, Wong Y, Danchin A (2004) Classificationbetween normal <strong>and</strong> tumor tissues based on the pairwisegene expression ratio. BMC Cancer 4:72Ye RW, Wang T, Bedzyk L, Croker KM (2001) Applications of DNAmicroarrays in microbial systems. J Microbiol Meth 47:257-272Zingone A, Sarno D, Forlani G (1999) Seasonal dynamics in theabundance of Micromonas pusilla (Prasinophyceae) <strong>and</strong> its virusesin the Gulf of Naples (Mediterranean Sea). J Plankton Res21:2143-215985
IOC Manuals & Guides no 55Chapter 11 Hybridisation <strong>and</strong> microarray fluorescent detectionAppendixTable 1. Equipment <strong>and</strong> suppliers.Equipment Supplier Cat. Number € US $Mini-BeadbeaterMini-Centrifuge Hereaus”Biofuge pico”Nanodrop ND1000SpectrophotometerBiospec products, Biospec 3110BX 715 986products Inc, USAOmnilab, Germany 7025235 938 1294Peqlap Biotechnology,Germany91-ND-1000 8995 12418Incubator ”Shake’n’Stack” VWR, Germany 7996 2310 3189Thermoheater ”Com<strong>for</strong>t” Eppendorf, Germany 5355R 2545 3512Shaker (Bellydancer) Sigma Aldrich, Germany Z36, 761-3 1400 1800Scanner <strong>and</strong> software(GenePix 4000B device <strong>and</strong>GenePix Pro.6.0 software)Molecular DevicesCorporation, USA97-0002-00 40000 51000Sum approx. 56903 74199Table 2. Chemicals <strong>and</strong> suppliers.Chemical Supplier Cat. Number € US $Spotting (per slide)Commercial supplier or withown spotting device- 75 100RNeasy Mini Plant Kit Qiagen Inc., USA 74904 268 370Biotin-ULS Kit Fermentas Inc., USA K0631 500 640RNeasy MinElute Cleanup Kit Qiagen Inc.,USA 742043 235 300EDTA Sigma Aldrich, Germany E5134 80 102Citric Acid Merck KGaA, Germany 231211 25 32Sodium chloride NaCl Sigma Aldrich, Germany S9888 23 29SDS Merck KGaA, Germany L4390 40 51Bovine Serum Albumin BSA Sigma Aldrich, Germany A2153 30 38Trizma Base Sigma Aldrich, Germany T_1503 80 102Triton x-100 Merck KGaA, Germany 648466 33 42Ethanol, pro Analysis Merck KGaA, Germany 1,009,832,500 73 931 probe (18 bases, withAminolink) + Positive control,Negative controlThermo Electron, Gemany - 100 127Herring-Sperm DNA Roche, Germany 223646 91 116Streptavidin-CY5 KPL, USA 079-30-00 250 31986
<strong>Microscopic</strong> <strong>and</strong> Molecular Methods <strong>for</strong> Quantitative Phytoplankton AnalysisChapter 12 Semiautomated s<strong>and</strong>wich hybridisation12 Toxic algal detection using rRNA-targeted probes in a semiautomateds<strong>and</strong>wich hybridization <strong>for</strong>matRoman Marin III* <strong>and</strong> Christopher A. ScholinMonterey Bay Aquarium Research Institute (MBARI) 7700 S<strong>and</strong>-holdt Rd., Moss L<strong>and</strong>ing, CA 95039-0628, USA*Author <strong>for</strong> correspondence e-mail: maro@mbari.orgIntroductionThe S<strong>and</strong>wich Hybridisation Assay (SHA) provides a simple<strong>and</strong> rapid means to detect <strong>and</strong> estimate cell density of avariety of algal species associated with harmful algal blooms(HABs). Results from the SHA system can discriminate tospecies level using both cultured <strong>and</strong> natural samples. Havingthis level of discrimination without the need <strong>for</strong> microscopy<strong>and</strong> advanced training in taxonomy, gives researchers,public health officials <strong>and</strong> water quality managers a powerfultool to rapidly assess changing HAB communities. The SHAsystem uses species-specific, ribosomal RNA (rRNA) targetedDNA probes that are applied using a semi-automated roboticprocessor (Scholin et al. 1996, 1997, 1999, Greenfield et al.2008). Currently, DNA probes <strong>for</strong> Pseudo-nitzschia spp., Alex<strong>and</strong>riumspp., Heterosigma akashiwo, Chattonella spp., <strong>and</strong>Fibrocapsa japonica are available (Scholin et al. 2004). Othersprobes include those <strong>for</strong> Coccholodinium polykrikoides (Mikulskiet al. 2008), a variety of Karenia spp., Karlodinium veneficum<strong>and</strong> Gymnodinium aureolum (Haywood et al. 2007).In New Zeal<strong>and</strong> the SHA method has gained internationalaccreditation <strong>and</strong> is used to regulate shellfish harvests (e.g. Ayerset al. 2005 <strong>and</strong> references therein). Recent progress madeon assays <strong>for</strong> invertebrates (Goffredi et al. 2006), includingthe invasive European green crab (Jones et al. 2008), <strong>and</strong> marinebacteria (Preston, 2009) offer opportunities <strong>for</strong> use of theSHA <strong>for</strong>mat to detect many other organisms as well.Basic Principles of S<strong>and</strong>wich HybridisationThe SHA referred to here (after Scholin et al. 1996, 1999,Greenfield et al. 2008) employs two DNA probes that targetribosomal RNA (rRNA) sequences. Assays <strong>for</strong> both the large<strong>and</strong> small subunit (LSU, SSU) rRNA have been implemented.Assays are per<strong>for</strong>med using pre-filled 96 well microplates<strong>and</strong> a robotic processor supplied by Saigene Biotech Inc. Acapture probe complementary to a variable sequence is attachedto a mechanical solid support (prong in a s<strong>and</strong>wichhybridisation machine), which is then submerged into theprepared sample <strong>and</strong> hybridizes with the target molecule ifpresent. Captured molecules are then washed to remove anyunbound material. To detect the captured molecules, a secondhybridisation step is initiated using a DNA probe conjugatedto a signal probe. This probe is targeted to a more conservedregion of the captured fragment. The resulting “s<strong>and</strong>wich” ofcapture probe/target molecule/signal probe is detected usingan enzymatically-driven colorimetric reaction. Figure 1 providesa schematic view of the s<strong>and</strong>wich hybridisation chemistrydescribed above (<strong>for</strong> details see Greenfield et al. 2008).The basic steps of the SHA method are:FRONTWell H1 Collect sample onto a filter,2 Lyse sample using a chaotropic buffer (disrupts <strong>and</strong> denaturesthe 3-D structure of macromolecules) <strong>and</strong> heat,3 Filter lysate,4 Load sample lysate into 96-well plate,5 Run SHA processor (automated),6 Record colour development (O.D. 650 <strong>and</strong> 450nm),7 Compare results against st<strong>and</strong>ard curves to estimateabundance of target species.Laboratory FacilitiesBACKWell AFigure 1. Schematic view of the s<strong>and</strong>wich hybridisation chemistryThe SHA system requires a typical laboratory setting that isprotected from direct sunlight, excessive dust, <strong>and</strong> temperatureextremes.Essential Equipment(<strong>for</strong> more details see Appendix, Table 1 at the end of this chapter)• Bench top processor (after Scholin et al. 1999)• 96-well Microplate reader that can read wavelengths 650nm <strong>and</strong> 450 nm• Software to record microplate data <strong>and</strong> apply data conversionalgorithm• Refrigerated storage (2º to 8ºC)• Vacuum filter manifold• 85 ºC heat block• 12-channel multiple pipette (30-300 µL)87
IOC Manuals & Guides no 55Chapter 12 Semiautomated s<strong>and</strong>wich hybridisationThe fundamentals ofThe s<strong>and</strong>wich hybridisation methodScopeDetection <strong>and</strong> quantification of a target <strong>phytoplankton</strong> speciesusing ribosomal RNA-targeted, DNA probe-based assays.Detection rangeDetection per<strong>for</strong>mance is unique to each probe set used in theSHA system.AdvantagesThe SHA system provides a robust <strong>and</strong> simple semi-automatedmethod to detect <strong>and</strong> estimate cell abundances of targetspecies.DrawbacksProbes are only available <strong>for</strong> a limited number of target species.Specificity of probes must be established on a regional basis.This system may not be suitable <strong>for</strong> detection of very rare targetsequences.Type of training neededInstruction in setting up this technique should come from aperson with an in-depth knowledge <strong>and</strong> experience of <strong>molecular</strong>biology. A minimum of three days are needed <strong>for</strong> to covertheory, operation, data processing, etc. A skilled <strong>molecular</strong> biologistshould be available to solve any problems that may ariseusing this method.Essential EquipmentSHA semi-robotic processor, microplate reader, heating block,filtration manifold, 12-channel <strong>and</strong> single channel micropipettors.Equipment cost*SHA semi-robotic processor, €5139 (US $7500)Total set-up cost = €14197 (US $20666).See Appendix, Table 1 <strong>for</strong> detailsConsumables, cost per sample**€5-7 (US $7-10).Processing time per sample be<strong>for</strong>e analysis15-20 minutes (h<strong>and</strong>s-on)Analysis time per sample75 minutes (h<strong>and</strong>s-off).Sample throughput per person per day30-40 samples in an 8 hour day given 1 processor.No. of samples processed in parallel6, 8, or 12 samples with replicates 4, 3, or 2, respectively.Health <strong>and</strong> Safety issuesRelevant health <strong>and</strong> safety procedures must be followed. Thelysis <strong>and</strong> signal probe buffers contain guanidine thiocyanate,which can damage skin <strong>and</strong> eyes.*service contracts not included**salaries not included88
<strong>Microscopic</strong> <strong>and</strong> Molecular Methods <strong>for</strong> Quantitative Phytoplankton AnalysisChapter 12 Semiautomated s<strong>and</strong>wich hybridisationFigure 2. Heating block set to 85ºC used <strong>for</strong> sample lysis.• 100-1000 µL single channel pipette• Cold storage <strong>for</strong> samples: liquid nitrogen is preferred,-80 o C <strong>and</strong> –20 o C (e.g., freezer or dry ice) can also be effective<strong>for</strong> storing archival samples (filters)•Chemicals <strong>and</strong> Consumables(<strong>for</strong> more details see Appendix, Table 2 at the end of thischapter)• 25mm hydrophilic Durapore filter• 2mL cryovial• 13mm syringe filter• 5cc syringe• Polypropylene tubes 12X 75mm• 10% H 2SO 4• filling trays/pipette tipsProbesThe suite of SHA probes currently available <strong>for</strong> HAB spp.include the following:Figure 3. Three-position vacuum filter manifold used tocollect particulate fraction of water sample.Figure 4. Filter, sample side in, being placed in cryovial <strong>for</strong>archival <strong>and</strong>/or lysis.DiatomsPseudo-nitzschia australis (<strong>and</strong> other diatoms below, Scholinet al. 1999)Pseudo-nitzschia multiseriesPseudo-nitzschia pungensPseudo-nitzschia pseudoelicatissima/multiseries complexDinoflagellatesAlex<strong>and</strong>rium tamerense/catenella/fundyense (North Americanribotype, Matweyou et al. 2004, Anderson et al. 2005)Cochlodinium polykrikoides (Mikulski et al. 2008)Gymnodinium aureolum (<strong>and</strong> other dinoflagellates below,Haywood et al. 2007)Karenia brevisKarenia mikimotoiKarenia selli<strong>for</strong>misKarenia papilionacaeKarlodinium veneficumRaphidophytesHeterosigma akashiwo (<strong>and</strong> others below, Tyrrell et al. 2001,2002, Scholin et al. 2004)Fibrocapsa japonicaChattonella antiqua/subsalsaMethodFigure 5. Addition of lysis buffer to cryovial with filter.Figure 6. After lysis, lysate is syringe filtered into clean tube.Preparation to run samples1 Turn on heating blocks <strong>for</strong> sample lysis (Fig. 2) <strong>and</strong> processor<strong>and</strong> check that desired temperatures are at theirproper values. Lysis is carried out at 85 ºC. The processorplate should provide a temperature of 28-30 ºC.2 Obtain necessary lysis tubes <strong>for</strong> runs or alternatively label2 mL cryovials <strong>for</strong> storage of sample filters in liquid nitrogen<strong>for</strong> later analysis (see below).3 Start the microplate reader.4 If using pre-made plates, remove seal <strong>and</strong> let it reach roomtemperature protected from light <strong>and</strong> dust. If required,dispense reagents into 96-well microplate as shown in theinstruction booklet that comes with materials suppliedby Saigene Corporation (see also Greenfield et al. 2006).When dispensing reagents to a microplate use barrier tips89
IOC Manuals & Guides no 55Chapter 12 Semiautomated s<strong>and</strong>wich hybridisationto minimise cross-well contamination. Dispense 0.25 mLper well. Do not blow out small amounts of fluids followingprimary delivery of reagents <strong>and</strong> samples to theplate or excessive bubbles will <strong>for</strong>m in the well; bubblescan interfere with the assay.Sample, plate <strong>and</strong> prong h<strong>and</strong>ling5 Protect plate <strong>and</strong> sample from sunlight <strong>and</strong> excessiveheat. Samples should be filtered <strong>and</strong> lysed as soon as possible,or filters can be archived <strong>for</strong> later analysis by rollingthe filter into a cryovial (particles away from the tube wall<strong>and</strong> freezing the filters in liquid nitrogen or alternativecold storage). Use plate within 1 hour after removingseal <strong>and</strong>/or dispensing reagents. Prongs should remain inpackage until used. H<strong>and</strong>le prongs with <strong>for</strong>ceps touchingonly the strip, or backbone, that connects the 12 prongs;avoid touching the prongs themselves. Store prongs at4-8 ºC with packaging <strong>and</strong> desiccant provided.Sample filtration6 Samples should be collected using a vacuum manifoldat a vacuum pressure of approximately 100-150 mmHg(Fig. 3). Filter samples onto hydrophilic Durapore filters(generally 0.65-0.45 µm pores size; Millipore). Thevolume filtered should be no more than what can passthrough the filter in about 20 minutes. Typical samplevolumes are 200 to 400 mL of whole water. Samples thathave been pre-concentrated (e.g. net tow or sieve) canalso be collected on the Durapore filter as well.Archival <strong>and</strong> Lysis of Sample7 After filtering, place filter membrane into a 2 mL cryovial.Place the filter with the sample side facing away fromthe tube wall. Do not crumple the filter <strong>and</strong> be sure topush the filter to bottom of the tube (Fig 4). If sample isto be archived, cap the 2 mL cryovial <strong>and</strong> store in liquidnitrogen without lysis buffer.8 To process, add 1-2 mL of lysis buffer to cryovial withfilter <strong>and</strong> cap it tightly (Fig 5). Place cryovial in heatingblock with wells half filled with water to enhance heattransfer (Fig. 2). Heat <strong>for</strong> 5 minutes total with a brieffinger vortex after 2.5 minutes.9 After heating, allow lysate to cool <strong>for</strong> 5 minutes. Use lysatewithin 20 minutes of preparation.10 Remove plunger from a 5 cc disposable syringe (Becton<strong>and</strong> Dickinson).11 Install a 13 mm, 0.45 µm Millex-HV (Millipore) filteronto the syringe.12 Place tip into a clean polypropylene collection tube, addlysate to syringe barrel <strong>and</strong> push lysate through filter untilfoam appears at the tip of filter (Fig. 6). Lysates from replicatesamples may be combined to yield a larger volumeof lysate from a given sample.13 The lysate is now ready to be loaded onto the plate samplewell (row H).Processing14 Load 0.25 mL filtered lysate per sample well (Fig. 7).15 Load prong onto processor arm <strong>and</strong> secure spring clip.Do not h<strong>and</strong>le prong with bare h<strong>and</strong>s. Hold prong by thebackbone with tweezers <strong>and</strong> avoid scraping the prongsagainst the processor arm.Figure 7. Lysate (0.25 mL) is added to appropriate samplewells on microplate.Figure 8. Microplate being placed on processor afterprongs added to processor arm.Figure 9. Processor being started after plate is positionedon heater base.Figure 10. Microplate is placed on microplate readercradle; optical density is recorded at 650nm <strong>for</strong> row “A”(wells in which colour development has occurred).Figure 11. After microplate is read at 650nm, row “A” is acidifiedwith 50 µL of 10% H 2SO 4;optical density is recorded at 450 nm <strong>for</strong>row “A”. The measure at 650 nm is considered low sensitivity whilethat at 450 nm is considered high sensitivity. For positive samples,the optical density at 450 nm should be roughly 2X that at 650 nm.90
<strong>Microscopic</strong> <strong>and</strong> Molecular Methods <strong>for</strong> Quantitative Phytoplankton AnalysisChapter 12 Semiautomated s<strong>and</strong>wich hybridisation16 Mount 96 well microplate onto processor, make sure tocentre the microplate on the heating plate (Fig. 8).17 Push the “RUN” button (Fig. 9) <strong>and</strong> make sure that theprongs enter the wells without touching the sides of thewells. The plate will be ready to read in just over an hour.A digital timer will display time remaining; the counterwill read “0” approximately 90 seconds be<strong>for</strong>e the processis actually complete. The processor will display a messageindicating that the reaction is complete, <strong>and</strong> plate isready to be read.Reading the Plate18 When the processor is finished, immediately read theplate(s) (Fig. 10).19 First read the plate at 650 nm.20 Next acidify row A with 50 µL of 10 % H 2SO 4(add <strong>and</strong>mix using a 12-channel pipette <strong>and</strong> avoid introduction ofbubbles) (Fig. 11).21 After all bubbles have popped (~10-45 seconds) readplate at 450 nm.Data ProcessingTo calculate the concentration of target in a sample, the assayrequires that you establish an empirically derived dose responsecurve that relates optical density (O.D.) to a knownnumber of cells per well of lysate (see Greenfield et al. 2008,Haywood et al. 2007, Ayers et al. 2005 <strong>for</strong> details in establishinga dose response curve). Using optical density (fromthe assay), the dose response curve, sample volume <strong>and</strong> lysisbuffer volume (used to lyse the sample) you can estimate thetarget abundance in the sample. Below is the equation used toconvert cells per well to cells per mL.⎛⎜⎝cellswell⎞⎟⎠x0.25Cells per mL in sample wellmL lysate⎛ filter ⎞ Y mL lysatex⎜⎟ x⎝X mL sample⎠filterHere is an example of how you use the above equation toestimate target abundance in a sample. You filter 500mL (X)of water onto a filter <strong>and</strong> lyse this sample in 2.0 mL of lysisbuffer (Y). Using the SHA system you obtain an O.D. thattranslates to 625 cells per well (from the dose response curve).Then using the <strong>for</strong>mula you estimate a target abundance of10 cells per mL in your sample.⎛⎜⎝625 cellswell⎞⎟⎠x0 . 25wellmLlysate=10 cellsmL of sample⎛ filter ⎞ 2 mL lysatex⎜⎟ x⎝ 500 mL sample⎠filterControlsPositive <strong>and</strong> negative controls are available to check systemintegrity <strong>and</strong> per<strong>for</strong>mance (e.g. Greenfield et al. 2006).Sample Collection <strong>and</strong> PreservationSamples should be run or archived as soon as possible aftercollection. Prior to filtration, samples should be kept cool <strong>and</strong>protected from excessive light. If the sample cannot be runwithin several hours it should be filtered <strong>and</strong> stored frozen. Asample stored in liquid nitrogen can be held <strong>for</strong> up to 1 yearor longer. Samples can also be stored in a -80 ºC freezer or ondry ice <strong>for</strong> up to 1 week. It may be possible to store preservedsamples at room temperature as well (see Tyrrell et al. 2002).Discussion <strong>and</strong> system considerationsThe goal of SHA system is to give the research/monitoringcommunity a method to quickly <strong>and</strong> conveniently screensamples <strong>for</strong> a variety of HAB species. Once samples are collected,processing takes approximately 1.25 hours. No targetamplification is required so problems that can affect amplificationbased systems (e.g. extensive sample h<strong>and</strong>ling, PCRinhibition) are avoided. The absolute detection level of theSHA system is dependant on the designs of the capture <strong>and</strong>signal probes. An important feature of the SHA system is thatit is relatively insensitive to biomass, so techniques such assieving to collect large volumes of sample can be used withoutimpacting system per<strong>for</strong>mance, provided proper controlexperiments have been per<strong>for</strong>med to verify assay results froma given region <strong>and</strong> wide range of samples. Further increasesin sensitivity can also be achieved by lysing the sample in asmaller volume of lysis buffer to increase target cell concentration.The SHA system is not suitable <strong>for</strong> very rare targets (e.g.single copy genes); in those cases some kind of amplificationtechnique may be desirable.All <strong>methods</strong> relying on <strong>molecular</strong> probes <strong>for</strong> detection canbe subject to cross-reaction with non-target species. There<strong>for</strong>eafter an initial positive result, an alternative method (microscopy,toxin detection, PCR, etc.) should be used to confirmresults until such time that confidence in the efficacy of probeis known. Some probes may work well <strong>for</strong> certain species incertain regions, but not all probes will work equally well indifferent geographic regions. Moreover, species designationsas defined using traditional criteria (morphology, ultrastructure,pigments, etc.) may not agree with those based on rRNAsequence identity (e.g. see Scholin et al. 2004, Ayers et al.2005, Lundholm et al. 2006). Provisions should also be madeto store replicate samples in case of system failure or if resultsrequire further analysis or reconfirmation is desired.Use of the SHA system requires that probes be available <strong>for</strong>the target species of interest. Currently, probes are available<strong>for</strong> a variety of HAB spp. (see above) as well as other organisms.The creation of probes <strong>for</strong> this system often requiresiterative probe design (trial <strong>and</strong> error) which can incur considerabletime <strong>and</strong> expense. Ideally, cultures of the targetedspecies are used to create calibration curves <strong>and</strong> to spot checkthe system when reagent batches are changed.The SHA system uses chemistry that is designed to work at30 ºC. If the ambient temperature exceeds this value, the systemwill not function properly <strong>and</strong> steps to lower ambienttemperature will need to be taken. Some of the reagents usedin the SHA system are required to be refrigerated <strong>and</strong> protectedfrom direct sunlight.Acknowledgements91
IOC Manuals & Guides no 55Chapter 12 Semiautomated s<strong>and</strong>wich hybridisationDevelopment <strong>and</strong> application of the SHA <strong>for</strong> HAB researchhave been sponsored in large part by grants from the David<strong>and</strong> Lucille Packard Foundation (allocated by the MontereyBay Aquarium Research Institute), the National ScienceFoundation (9602576 <strong>and</strong> OCE-031422), <strong>and</strong> the NationalOceanic Atmospheric Administration Saltonstall-KennedyGrant Program (NOAA NA57D009) to C.A.S.ReferencesAnderson DM, Kulis DM, Keafer BA, Gribble KE, Marin R, ScholinCA (2005) Identification <strong>and</strong> enumeration of Alex<strong>and</strong>riumspp. from the Gulf of Maine using <strong>molecular</strong> probes. Deep-SeaRes II 52:2467-2490Ayers K, Rhodes L, Tyrrell J, Gladstone M, Scholin C (2005) Internationalaccreditation of s<strong>and</strong>wich hybridisation assay <strong>for</strong>matDNA probes <strong>for</strong> micro-algae. N. Z. J. Mar. Freshwater Res.39:1225–1231Greenfield D, Marin III R, Doucette GJ, Mikulski C, Jensen S, RomanB, Alvarado N, Scholin CA. (2008) Field applications of thesecond-generation Environmental Sample Processor (ESP) <strong>for</strong>remote detection of harmful algae: 2006-2007. Limnology <strong>and</strong>Oceanography: Methods 6: 667-679.Greenfield DI, Marin III R, Jensen S, Massio E, Roman B, FeldmanJ, Scholin C (2006) Application of the Environmental SampleProcessor (ESP) methodology <strong>for</strong> quantifying Pseudo-nitzschiaaustralis using ribosomal RNA-targeted probes in s<strong>and</strong>wich <strong>and</strong>fluorescent in situ hybridisation. Limnol Oceanogr Methods4:426-435.Goffredi SK, Jones W, Scholin CA, Marin R, Hallam S, VrijenhoekRC (2006) Molecular detection of marine larvae. Marine Biotechnology8: 149-160.Haywood AJ, Scholin CA, Marin III R, Steidinger KA, Heil CA,Ray J (2007) Molecular detection of the brevetoxin-producingdinoflagellate Karenia brevis (Dinophyceae) <strong>and</strong> closely relatedspecies using ribosomal RNA probes <strong>and</strong> a semi-automated s<strong>and</strong>wichhybridization assay. J Phycol 43:1271–1286Jones WJ, Preston C, Marin III R, Scholin C, Vrijenhoek R (2008)A Robotic Molecular Method <strong>for</strong> in situ Detection of Marine InvertebrateLarvae. Mol Ecol Resour 8:540-550Lundholm N, Moestrup Ø, Kotaki Y, Scholin C, Miller P (2006)Inter- <strong>and</strong> intraspecific variation of the Pseudo-nitzschia delicatissima-complex(Bacillariophyceae) illustrated by rRNA probes,morphological data <strong>and</strong> phylogenetic analyses identification of P.decipiens <strong>and</strong> P. dolorosa spp. Nov. J Phycol 42:464-481Matweyou JA, Stockwell DA, Scholin CA, Hall S, Trainer VL, RayJD, Whitledge TE, Childers AR, Plumley FG (2004) Use of Alex<strong>and</strong>riumrRNA targeted probes to predict PSP events on KodiakIsl<strong>and</strong>, Alaska. In: Steidinger KA, L<strong>and</strong>sberg JH, Tomas CR, VargoGA (eds) Harmful Algae 2002. Florida Fish <strong>and</strong> Wildlife ConservationCommission, Florida Institute of Oceanography, <strong>and</strong>Intergovernmental Oceanographic Commission of UNESCO, St.Petersburg, Florida, USA., p 267-269Mikulski CM, Park YT, Jones KL, Lee CK, Lim WA, Lee Y, ScholinCA, Doucette GJ (2008) Development <strong>and</strong> field applicationof rRNA-targeted probes <strong>for</strong> the detection of Cochlodiniumpolykrikoides Margalef in Korean coastal waters using whole cell<strong>and</strong> s<strong>and</strong>wich hybridization <strong>for</strong>mats. Harmful Algae 7:347-359Preston C., Marin III R, Jenson S, Feldman J, Massion E, De-Long E, Suzuki M, Wheeler K, Cline D, Alvarado N, ScholinC. (2009) Near real-time, autonomous detection of marine bacterioplanktonon a coastal mooring in Monterey Bay, Cali<strong>for</strong>nia,using rRNA-targeted DNA probes. Environmental Microbiology11:1168-1180Scholin CA, Buck KR, Britschgi T, Cangelosi J, Chavez FP (1996)Identification of Pseudo-nitzschia australis (Bacillariophyceae) usingrRNA-targeted probes in whole cell <strong>and</strong> s<strong>and</strong>wich hybridization<strong>for</strong>mats. Phycologia 35:190 – 197Scholin C, Miller P, Buck K, Chavez F, Harris P, Haydock P, HowardJ, Cangelosi G (1997) Detection <strong>and</strong> quantification of Pseudonitzschiaaustralis in cultured <strong>and</strong> natural populations using LSUrRNA-targeted probes. Limnol Oceanogr 42:1265–1272Scholin CA, Marin III R, Miller PE, Doucette GJ, Powell CL,Haydock P, Howard J, Ray J (1999) DNA probes <strong>and</strong> a receptorbindingassay <strong>for</strong> detection of Pseudo-nitzschia (Bacillariophyceae)species <strong>and</strong> domoic acid activity in cultured <strong>and</strong> natural samples.J Phycol 35:1356-1367.Scholin CA, Vrieling E, Peperzak L, Rhodes L, Rublee P (2004) Detectionof HAB species using lectin, antibody <strong>and</strong> DNA probes.In: Hallegraeff GM, Anderson DM, Cembella AD (eds) Manualon harmful marine microalgae, Vol 11. IOC, UNESCO Paris, p131-164Tyrrell JV, Connell LB, Scholin CA (2002) Monitoring <strong>for</strong> Heterosigmaakashiwo using a s<strong>and</strong>wich hybridisation assay. HarmfulAlgae 1:205-214Tyrrell JV, Scholin CA, Berguist PR, Berguist PL (2001) Detection<strong>and</strong> enumeration of Heterosigma akashiwo <strong>and</strong> Fibrocapsa japonica(Raphidophyceae) using rRNA-targeted oligonucleotide probes.Phycologia 40:457-46792
<strong>Microscopic</strong> <strong>and</strong> Molecular Methods <strong>for</strong> Quantitative Phytoplankton AnalysisChapter 12 Semiautomated s<strong>and</strong>wich hybridisationAppendixTable 1. Equipment <strong>and</strong> suppliers. Note that some pieces of equipment, such as the plate reader, sample filtration system, heating block<strong>and</strong> refrigerator, are available as other models from a variety of vendors. Prices quote obtained December, 2007.Equipment Supplier Cat. Number € US $96-well Microplate reader that can Fisher Scientific 14-386-27 3821 5510read wavelengths 650 nm <strong>and</strong> 450 nmOptical filter 650nm Fisher Scientific 14-386-59 196 283Vacuum filter manifold Fisher Scientific 09-753-39A 540 77925 mm polysulfone filter funnel(250 mL) need 6, costs in totalPall 4203 504 726Vacuum pump GAST DOA P704 AA 303 443Heating block Fisher Scientific 11-716-68Q 223 32212-Channel Pipettor 20-300 µL Rainin L12-300 412 595Single Channel Pipettor 10-1000 µL Rainin PR-1000 184 265Robotic processor Saigene Inc 5 . 6000-01 5708 8500Refrigerator (4-8 o C) Maytag MBB1952HE 577 850Cryogenic Storage vessel Fisher Scientific 11-676-1C 2350 3393Sum approx. 14818 2166693
IOC Manuals & Guides no 55Chapter 12 Semiautomated s<strong>and</strong>wich hybridisationTable 2. Expendable reagents <strong>and</strong> supplies required <strong>for</strong> application of the SHA <strong>and</strong> relevant suppliers.Material Supplier Cat. Number € US $1Custom Plate One ProbeSet; minimum order of 50plates1Custom Plate Two Probe Set;minimum order of 50 plates1Custom Plate Three ProbeSet; minimum order of 50plates1Custom Plate Four ProbeSet; minimum order of 50plates2Assay Development Kit;minimum order of 25 platesSaigene 5 call <strong>for</strong> order 25 38 per plateSaigene 5 call <strong>for</strong> order 27 40Saigene 5 call <strong>for</strong> order 28 42Saigene 5 call <strong>for</strong> order 29 44Saigene 5 call <strong>for</strong> order 24 363Bulk lysis buffer, 500 mL Saigene 5 call <strong>for</strong> order 27 404Defined Kits (routineproduction), incl lysis buffer,prong, sample filters, etc.25 mm Durapore filter (100count)13 mm syringe filter (100count)Polypropylene 12X75mmtubes (5000 count)Call <strong>for</strong> quoteCall <strong>for</strong> quoteMillipore DVPP02500 60 86Millipore SLHVT13NL 138 197Fisher Scientific 14-961-11 318 4595 cc Syringe (400 count) Fisher Scientific 14-823-35 47 682 mL Cryovial (250 vials) Fisher Scientific 03-337-7H 127 184Filling boats (200 count) Fisher Scientific 07-200-127 76 11010% H 2SO 4(dilute stock) Fisher Scientific A300-500 40 58Sum approx. 966 14021Plates made custom to user specification. Saigene will fill <strong>and</strong> seal plates; user supplies capture <strong>and</strong> signal probes.Plates are configured with one to four probe sets. Price includes prongs; lysis buffer sold separately. Discountavailable <strong>for</strong> orders >50 plates.2Plates filled with all reagents except capture <strong>and</strong> signal probes (to facilitate assay development). Price includesprong, buffers <strong>for</strong> preparing capture <strong>and</strong> signal probe solutions. Discount available <strong>for</strong> orders >25 plates.3In addition to lysis buffer, Saigene can provide bulk quantities of other reagents used in the SHA; prices availableon request.4Defined Kits are those prepared entirely by Saigene. They differ from Custom Plate configurations in that Saigeneprovides user-defined probes, or those available through published articles. Defined Kits also include prongs <strong>and</strong>lysis buffer (volume based on the intended use of the plates), <strong>and</strong> can be bundled with sample <strong>and</strong> lysate filters ifdesired. The most likely application of Defined Kits are <strong>for</strong> research/monitoring programs where there is a definedset of target species/probes, sample <strong>and</strong> lysis volumes are fixed within well specified range, <strong>and</strong> users prefer notto take responsibility <strong>for</strong> procurement <strong>and</strong> quality assurance of probe stocks. Depending on the number of platesordered, Defined Kits will generally exceed those in cost of the equivalent Custom Plate by 10-20% depending onprobe costs <strong>and</strong> number of probe sets required per plate.5Saigene Biotech Inc.ATTN: Thomas Hur<strong>for</strong>dBox 3048Monument, CO 80132USAPhone Int.+ 1 719-559-1163thur<strong>for</strong>d@saigenebiotech.com94
<strong>Microscopic</strong> <strong>and</strong> Molecular Methods <strong>for</strong> Quantitative Phytoplankton AnalysisChapter 13 Quantitative PCR13 Quantitative PCR <strong>for</strong> detection <strong>and</strong> enumeration of <strong>phytoplankton</strong>Luca Galluzzi* 1 <strong>and</strong> Antonella Penna 21Section <strong>for</strong> Biotechnology, Department of Bio<strong>molecular</strong> Sciences, University of Urbino, Via Campanella 1, 61032 Fano (PU), Italy2Section of Environmental Biology, Department of Bio<strong>molecular</strong> Sciences, University of Urbino, V.le Trieste 296, 61100 Pesaro (PU), Italy*Author <strong>for</strong> correspondence e-mail: luca.galluzzi@uniurb.itIntroductionQuantitative Polyemerase Chain Reaction (QPCR) is an extremelysensitive method which has been applied in recentyears to detect <strong>and</strong> quantify different <strong>phytoplankton</strong> speciesin environmental samples (Bowers et al. 2000, Popels etal. 2003, Galluzzi et al. 2004, Coyne et al. 2005, Park et al.2007, Touzet et al. 2009). Its application could revolutionisethe study of microalgal population dynamics in marine systemsas it allows the concurrent identification, enumeration<strong>and</strong> determination of viability of target species (Coyne <strong>and</strong>Cary 2005, Kamikawa et al. 2005). QPCR can be used onboth seawater <strong>and</strong> sediment samples. The method is basedon the amplification of specific DNA sequences. In assaysdeveloped to date <strong>for</strong> <strong>phytoplankton</strong> these sequances consistof ribosomal RNA (rRNA) genes. Many protocols have beenoptimised <strong>for</strong> the QPCR approach. Here, we describe an optimisedprotocol, which is based on the use of SYBR Green (adye which specifically binds to DNA) <strong>and</strong> relies on a st<strong>and</strong>ardcurve constructed with a DNA plasmid containing the clonedtarget sequence <strong>for</strong> quantification.Basic Principles of Quantitative PCR(QPCR)Polymerase Chain Reaction is a technique used to amplify invitro a target sequence of DNA. The PCR is per<strong>for</strong>med byheating <strong>and</strong> cooling an initial reaction mixture in a definedseries of temperature steps. The reaction mix contains DNAfrom the sample to be tested, two different primers (smallbits of artificially synthesised DNA complementary to the targetDNA in which you are interested) nucleotides consistingof the four different bases required to make DNA, a DNApolymerase enzyme which will build DNA using the nucleotides<strong>and</strong> buffer containing various salts which are optimal<strong>for</strong> the functioning of the DNA polymerase. The differenttemperature steps are necessary to separate the two str<strong>and</strong>sin the double helix DNA (denaturation step), to allow thebinding of the primers to the complementary DNA presentin the sample (annealing step) <strong>and</strong> to permit DNA synthesisby the DNA polymerase (elongation step). The specificity ofthe PCR is mainly due to the primer sequences which mustbe complementary only to the DNA region targeted <strong>for</strong> amplification.The annealing temperature is of particular importance.If too low an annealing temperature is used, then theprimers may anneal to regions of DNA which are similar butnot identical.As the PCR progresses, the DNA generated by the reactionis used as a template <strong>for</strong> replication leading to the exponentialamplification of the target DNA sequence. A typical PCRamplification profile consists of an exponential amplificationof the target sequence, followed by a linear or plateau phaseas reagents become exhausted as seen in Figure 1.The qualitative analysis of the PCR reactions is per<strong>for</strong>medat the end point of the reaction. This is usually per<strong>for</strong>medby agarose gel electrophoresis <strong>and</strong> ethidium bromide staining.This method of visualising this PCR DNA product involvesplacing the PCR product in a well in a thin block of agarosegel <strong>and</strong> passing an electric current, negative to positive,through the gel. DNA is a negatively charged particle <strong>and</strong> willmigrate with the current through the gel. Because all of thePCR products are the same size i.e. the size determined by thedistance between where the two primers originally bound tothe opposite str<strong>and</strong>s of the DNA during PCR amplification,all the PCR products will migrate at the same rate <strong>for</strong>ming adense b<strong>and</strong> of DNA. The agarose is infused with ethidiumbromide, a stain which binds to DNA. Ethidium bromidefluoresces under UV light. When the gel is viewed under UVlight the PCR product can be easily seen as a fluorescent b<strong>and</strong>where the ethidium bromide has concentrated in the DNA.The brightness of the PCR b<strong>and</strong> is related to the amount ofPCR product present at the end of the PCR reaction (theplateau phase).In <strong>quantitative</strong> real-time PCR (QPCR), reactions are analysedduring the initial exponential phase rather than at theend point. PCR product <strong>for</strong>mation is monitored after eachcycle in real time by measuring a fluorescence signal whichis proportional to the amount of PCR product generated.This is per<strong>for</strong>med using a camera incorporated within a realtimePCR machine. Software converts the data recorded bythe camera <strong>and</strong> allows the visualization of the amplificationcurves on a computer screen. An example of this can be seenin Fig. 2. The fluorescence can be generated by using intercalating(binding between the grooves of the double helixPCR productACycle numberFigure 1. General PCR amplification profile. The exponential amplificationphase (a) is followed by a linear or plateau phase (b), dueto reactants exhaustionB95
IOC Manuals & Guides no 55Chapter 13 Quantitative PCRThe fundamentals ofThe <strong>quantitative</strong> PCR methodScopeDetection <strong>and</strong> quantification of target <strong>phytoplankton</strong> species.Detection rangeDetection per<strong>for</strong>mance varies with the sample volume, moreprecisely: 10 target sequences in a 25 µL reaction tube. Themethod is sufficiently sensitive to detect one cell.AdvantagesAllows identification of target <strong>phytoplankton</strong> to species level.Highly sensitive. No taxonomic expertise needed.DrawbacksProbes are only available <strong>for</strong> a limited number of target species.Specificity of probes must be established on a regional basis.Only one species or strain at a time can be analysed in a <strong>quantitative</strong>manner, unless a multiplex reaction is per<strong>for</strong>med; equipmentis still expensive.Type of training neededInstruction in setting up this technique should come from aperson with an in-depth knowledge <strong>and</strong> experience of <strong>molecular</strong>biology particularly in real-time PCR (RT-PCR). A skilled<strong>molecular</strong> biologist should be available to solve any problemsthat may arise using this method.Essential EquipmentFiltration apparatus/centrifuge, hybridisation oven, real-timePCR instrument.Equipment cost*Total set-up cost = €49426 ($69890)See Appendix, Table 1 <strong>for</strong> detailsConsumables, cost per sample**€4.10 ($6.00 US) using a Millipore filter to collect cells or€3.00 ($4.40 US) using a microcentriguge to collect cellsProcessing time per sample be<strong>for</strong>e analysisApproximately 4 hours to process the sample.Analysis time per sampleApproximately 3 hours to assemble <strong>and</strong> per<strong>for</strong>m the RT- PCR.Up to 10 samples can be processed roughly in the same amountof time. Analysis of the real-time PCR results <strong>and</strong> calculation ofcell concentration may require 15 minutes.Sample throughput per person per dayA trained person can process up to 16 samples per day.No. of samples processed in parallelUp to 16 samples.Health <strong>and</strong> Safety issuesRelevant health <strong>and</strong> safety procedures must be followed. SYBRGreen is a DNA intercalating dye.*service contracts not included**salaries not included96
<strong>Microscopic</strong> <strong>and</strong> Molecular Methods <strong>for</strong> Quantitative Phytoplankton AnalysisChapter 13 Quantitative PCRDNA) fluorescent dyes or a number of alternative real-timePCR chemistries which use probes (short synthetically madepieces of DNA) which fluoresce when bound to their complementarytarget DNA following PCR amplification (e.g.Hydrolysis probes (TaqMan), Hybridisation probes ( FRET).Figure 2. Real-time PCR instrument ABI PRISM 7000 SDS (AppliedBiosystems).AFigure 3. Filter system (A) with 3 µm Millipore TSTP membrane(B).BFor each sample, the fluorescence signal of the reporter dye(i.e. the dye which fluoresces in proportion to the amount ofPCR product produced) (e.g. SYBR) is divided by the fluorescencesignal of the passive reference dye (ROX) to obtaina ratio defined as the normalised reporter signal (Rn). ROXis a dye present in the reaction mix which gives out a st<strong>and</strong>ardlevel of fluorescence independent of PCR amplification.It is used to normalise <strong>for</strong> differences in amount of reactionmix due to pipetting errors or evaporation. Some QPCR machinesdo not require the use of ROX. The higher the startingamount of the target molecule, the earlier a significantincrease in fluorescence (Rn value) is observed. The parameterCt (threshold cycle) is defined as the fractional cycle numberat which the fluorescence crosses a fixed threshold above thebaseline. The amount of target sequence in an unknownsample is calculated by plotting the Ct value on the st<strong>and</strong>ardcurve. The st<strong>and</strong>ard curve is generated by the QPCR instrumentsoftware by plotting Ct values versus the log of initialtarget concentration, <strong>and</strong> by per<strong>for</strong>ming a linear regression.The PCR efficiency can be calculated from the slope of theline using the equation:Efficiency = 10 (-1/slope) –1If the PCR has 100% efficiency, the amount of PCR productwill double after each cycle <strong>and</strong> the slope of the st<strong>and</strong>ardcurve will be -3.33 (i.e. 3.33 cycles gives a 10 fold increase/decrease between the 10 fold serial dilutions used to generatethe curves). A PCR efficiency of at least 90% (slope = 3.6) isgenerally required <strong>for</strong> reliable <strong>quantitative</strong> results.MaterialsFigure 4. Collecting cells from the filter with 1 mL artificial sterileseawater in a 1.5 mL tube .Laboratory facilitiesLaboratory facilities necessary <strong>for</strong> <strong>quantitative</strong> analysis of<strong>phytoplankton</strong> by PCR are consistent with those found ina st<strong>and</strong>ard <strong>molecular</strong> biology laboratory equipped <strong>for</strong> DNAcloning, purification, quantification <strong>and</strong> real-time (<strong>quantitative</strong>)amplification.Equipment, Chemicals <strong>and</strong> ConsumablesThe equipment, chemicals <strong>and</strong> consumables used in thismethod are presented in the Appendix, at the end of thischapter (Tables 1-2). Suppliers, Catalogue numbers <strong>and</strong> estimatedcost in Euros <strong>and</strong> US Dollars are also listed in Tables1-2.MethodFigure 5. Cell lysis by sonication.Sample processing (culture or seawater samplesfixed with acidified Lugol’s solution)Microalgal cultures or seawater samples fixed with acidifiedLugol’s iodine solution (see chapter 2 <strong>for</strong> recipe) have to becollected <strong>and</strong> lysed appropriately in order to generate lysates97
IOC Manuals & Guides no 55Chapter 13 Quantitative PCR(or starting material) suitable <strong>for</strong> use in QPCR. In manyinstances the sample will need to be concentrated prior tostarting the QPCR method. This can be achieved by eithercentrifugation or filtration.Collection of Phytoplankton Cells Using a Centrifuge1 Spin <strong>phytoplankton</strong> cells at 3000 rpm <strong>for</strong> 15 minutesat 12 ± 1 ºC <strong>and</strong> remove the supernatant carefully. Thisremoves the acidified Lugol’s fixative. A swinging bucketcentrifuge is required to allow <strong>for</strong> the generation of a concentratedpellet.2 Resuspend cells in a suitable volume of artificial sterileseawater <strong>and</strong> transfer to 1.5 mL tube.3 Spin at 3000 rpm <strong>for</strong> 15 minutes at 12 ±1 ºC in a swingingbucket rotor <strong>and</strong> remove the supernatant (leaving approximately100 µL).4 Spin again at 10000 rpm <strong>for</strong> 10 seconds at 12 ± 1 ºC <strong>and</strong>remove the remaining supernatant leaving the pellet inthe tube.Collection of Phytoplankton Cells Using a Filter System1 Filter the appropriate volume of sample to be processedonto a 3.0 µm Millipore TSTP membrane (Fig. 3).2 Wash the filter with 1.0 mL of artificial sterile seawaterin a 1.5 mL tube (Fig. 4). This collects the cells from thefilter surface.3 Spin the cells at 6800 rpm <strong>for</strong> 5 minutes in a microcentrifuge<strong>and</strong> remove the supernatant (leaving approximately100 µL).4 Spin at 10000 rpm <strong>for</strong> 10 seconds <strong>and</strong> remove the remainingsupernatant leaving the pellet dry.Cell Lysates Preparation1 Freeze pellet at -80 ± 1 ºC <strong>for</strong> 15 minutes.2 Resuspend the frozen pellet with 400-600 µL lysis buffer(PCR buffer 1X, NP40 0.5%, Tween 20 0.5%, proteinaseK 0.1 mg mL -1 ) at a concentration of 1 x 10 5 – 2 x 10 5cells mL -1 .3 Sonicate twice at 50 W <strong>for</strong> 10 seconds <strong>and</strong> incubate at 55± 1 ºC <strong>for</strong> 2-4 hours (Figs 5-6), vortexing at intervals of30 minutes.4 Boil <strong>for</strong> 5 minutes <strong>and</strong> centrifuge at 12000 rpm <strong>for</strong> 2minutes. This will eliminate cell debris <strong>and</strong> impurities.5 Transfer the supernatant to a clean microcentrifuge tube<strong>and</strong> store this sample lysate at -80 ± 1 ºC <strong>for</strong> 2-3 days orprocess it immediately.St<strong>and</strong>ard Curve PreparationPlasmid generationA PCR product, generated as described previously, whichcontains the complementary target DNA sequence to whichthe QPCR primers bind (<strong>and</strong> probe if a probe based chemistryis used) is enzymatically joined at both ends (ligated) toa specific double str<strong>and</strong>ed DNA sequence called a plasmid.This <strong>for</strong>ms a circular DNA construct. A plasmid is DNA,usually in circular <strong>for</strong>m, which is capable of replicating itselfindependently of cell replication. A single plasmid containingthe target sequence is introduced into a bacterial cell followinga chemical or electrical reaction. The bacteria is placed ona nutritious gel <strong>and</strong> multiplies to <strong>for</strong>m a visible colony consistingof thous<strong>and</strong>s of bacterial cells. The plasmid is passedto each new cell following cell division. Within each cell, theTable 1. Master mix preparation <strong>for</strong> real-time PCR.ReagentAmount perreactiondH 2OvariableCommercial mix containingSYBR Green 2X12.5 µL 1XFigure 6. Samples in a thermal block at 55 °C.Finalconcentration*MgCl 225 mM 1-5 µL 1-5 mMForward primer 10 mM 0.25-1.5 µL 100-600 nMReverse primer 10 mM 0.25-1.5 µL 100-600 nM*DNA Polymerase 5U/mL 0.125-0.25 µL 0.025-0.05 U/mLDiluted cell lysate 1-2 µL -Final volume 25 µL*Only if required. Some commercial mixes (i.e. Applied Biosystems)already contain MgCl 2<strong>and</strong> DNA polymeraseFigure 7. Dispersing the reaction mixtures inthe optical plate (25 µL each well).plasmid will also replicate many times, <strong>and</strong> with it the originalPCR product. The plasmids are purified from the bacteria resultingin a highly concentrated source of pure PCR productcontaining the target sequence <strong>for</strong> the QPCR assay. There aremany types of plasmids <strong>and</strong> bacterial cells commercially available<strong>and</strong> numerous <strong>methods</strong> <strong>for</strong> purification, again many ofwhich are incorporated into commercially available kits.The st<strong>and</strong>ard curve can be constructed with 10-fold serial dilutionsof a plasmid containing the target sequence. Usually,the curve range extends from 1.0 × 10 2 to 1.0 × 10 6 plasmidcopies but it can be adjusted according to the assay detectionrange required. The plasmid copy number is calculated usingthe following <strong>for</strong>mula:Molecules µ L -1 = (A × 6.022 × 10 23 )/(660 × B)where: A = plasmid concentration (g µL -1 ); B = length ofthe plasmid containing the cloned sequence; 6.022 × 10 23 =98
<strong>Microscopic</strong> <strong>and</strong> Molecular Methods <strong>for</strong> Quantitative Phytoplankton AnalysisChapter 13 Quantitative PCRDerivative0.240.200.160.120.080.040.00-0.0460 65 70 75 80 85 90 95Temperature (C)Figure 8. Example of dissociation protocol results. The graphshows the derivative of fluorescence emission variation plottedagainst the temperature increment. The peak corresponds to aspecific 173-bp PCR product. No aspecific products or primerdimers are visible.ADelta RnB1010.10.011 10 20 30 40Cycle numberCt323028262422201816142 2.5 3 3.5 4 4.5 5 5.5 6 6.5Figure 9. Example of st<strong>and</strong>ard curve obtained with a plasmidcontaining 28S rDNA sequence of Alex<strong>and</strong>rium fundyense. (A)Amplification plots with plasmid copy number from 2.0 X 10 6 to 2.0X 10 2 . The cycle number is plotted vs the Delta Rn. The Delta Rnrepresents the normalized reporter signal (Rn) minus the baselinesignal established in the early PCR cycles. Three replicates wereper<strong>for</strong>med <strong>for</strong> each reference DNA sample. T: threshold. (B) Calibrationcurve plotting log starting copy number vs Ct. Slope: –3.61;correlation coefficient (R 2 ): 0.9939.Avogadro’s number; 660 = average <strong>molecular</strong> weight of onebase pair. The accurate determination of the plasmid concentrationcan be per<strong>for</strong>med using a spectrophotometer or afluorimeter. Once quantified, it is recommended to store theplasmid at -80 ºC in small aliquots to avoid repeated freeze/thaw cycles. Moreover, plasmid dilutions should be freshlyprepared <strong>for</strong> each PCR run.Dilutions of Sample Lysates <strong>and</strong> Plasmid1 Make scalar dilutions 1:10 of the sample lysates withPCR-grade H 2O.2 Make scalar dilutions 1:10 of the plasmid with PCRgradeH 2O (from 1.0 × 10 6 to 1.0 × 10 2 ).TQuantitative PCR Assay1 In a separate clean room set up the QPCR master mixdescribed in the Table 1. Make triplicate PCR tubes <strong>for</strong>each lysate <strong>and</strong> plasmid dilution (see above). This is requiredto determine the intra-assay variability of results.For this purpose, it is practical to aliquot a reaction volumeequivalent to 3 reactions (75 µL) in one st<strong>and</strong>ardPCR tube, add the template, <strong>and</strong> then disperse the reactionsin optical tubes/plates (25 µL per tube/well) (Fig.7). Quantitative PCR assays are per<strong>for</strong>med in a final volumeof 25 µL using the SYBR Green chemistry as presentedin Table 1. To reduce cost, it is possible to set upQPCR mixtures considering a final volume of 12.5 μlinstead of 25 μl. In this case, particular care should betaken to avoid volume differences between tubes.2 Per<strong>for</strong>m the QPCR in a real-time PCR instrument underthe following reaction conditions: 95 ºC <strong>for</strong> 5 minutes;40 cycles of 15 sec at 95 ºC, 1 min at 60 ºC, with afinal dissociation protocol to ensure the absence of nonspecificPCR products or primer dimers (Fig. 8). Theseconditions can be modified depending on the commercialmix used <strong>and</strong> the characteristics of each primer.Due to the sensitivity of the PCR method, it is crucial toavoid contamination. It is there<strong>for</strong>e necessary to set up thereactions in a clean area (i.e. in a PCR cabinet), free of potentialplasmid or PCR product contamination. Always includeone or more negative controls (blank sample with no targettemplate).PCR efficiency is important <strong>for</strong> quantification purposes: tomaximize efficiency, it is advisable to design primers producinga PCR product no more than 100 bp long. These shortamplicons can also allow the use of partially degraded DNA,without loss of quantification per<strong>for</strong>mance. It is also necessaryto include the st<strong>and</strong>ard curve in each PCR run, due tothe possible variability from one PCR to another.To avoid variability <strong>and</strong> low yields in DNA purifications,crude cell lysates can be used as the DNA template in thePCR reactions. These lysates contain components that caninterfere with PCR reactions <strong>and</strong> it is there<strong>for</strong>e necessary tofind a template amount which can be amplified without anyinhibitory effect. For this purpose, the QPCR assay is per<strong>for</strong>med,at least during the assay optimisation, with 10-foldserial diluted lysates until quantification results become proportionalto sample dilutions. Usually, dilutions from 1:10 to1:1000 are sufficient to establish the correct conditions. It isimportant to note that this approach would be possible whenthe target sequence is present in high copy number in the cell(e.g. rRNA genes), otherwise the sensitivity of the methodwill drop significantly.Analysis of ResultsThe analysis of the results is per<strong>for</strong>med using the specificQPCR machine software.1 Set a suitable baseline <strong>and</strong> threshold value, if the instrumentdoes not do it automatically. Plasmid amplificationplots <strong>and</strong> a st<strong>and</strong>ard curve similar to the one presented inFig. 9, should appear.2 Using experimental results, the number of target DNAcopies per µL of the original sample can be caluclated99
IOC Manuals & Guides no 55Chapter 13 Quantitative PCRfrom the st<strong>and</strong>ard curve.3 In order to estimate the total number of cells in the initialsample, the number of target DNA copies per µL in thesample is divided by the number of rDNA copies per cell.This is then multiplied by the initial lysate volume.Formulas <strong>for</strong> Calculating Results:N = [(A/B) x d] x (V/C)N: Total number of cells in the initial sampleA: number of target DNA copies per PCR tube (calculated byinstrument software)B: mL of cell lysate in the PCR tubeC: target DNA copies per cell (to be determined <strong>for</strong> each targetspecies using cultured cells)d: lysate dilution factorV: initial lysate Volume expressed in mLSample Preservation <strong>and</strong> StoragePhytoplankton samples can be preserved with acidifiedLugol’s iodine solution <strong>and</strong> stored at 4°C in the dark. Experiencehas shown that reliable <strong>quantitative</strong> PCR results can beobtained from samples stored up to one year.DiscussionThe QPCR has proven to be a powerful method <strong>for</strong> the quantification<strong>and</strong> detection of <strong>phytoplankton</strong> species in environmentalsamples (Galluzzi et al. 2004, Hosoi-Tanabe <strong>and</strong> Sako2005, Dyhrman et al. 2006).The use of commercial PCR master mix containing intercalatingdyes such as SYBR Green is a simple <strong>and</strong> inexpensiveapproach. The assays based on intercalating dyes are very sensitive,but it is noteworthy that any double str<strong>and</strong>ed non targetDNA can also be detected, leading to misinterpretation ofresults. For this reason, the specificity of the primer is crucial.An increase in the specificity of the assay can be obtained usinga TaqMan probe but this may result in a loss of sensitivity.Theoretically, this technique can be applied to any <strong>phytoplankton</strong>species with DNA sequence data available sospecific primers or probes can be designed. However, somedrawbacks need to be taken into account when applyingQPCR method to <strong>phytoplankton</strong>. In particular, when a targetsequence cloned into a plasmid is used as a st<strong>and</strong>ard, itis essential to know the amount of target DNA per cell, inorder to determine the cell number in the field sample. Thisrequires preliminary work with cultured strains to optimisethe method <strong>for</strong> each target species/strain. Due to the possibilityof variations of target gene copy number (particularlyin case of rRNA genes) among different strains, the level ofaccuracy of the <strong>quantitative</strong> real-time PCR assays can be affected,as it has been shown <strong>for</strong> Mediterranean Alex<strong>and</strong>riumspecies (Galluzzi et al. in press). For this reason, the <strong>methods</strong>hould be tested <strong>and</strong> optimized with the local <strong>phytoplankton</strong>population in the geographical area to be investigated. Primeror probe specificity needs to be tested with the local populationof <strong>phytoplankton</strong> to ensure absence of non-specific targetamplification.Compared to classical microscopy techniques, the main advantagesof the QPCR in <strong>phytoplankton</strong> monitoring includespecificity, sensitivity <strong>and</strong> applicability to preserved environmentalsamples. Sample preservation is often necessary, butthe use of fixatives may cause the morphology distortion ofsome <strong>phytoplankton</strong> species, making it more difficult to distinguishthem from closely related species using a microscope.The QPCR sample throughput can be up to 27 triplicatesamples per 96-well plate, including the st<strong>and</strong>ard curve. Thissample throughput may reduce working time compared tothe microscope-based <strong>methods</strong> when a high number of samplesneed to be analysed. It is also noteworthy that the collectionof <strong>phytoplankton</strong> using a filter based system is fasterthen the centrifugation method. This alternative speeds upthe entire process thus reducing the h<strong>and</strong>ling time.QPCR instrument prices are becoming af<strong>for</strong>dable <strong>for</strong> smallresearch groups <strong>and</strong> are now common in many <strong>molecular</strong> biologylaboratories. The consumable cost per sample has beenestimated in $4 - $6 depending on the method/master mix/chemistry used, making the QPCR an af<strong>for</strong>dable method <strong>for</strong>monitoring purposes.In QPCR assays, only one species or strain can be analysedat a time unless a multiplex reaction is per<strong>for</strong>med. This usuallyrequires the use of more expensive fluorescent probes(e.g. TaqMan probes) instead of intercalating dyes. Althoughmultiplexing <strong>and</strong>/or multiprobing are powerful tools <strong>for</strong> <strong>molecular</strong>investigations of specific groups of toxic algae, theirdevelopment <strong>and</strong> validation can be difficult <strong>and</strong> expensive(H<strong>and</strong>y et al. 2006).This method can be still considered at the developmentalstage. If this method is incorporated into future monitoringprograms <strong>for</strong> HAB-species, a subset of samples could also bechecked using a more traditional microscopic technique. Thistype of quality control would validate the presence of the targetspecies on a selected subset of samples <strong>and</strong> highlight anyproblems that may arise with the method.AcknowledgementsEU-Project Seed GOCE-CT-003875-2005.ReferencesBowers HA, Tengs T, Glasgow HB, Burkhoelder JMj, Rublee PA,Oldach DW (2000) Development of real-time PCR assay <strong>for</strong> rapiddetection of Pfiesteria piscicida <strong>and</strong> related dinoflagellates. ApplEnviron Microbiol 66:4641-4648Coyne KJ, Cary SC (2005) Molecular approaches to the investigationof viable dinoflagellate cysts in natural sediments from estuarineenvironments. J Eukaryot Microbiol 52:90-94Coyne KJ, H<strong>and</strong>y SM, Demir E, Whereat EB, Hutchins DA, PortuneKJ, Doblin MA, Cary SC (2005) Improved <strong>quantitative</strong> realtimePCR assays <strong>for</strong> enumeration of harmful algal species in fieldsamples using an exogenous DNA reference st<strong>and</strong>ard. LimnolOceanogr Methods 3:381–391Dyhrman ST, Erdner D, La Du J, Galac M, Anderson DM (2006)Molecular quantification of toxic Alex<strong>and</strong>rium fundyense in theGulf of Maine using real-time PCR. Harmful Algae 5:242–250Galluzzi L, Penna A, Bertozzini E, Vila M, Garcés E, Magnani M100
<strong>Microscopic</strong> <strong>and</strong> Molecular Methods <strong>for</strong> Quantitative Phytoplankton AnalysisChapter 13 Quantitative PCR(2004) Development of Real-Time PCR assay <strong>for</strong> rapid detection<strong>and</strong> quantification of A. minutum (Dinoflagellate). Appl EnvironMicrobiol 70:1199-1206H<strong>and</strong>y, SM, Hutchins, DA, Cary, SC, Coyne, KJ, (2006)Simultaneous enumeration of multiple raphidophyte species by<strong>quantitative</strong> real-time PCR: capabilities <strong>and</strong> limitations. Limnol.Oceanogr. Methods 4: 193–204Hosoi-Tanabe S, Sako Y (2005) Species-specific detection <strong>and</strong> quantificationof toxic marine dinoflagellates Alex<strong>and</strong>rium tamarense <strong>and</strong>A. catenella by Real-Time PCR assay. Mar Biotechnol 7:506-514Kamikawa R, Hosoi-Tanabe S, Nagai S, Itakura S, Sako Y (2005)Development of a quantification assay <strong>for</strong> the cysts of the toxicdinoflagellate Alex<strong>and</strong>rium tamarense using real-time polymerasechain reaction. Fish Sci 71: 987–991Park TG, de Salas MF, Bolch CJ, Hallegraeff GM (2007) Developmentof a real-time PCR probe <strong>for</strong> quantification of the heterotrophicdinoflagellate Cryptoperidiniopsis brodyi (Dinophyceae) inenvironmental samples. Appl. Environ. Microbiol. 73: 2552–2560Popels LC, Cary SC, Hutchins DA, Forbes R, Pustizzi F, GoblerCJ, Coyne KJ (2003) The use of <strong>quantitative</strong> polymerase chainreaction <strong>for</strong> the detection <strong>and</strong> enumeration of the harmful algaAureococcus anophagefferens in environmental samples along theUnited States East Coast. Limnol Oceanogr: Methods 1:92–102Touzet N, Keady E, Raine R, Maher M (2009) Evaluation of taxaspecificreal-time PCR, whole-cell FISH <strong>and</strong> morphotaxonomyanalyses <strong>for</strong> the detection <strong>and</strong> quantification of the toxicmicroalgae Alex<strong>and</strong>rium minutum (Dinophyceae), Global Claderibotype. FEMS Microbial Ecol. 67:329-341101
IOC Manuals & Guides no 55Chapter 13 Quantitative PCRAppendixTable 1. Equipment <strong>and</strong> suppliers.Equipment Supplier Cat. Number € US $Real-time PCR instrument ABI PRISM 7300 SDS Applied Biosystems 4351101 29840 42099Ultrasonic Homogeniser Branson S-150D VWR international 33995 2110 2980Analog Dry Block Heater VWR international 12621-110 344 485Swing-bucket Centrifuge IEC-CL30 Thermo Scientific 11210904 5532 7856Mini-Centrifuge Heraeus ”Biofuge Fresco” Thermo Scientific 75002420 3600 5110Spectrophotometer Shimadzu, Japan UV-2401 PC 8000 11360Sum approx. 49426 69890Table 2. Chemicals <strong>and</strong> suppliers.Chemicals/consumables Supplier Cat. Number € US $Isopore membrane filter 3.0 µm TSTP Millipore, USA TSTP02500 129 183Lugol solution (1L) Sigma-Aldrich Srl, Italy 62650 26 37*SYBR Green PCR Master Mix, 2 X 200 reactions Applied Biosystems, USA 4364344 664 936MicroAmp Optical 96-well Reaction Plate, 20/pkg Applied Biosystems, USA 4306737 152 214Optical Adhesive Covers, 25/pkg Applied Biosystems, USA 4360954 76 107Tween 20 Sigma-Aldrich Srl, Italy P1379-100ML 26.9 38NP 40 Sigma-Aldrich Srl, Italy 74385-1L 36 50Proteinase k Sigma-Aldrich Srl, Italy P6556-25MG 39.1 55Primers <strong>for</strong>ward <strong>and</strong> reverse (25 nmol) Invitrogen, Italy - 13 18Tubes 1.5 mL Sarstedt, Germany 72690 - 500/pack 16 22Polypropylene conical tubes 50 mL BD Biosciences 352070 - 500/case 99 140*Different commercial SYBR Green mixtures can also be used (<strong>for</strong> exampleHot-Rescue Real Time PCR KIT-SG from Diatheva, Italy).102
<strong>Microscopic</strong> <strong>and</strong> Molecular Methods <strong>for</strong> Quantitative Phytoplankton AnalysisChapter 14 Tyramide signal amplification in combination with fluorescence in situ hybridisation14 Tyramide signal amplification in combinationwith fluorescence in situ hybridisationKerstin Töbe 1 *1Alfred Wegener Institute <strong>for</strong> Polar <strong>and</strong> Marine Research Am H<strong>and</strong>elshafen 12. D-27570 Bremerhaven, Germany*Author <strong>for</strong> correspondence e-mail: Kerstin.Toebe@awi.deIntroductionTyramide Signal Amplification (TSA) - Fluorescence in situHybridisation (FISH) provides an enhanced fluorescence signalfrom <strong>molecular</strong> probes The oligonucleotide probe is labelledwith the enzyme horseradish peroxidase (HRP). Afterhybridisation the HRP catalyses the deposition of a phenoliccompound, a FITC (fluorescein isothiocyanate) labelled tyramide.In the presence of hydrogene peroxide, the immobilisedtyramide binds to electron rich moieties (mostly tyrosineresidues) of adjacent proteins. This TSA reaction results in asignal enhancement of up to 30 times more intensity thentraditional labelled fluorescent probes (Fig. 1).Solid phase cytometrySolid phase cytometry (SPC) combines the advantages of flowcytometry with image analysis (Kamentsky 2001), <strong>and</strong> enablesthe fast detection <strong>and</strong> enumeration of micro-organisms downto one cell in a sample (Lemarch<strong>and</strong> et al. 2001). In SPC, thelaser is moved over cells immobilised onto a solid support,which allows the rapid enumeration of several thous<strong>and</strong> cellswith a similar accuracy to flow cytometry (Darynkiewicz et al.2001). The ChemScan instrument (Chemunex, France) isa SPC, which was initially developed <strong>for</strong> industrial <strong>and</strong> environmentalmicrobiology (Mignon-Godefroy et al. 1997, Reynolds<strong>and</strong> Fricker 1999). It was adapted <strong>for</strong> the detection oftoxic microalgae using antibody (West et al. 2006) <strong>and</strong> oligonucleotidesprobes (Töbe et al. 2006). The ChemScan usesa 488 nm argon-ion laser <strong>and</strong> is there<strong>for</strong>e suited <strong>for</strong> probesor tyramides labelled with FITC. Algal cells are collected byfiltration onto a polycarbonate membrane, hybridised, <strong>and</strong>subsequently scanned (Fig. 2). Fluorescent events are detected<strong>and</strong> a computer applies various criteria to discriminate between“true” <strong>and</strong> “false” signals deriving from hybridised cellsusing the MatLab-based software (Matworks, Natick, USA)<strong>for</strong> comparison with Gaussian curves (Roubin et al. 2002).The exact positions of positively identified cells are shown ascoloured spots on a display of the membrane in a scan map.The hybridised cells can be visualised by transferring themembrane with its membrane holder to an epifluorescencemicroscope equipped with a computer controlled motorisedstage that is connected to the ChemScan. This allows eachpositive data point to be visually validated by microscopic examinationimmediately after scanning as true positives or falsepositives (Reynolds <strong>and</strong> Fricker 1999, Roubin et al. 2002).This method is very fast, positive hybridised cells are countedwithin 3 minutes <strong>and</strong> no positive hybridised cell can be overlookedby the operator as in st<strong>and</strong>ard FISH applications.TSA-FISH is required <strong>for</strong> reliable automated detection oftarget cells with the ChemScan to increase the peak fluorescenceintensity as a discrimination pattern in the computersoftware. Since TSA-FISH labelled cells reach very highfluorescence intensities, this allows the computer software todevelop discrimination patterns between labelled <strong>and</strong> non-labelledcells. This new automated method <strong>for</strong> counting microalgaeis, however, only adequate <strong>for</strong> round <strong>and</strong> spherical cellsat the moment <strong>and</strong> not <strong>for</strong> long colony <strong>for</strong>ming species, likethe diatoms Pseudo-nitzschia. The computer software presentlyused must be revised in order to count filamentous colony<strong>for</strong>ming microalgae. <strong>Microscopic</strong> verification of positive cellsis recommended. This can be per<strong>for</strong>med after confirming thatthe FISH labelling has been successfully completed.Presently, the application of only one single probe label is possible,because of the single laser of the ChemScan <strong>and</strong> it isthere<strong>for</strong>e not possible to detect more than one species on afilter at a time. The effectiveness of a new probe label is, however,under development. This new probe label is excited withthe present ChemScan laser, like st<strong>and</strong>ard FITC-labelledcells, but it has a different emission wavelength <strong>and</strong> with theinstallation of a suited Photomultiplier, two different probescould be applied.Figure 1. Tyramide signal amplification.103
IOC Manuals & Guides no 55Chapter 14 Tyramide signal amplification in combination with fluorescence in situ hybridisationThe fundamentals ofThe tyramide signal amplification - fluoresence in situ hybridisation in combination with solidphase cytometry methodScopeSemi-automated detection <strong>and</strong> quantification of target <strong>phytoplankton</strong>species.Detection rangeDetection of microalgal RNA by FISH is very sensitive. Thenumber of cells that can be detected depend on the sample volume.High biomass can obscure the view of target cells.AdvantagesSimple <strong>and</strong> easy to use. Sample volumes can easily be adjusted.Simultaneous labeling <strong>and</strong> detection of multiple species is possible.Strong yellowish/green labelling of target cells minimisesconfusion with non-target cells. Semi-automated analysis.DrawbacksProbes are only available <strong>for</strong> a limited number of target species.Rigorous optimisation <strong>and</strong> specificity testing on local strains isrequired be<strong>for</strong>e the method can be implemented. Finite storagetime <strong>for</strong> samples. Complex sample processing procedure mayresult in cell loss. At present very high start-up costs. Intensityof positive reaction may vary with cell conditions. Access to<strong>molecular</strong> expertise is essential. Appropriate laboratory facilities<strong>for</strong> storage <strong>and</strong> processing of probes <strong>and</strong> reagents are necessary.Type of training neededInstruction in setting up this technique should come from aperson with an in-depth knowledge <strong>and</strong> experience of <strong>molecular</strong>biology. Approximately one week of supervised trainingrequired to properly per<strong>for</strong>m the method.Essential EquipmentSolid phase cytometer <strong>and</strong> epifluorescence microscope withautomated stage; filtration unit, vacuum pump, hybridisationoven.Equipment cost*Total set-up cost = €183310, $ 269.795See Appendix, Table 1 <strong>for</strong> detailsConsumables, cost per sample**€11 ($16.13), see also Appendix, Table 2Processing time per sample be<strong>for</strong>e analysis5-30 minutes. Filtering time depends on the amount of <strong>phytoplankton</strong>in the samples.Analysis time per sampleThe TSA-FISH procedure <strong>and</strong> analysis with SPC requires 4.25hours of h<strong>and</strong>ling time per filter of 3 minutes <strong>for</strong> scanning <strong>and</strong>2 minutes <strong>for</strong> verification of the results.Sample throughput per person per dayA trained person can process up to 36 samples per day dependingon the number of target organisms in each sample.No. of samples processed in parallel36Health <strong>and</strong> Safety issuesRelevant health <strong>and</strong> safety procedures must be followed. Thefollowing chemical is particularly hazardous: Formamide.*service contracts not included**salaries not included104
<strong>Microscopic</strong> <strong>and</strong> Molecular Methods <strong>for</strong> Quantitative Phytoplankton AnalysisChapter 14 Tyramide signal amplification in combination with fluorescence in situ hybridisationSolutions <strong>for</strong> Fluorescence In situ HybridisationHybridisation buffer0.1 % (v/v) Nonidet-P40 (Sigma N-6507)x % (v/v) Formamide2 % blocking reagent (Roche, Mannheim, Germany)Wash buffer:1X SETSolution <strong>for</strong> quenching endogenous peroxidase activity3 % Hydrogene peroxide (H 2O 2) in filter sterilised deionisedwaterFigure 2. Tyramide Signal Amplification FISH with Alex<strong>and</strong>riumfundyense cells <strong>and</strong> HRP-labelled probe ATNA02 (John et al.2005), photographed at 40x objective lens.MaterialsLaboratory facilitiesMolecular biology laboratoryRequired Equipment (essential)The <strong>quantitative</strong> TSA-FISH in combination with solid phasecytometry requires the following equipment:• Solid phase cytometer• Epifluorescence microscope with motorised stage• Filter vacuum manifold or glass filter equipment• Hybridisation oven• Vacuum pump• Pipettes 1-20 µL, 100-100 µL + sterile tips, 1-50 mL pipette+ sterile tips• Autoclaved glassware• Disposable gloves, tweezers,• White polycarbonate filter membranes: 25 mm diameter,pore size depending on cell size• Support padsChemicals <strong>and</strong> ConsumablesSolutions <strong>for</strong> FixationSaline ethanol (Scholin et al. 1996), prepared freshly <strong>for</strong> eachexperiment because of the <strong>for</strong>mation of precipitates25 vol. 95 % ethanol2 vol. Milli-Q water3 vol. 25X SETor modified saline ethanol (Miller <strong>and</strong> Scholin 2000) stableat room temperature <strong>for</strong> several months without precipitate<strong>for</strong>mation22 vol. 95 % ethanol5 vol. Milli-Q water3 vol. 25X SET buffer25X SET3.75 M NaCl0.5 M Tris/HCl25 mM EDTApH 7.8, filter sterilisedSolutions <strong>for</strong> amplification reactionTNT-Buffer0.1 M Tris-HCL, pH 7.50.15M NaCl0.05 % Tween 20Tyramide substrate solutionOne volume of 40 % (wt/vol) dextrane sulfate (Sigma-Aldrich,Munich, Germany) in sterile deionised water, is mixed withone volume of amplification diluent <strong>and</strong> a 1:50 dilution ofthe fluorescein labelled tyramide (Perkin Elmer, Boston Ma,USA, diluted in Dimethylsulfoxide) in sterile deionised water<strong>and</strong> stored in the dark.Solution <strong>for</strong> counterstainingCitifluor/DAPI (4’,6’-diamidino-2-phenylindoline) mixture(0.5 mL sterile deionised water, 1 mL Citifluor (CitifluorLtd., Cambridge) <strong>and</strong> 1.5 µL DAPI solution (1 µg µL -1 , Invitrogen,Germany, in sterile deionised water)).ProbesHorseradish peroxidase labelled probes purchased from ThermoScientific, Germany are delivered lyophilized. The HRPlabelis anchored at the 5’-end of the oligonucleotide. Stocksolution of 1 µg µL -1 , <strong>and</strong> working solutions of 500 µL -1 <strong>and</strong>50 ng µL -1 should be prepared in 1X TE buffer, pH 7.8- 8.0.Probe stock solution should be stored at -80°C <strong>and</strong> workingsolutions at -20°C. Since, HRP-labelled probes are not lightsensitive it is not necessary to work in the dark. However,from the tyramide signal amplification step on working inthe dark is necessary, because of the incorporated light sensitiveFITC-labelled tyramide. More in<strong>for</strong>mation on the equipment,chemicals <strong>and</strong> consumables used in this method arepresented in the Appendix at the end of this chapter.MethodH<strong>and</strong>ling TimeBased on 10 samples processed in parallel0.5 h Set-up <strong>and</strong> filtering step1 h Fixation0.25 h Wash step <strong>and</strong> probe addition1.5 h Hybridisation <strong>and</strong> tyramide signal amplification0.5 h Analysis of 10 filter with solid phase cytometer0.5 h Clean upTOTAL HOURS 4.25 h105
IOC Manuals & Guides no 55Chapter 14 Tyramide signal amplification in combination with fluorescence in situ hybridisationSample Preservation <strong>and</strong> Storage• Filter 5 mL sample onto a polycarbonate filter with thelowest possible vacuum <strong>and</strong> incubate in the fixative <strong>for</strong> atleast 1 hour at room temperature or overnight at 4 ºC.• Remove the fixative by filtrating <strong>and</strong> incubating <strong>for</strong> 5 minuteswith hybridisation buffer Cell without concentrat a probe. ion ( cells LFilters can be dried <strong>and</strong> stored <strong>for</strong> at least one month at roomtemperature or hybridised directly afterwards.Quenching of Natural Occurring Peroxidases• Quench naturally occurring endogenous peroxidase activityby treating the filters with 100 µL 3 % H 2O 2perfilter at room temperature <strong>for</strong> 15 to 30 minutes to avoidunspecific staining.• Rinse the filter in sterile deionised water to remove excessH 2O 2.Hybridisation• Cover the filters with 80-100 µL hybridisation buffercontaining the horse radish peroxidase labelled probe(final concentration of probe in hybridisation buffer:5 ng µL -1 ) <strong>and</strong> hybridise 1.5-2 hours at 37 ºC.• Stop the hybridisation by adding pre-warmed (37 ºC) 1XSET wash buffer <strong>and</strong> then wash the filters with 1X SET<strong>for</strong> 10 minutes at 37 ºC.Tyramide Signal Amplification• Equilibrate the filters <strong>for</strong> 15 minutes in TNT buffer atroom temperature.• Remove excess liquid by putting the filters on blottingpaper, staining should be conducted be<strong>for</strong>e they are completelydry.• Incubate each filter with 100 µL Tyramide substrate solution<strong>for</strong> approximately 30 minutes at room temperaturein the dark.• Rinse the filters in TNT-buffer <strong>and</strong> wash <strong>for</strong> 15 minutesat 55 ºC in TNT-buffer. Then rinse the filter in steriledeionised water, air dry <strong>and</strong> store at -20 ºC pending analysisby ChemScan.Optional StepCounterstaining• Counterstain the filters with a Citifluor/DAPI mixture<strong>for</strong> 10 minutes at room temperature. Wash with steriledeionised water <strong>for</strong> 1 minute <strong>and</strong> incubate in 80 % ethanol(v/v) <strong>for</strong> 30 seconds to remove an excess of stainingsolution. Air Dry <strong>and</strong> store at -20 ºC or examine directlywith the ChemScan. Citifluor is used as an antifade<strong>and</strong> the blue DAPI nucleic acid stain effectively stainsdouble str<strong>and</strong>ed DNA <strong>and</strong> enables a general overview ofall cells on a hybridised filter.Formulas <strong>for</strong> Calculating ResultsThe entire filter is automatically counted by the solid phasecytometer <strong>and</strong> afterwards validated r<strong>and</strong>omly by the operator.Hence the cell number is reflective of the amount of originalsample that was processed <strong>and</strong> preserved as well as a the volumethat was filtered <strong>for</strong> hybridisation.−1To calculate cells L -1 :− 1 ⎛ Positive cell countCell concentrat ion ( cells L ) = ⎜⎝ Volume of sa⎛ Positive cell count on whole filter ( N)⎞) = ⎜⎟ * 1000⎝ Volume of sample ( mL ) ⎠where N is the number of positive cells on the whole filter <strong>and</strong>V (mL) is the volume of sample used.Analysis of hybridised filters with SPC in combinationwith epifluorescence microscopyThe ChemScan system (Fig. 3) must be calibrated on adaily basis with a st<strong>and</strong>ardised amount of FITC labelled latexbeads, diameter 2-3 µm (St<strong>and</strong>ard C, Chemunex, France), in100 µL. In order to verify that the laser is working properly,the number of fluorescence signals recorded by the Chem-Scan must be cross referenced with the number of countedlatex beads in solution.1. The 100 µL solution with the latex beads is filtered ontoa black polycarbonate membrane (25 mm diameter, 0.2µm pore size, Chemunex, France). To support the filtermembrane, a black support pad is mounted by applying100 µL ChemSol B16 (Chemunex, France) to a membraneholder. Then the filter membrane with latex beadsis laid onto the support pad. The filter is scanned withthe application C control.2. For TSA-FISH filter also a black support pad is mountedby applying 100 µL ChemSol B16 (Chemunex, France),overlaid by the hybridised filter <strong>and</strong> the the applicationtvcbio1 (tvc: total viable counts) is used. The peak intensityis manually changed from 250 to 2500 to preventthe enumeration of false positive autofluoresing particleswith lower peak fluorescence intensity.3. Immediately after the scan, signals are validated usingan epifluorescence microscope (Nikon, Eclipse E 800)equipped with filter blocks <strong>for</strong> FITC (Nikon Filter BlockB-2A) <strong>and</strong> DAPI (Nikon Filter Block UV-2A) <strong>and</strong> witha motorised stage (Prior Scientific, UK). Images are capturedwith a digital camera (CCD-1300CB, Vosskühler,Germany) <strong>and</strong> analysed with the Nikon software LuciaG.DiscussionTraditional FISH <strong>methods</strong> have limitations when countingsamples with low target cell densities as well as in the numberof samples that can be analysed per day. The time involved tocount an environmental sample will vary with the diversityof the sample <strong>and</strong> the skill of the operator. For a high samplethroughput, FISH has been combined with flow cytometry,which allows the analysis of different cell parameters.However, a combination of flow cytometry <strong>and</strong> microscopy ofsingle detected fluorescent microalgae is difficult. In addition,because of the limited sensitivity at lower cell concentrationsthis method is not suited <strong>for</strong> the detection of cells at lowconcentrations in environmental samples. The solid phase106
<strong>Microscopic</strong> <strong>and</strong> Molecular Methods <strong>for</strong> Quantitative Phytoplankton AnalysisChapter 14 Tyramide signal amplification in combination with fluorescence in situ hybridisationReferencesFigure 3. Overlapping scan with the ChemScan.cytometer has the advantage of a direct combination ofautomated counting <strong>and</strong> epifluorescence microscopy, allowingthe microscopically verification of each single cell detected.The solid phase cytometry in combination with TSA-FISHenables the efficient detection of a single cell in a filteredvolume in less than 5 h. For a reliable automated detectionof target cells with the ChemScan, signal amplification isnecessary. This method has great potential <strong>for</strong> application inanalysing field material where a rapid <strong>and</strong> reliable detection<strong>and</strong> enumeration of target cells is required. The shape of thealgae may cause problems, e.g., the ChemScan cannotcount long chain <strong>for</strong>ming cells like Pseudo-nitzschia cells. Theadaptation of improved software could help to overcome thisproblem. Additionally, the actual high price of this machine<strong>and</strong> the additional costs of an epifluorescence microscopeequipped with an automatic stage is a limiting factor.AcknowledgementsThe work was funded by the Stiftung Alfred-Wegener-Institutfür Polar und Meeres<strong>for</strong>schung in the Helmholtz-Gesellschaft,Bremerhaven, Germany, in part by EU DETAL ,project QLRT-1999-30778 <strong>and</strong> Chemunex, Ivry, France.Darynkiewicz Z, Smolewski P, Bedner E (2001) Use of flow<strong>and</strong> laser scanning cytometry to study mechanisms regulatingcell cycle <strong>and</strong> controlling cell death. Clin Chem LabMed 21:857-873John U, Medlin LK, Groben R (2005) Development of specificrRNA probes to distinguish between geographic cladesof the Alex<strong>and</strong>rium tamarense species complex. J PlanktonRes 27:199-204Kamentsky LA (2001) Laser scanning cytometry. MethodsMol Cell Biol 63:51-87Lemarch<strong>and</strong> K, Parthuisot N, Catala P, Lebaron P (2001)Comparative assessment of epifluorescence microscopy,flow cytometry <strong>and</strong> solid-phase cytometry used in the enumerationof specific bacteria in water. Aquat Microb Ecol25:301-309Mignon-Godefroy K, Guillet JC, Butor C (1997) Laser scanningcytometry <strong>for</strong> the detection of rare events. Cytometry27:336-344Miller PE, Scholin CA (2000) On detection of Pseudo-nitzschia(Bacillariophyceae) species using whole cell hybridization: Samplefixation <strong>and</strong> stability. J Phycol 36:238-250Roubin MR, Pharamond JS, Zanelli F, Poty F, Houdart S,Laurent F, Drocourt, JL, Van Poucke S (2002) Applicationof laser scanning cytometry followed by epifluorescent <strong>and</strong>differential interference contrast microscopy <strong>for</strong> the detection<strong>and</strong> enumeration of Cryptosporidium <strong>and</strong> Giardia inraw <strong>and</strong> potable waters. J Appl Microbiol 93:599-607Reynolds DT, Fricker CR (1999) Application of laser scanning<strong>for</strong> the rapid <strong>and</strong> automated detection of bacteria inwater samples. J Appl Microbiol 86:785-795Scholin CA, Buck KR, BritschigT, Cangelosi G, Chavez FP(1996) Identification of Pseudo-nitzschia australis (Bacillariophyceae)using rRNA-targeted probes in whole cell <strong>and</strong>s<strong>and</strong>wich hybridization <strong>for</strong>mats. Phycologia 35:190-197Töbe K, Eller G, Medlin LK (2006) Automated detection<strong>and</strong> enumeration of Prymnesium parvum (Haptophyta:Prymnesiophyceae) by solid-phase cytometry. J PlanktonRes 28:643-657West NJ, Bacchieri R, Hansen G, Tomas C, Lebaron P,Moreau H (2006) Rapid quantification of the toxic algaPrymnesium parvum in natural samples by use of a specificmonoclonal antibody <strong>and</strong> solid-phase cytometry Appl EnvirMicrobiol 72:860-868107
IOC Manuals & Guides no 55Chapter 14 Tyramide signal amplification in combination with fluorescence in situ hybridisationAppendixTable 1. Equipment <strong>and</strong> suppliers.Equipment Supplier Cat. Number € US $Filter Manifold Millipore, USA XX2702550 400 587Vacuum pump Omnilab, Germany 9.881 391 574Incubator ”Shake’n’Stack” VWR, Germany 7996 2310 3387Epifluorescence microscope, e.g. NikonEclipse E800 with motorized stageNikon, Japan MAA600BA 29000 42521Solid phase cytometer e.g. ChemScan Chemunex, France 152000 222870Table 2. Chemicals <strong>and</strong> suppliers.Chemicals Supplier Cat. Number € US $Ethanol, absolute, 1L Merck 1.009.832.500 73 107Milli-Q waterMost labs have an inhousesupplySodium chloride, 1 kg Sigma-Aldrich S9888 23 34Tris/HCl, 500 g Sigma-Aldrich T3253 96 141Nonidet-P40, 100 mL Roche 11754599 74 109EDTA, 500 g Sigma-Aldrich E7889 56 82Isopore white polycarbonate membranefilter, 3 µm pore size, Qty. 100Millipore TSTP02500 130 191Hydrogene peroxide Pharmacy - 4 6HRP-labelled probe, approx. 300 µg Thermo Scientific - 235 345Deionized <strong>for</strong>mamide, 100 mL Sigma-Aldrich F 9037 46 67108
<strong>Microscopic</strong> <strong>and</strong> Molecular Methods <strong>for</strong> Quantitative Phytoplankton AnalysisAppendix: Acronyms <strong>and</strong> NotationAcronymABDADPAALGADECapprox.ARBBSACCDCENChemScanChl aCICEETCPRCTDdH 2ODAPIDICDICANNDSPECOHABEPAESDESPEUEU DETALFISHFITFITCFlowCAMFSWFTFGF/FHAB(s)HAB BuoyHAE(s)HybeICESIOCLEDLMLSUMBARINASANOAANSFONRPCRPFAPICODIVPSPQCrDNARNasesrRNART-PCRSEMSOPSSUTEMTSA-FISHUNESCOwt/volMeaningArea-Based spherical DiameterN-Phenyl-1,4-benzenediamine hydrochlorideDevelopment of a RNA -Biosensor <strong>for</strong> the Detection of Toxic AlgaeApproximately“arbor ”=treeBovine Saline ACharge Coupled DeviceComité Europeén De NormalisationLazer scanning Process Analyser/solid-phase cytometry (Scan RDI in North America)Chlorophyll aCooperative Institute <strong>for</strong> Coastal <strong>and</strong> Estuarine TechnologyContinuous Plankton RecorderConductivity, Temperature, Depthdistilled water4’,6-diamidino-2-phenylindolineDifferential interference contrastDinoflagellate Categorisation by Artificial Neural NetworkDiarrhetic Shellfish PoisoningThe Ecology <strong>and</strong> Oceanography of Harmful Algal BloomsEnvironmental Protection AgencyEquivalent Spherical DiameterEnvironmental Sample ProcessorEuropean UnionRapid <strong>and</strong> ultra-sensitive fluorescent test <strong>for</strong> the tracking of toxic algae in the marine environmentFluorescence In Situ HybridisationFluid Imaging TechnologiesFluorescein isothiocyanateFlow Cytometer And MicroscopeFiltered Sea WaterFilter-Transfer-FreezeGlass Fibre FiltersHarmful Algal Bloom(s)Harmful Algal Bloom BuoyHarmful Algal Event(s)HybridisationInternational Council <strong>for</strong> the Exploration of the SeaIntergovernmental Oceanographic Comission of UNESCOLight-Emitting DiodeLight MicroscopyLarge SubUnitMonterey Bay Aquarium Research InstituteNational Aeronautics <strong>and</strong> Space AdministrationNational Oceanic <strong>and</strong> Atmospheric AdministrationNational Science FoundationOffice of Naval ResearchPolymerase Chain ReactionPara<strong>for</strong>maldehydePicoplankton DiversityParalytic Shellfish PoisoningQuality ControlRibosomal Deoxyribonucleic AcidRibonucleasesRibosomal Ribonucleic AcidReal-Time PCRPlease note that RT-PCR usually refers to reverse transcriptase PCR, In this manual the acronymrefers to Real Time PCR.Scanning electron MicroscopySt<strong>and</strong>ard Operating ProcedureSmall SubUnitTransmission Electron MicroscopyTyramide Signal Amplification has been used with FISHUnited Nations Educational Scientific <strong>and</strong> Cultural Organisationweight/volume109
IOC Manuals & Guides no 55SI UnitMeaningI 2IodineKIPotassium IodidemLmillilitreLLitrecmCentimetrehrHourºC Degree Celsius% Percentageµm Micrometremm 2Millimetre squaredMin -1Per minuteHgMercurynNumbergGram(s)µL Microlitresv/vVolume to volumex gMultiplied by gravity110
<strong>Microscopic</strong> <strong>and</strong> Molecular Methods <strong>for</strong> Quantitative Phytoplankton AnalysisList of previous titles in the series continued:19 Guide to IGOSS Specialized Oceanographic Centres (SOCs). 1988. 17 pp. (English, French, Spanish,Russian)20 Guide to Drifting Data Buoys. 1988. 71 pp. (English, French, Spanish, Russian)21 (Superseded by IOC Manuals <strong>and</strong> Guides No. 25)22 GTSPP Real-time Quality Control Manual. 1990. 122 pp. (English)23 Marine In<strong>for</strong>mation Centre Development: An Introductory Manual. 1991. 32 pp. (English, French,Spanish, Russian)24 Guide to Satellite Remote Sensing of the Marine Environment. 1992. 178 pp. (English)25 St<strong>and</strong>ard <strong>and</strong> Reference Materials <strong>for</strong> Marine Science. Revised Edition. 1993. 577 pp. (English)26 Manual of Quality Control Procedures <strong>for</strong> Validation of Oceanographic Data. 1993. 436 pp. (English)27 Chlorinated Biphenyls in Open Ocean Waters: Sampling, Extraction, Clean-up <strong>and</strong> InstrumentalDetermination. 1993. 36 pp. (English)28 Nutrient Analysis in Tropical Marine Waters. 1993. 24 pp. (English)29 Protocols <strong>for</strong> the Joint Global Ocean Flux Study (JGOFS) Core Measurements. 1994. 178 pp .(English)30 MIM Publication Series:Vol. 1: Report on Diagnostic Procedures <strong>and</strong> a Definition of Minimum Requirements <strong>for</strong> ProvidingIn<strong>for</strong>mation Services on a National <strong>and</strong>/or Regional Level. 1994. 6 pp. (English)Vol. 2: In<strong>for</strong>mation Networking: The Development of National or Regional Scientific In<strong>for</strong>mationExchange. 1994. 22 pp. (English)Vol. 3: St<strong>and</strong>ard Directory Record Structure <strong>for</strong> Organizations, Individuals <strong>and</strong> their ResearchInterests. 1994. 33 pp. (English)31 HAB Publication Series:Vol. 1: Amnesic Shellfish Poisoning. 1995. 18 pp. (English)32 Oceanographic Survey Techniques <strong>and</strong> Living Resources Assessment Methods. 1996. 34 pp.(English)33 Manual on Harmful Marine Microalgae. 1995. (English) [superseded by a sale publication in 2003,92-3-103871-0. UNESCO Publishing]34 Environmental Design <strong>and</strong> Analysis in Marine Environmental Sampling. 1996. 86 pp. (English)35 IUGG/IOC Time Project. Numerical Method of Tsunami Simulation with the Leap-Frog Scheme.1997. 122 pp. (English)36 Methodological Guide to Integrated Coastal Zone Management. 1997. 47 pp. (French, English)37 Post-Tsunami Survey Field Guide. First Edition. 1998. 61 pp. (English, French, Spanish, Russian)38 Guidelines <strong>for</strong> Vulnerability Mapping of Coastal Zones in the Indian Ocean. 2000. 40 pp. (French,English)39 Manual on Aquatic Cyanobacteria – A photo guide <strong>and</strong> a synopsis of their toxicology. 2006. 106pp. (English)40 Guidelines <strong>for</strong> the Study of Shoreline Change in the Western Indian Ocean Region. 2000. 73 pp.(English)41 Potentially Harmful Marine Microalgae of the Western Indian Ocean. Microalgues potentiellementnuisibles de l’océan Indien occidental. 2001. 104 pp. (English/French)42 Des outils et des hommes pour une gestion intégrée des zones côtières - Guide méthodologique,vol.II/Steps <strong>and</strong> Tools Towards Integrated Coastal Area Management – Methodological Guide, Vol.II. 2001. 64 pp. (French, English; Spanish)43 Black Sea Data Management Guide (Cancelled)44 Submarine Groundwater Discharge in Coastal Areas – Management implications, measurements<strong>and</strong> effects. 2004. 35 pp. (English)113
IOC Manuals & Guides no 5545 A Reference Guide on the Use of Indicators <strong>for</strong> Integrated Coastal Management. 2003. 127 pp.(English). ICAM Dossier No. 146 A H<strong>and</strong>book <strong>for</strong> Measuring the Progress <strong>and</strong> Outcomes of Integrated Coastal <strong>and</strong> Ocean Management.2006. iv + 215 pp. (English). ICAM Dossier No. 247 TsunamiTeacher – An in<strong>for</strong>mation <strong>and</strong> resource toolkit building capacity to respond to tsunamis<strong>and</strong> mitigate their effects. 2006. DVD (English, Bahasa Indonesia, Bangladesh Bangla, French,Spanish, <strong>and</strong> Thai)48 Visions <strong>for</strong> a Sea Change. Report of the first international workshop on marine spatial planning.2007. 83 pp. (English). ICAM Dossier No. 449 Tsunami preparedness. In<strong>for</strong>mation guide <strong>for</strong> disaster planners. 2008. (English, French, Spanish)50 Hazard Awareness <strong>and</strong> Risk Mitigation in Integrated Coastal Area Management. 2009. 141 pp.(English). ICAM Dossier No. 551 IOC Strategic Plan <strong>for</strong> Oceanographic Data <strong>and</strong> In<strong>for</strong>mation Management (2008–2011). 2008. 46pp. (English)52 Tsunami risk assessment <strong>and</strong> mitigation <strong>for</strong> the Indian Ocean; knowing your tsunami risk – <strong>and</strong>what to do about it. 2009. 82 pp. (English)53 Marine Spatial Planning. A Step-by-step Approach. 2009. 96 pp. (English). ICAM Dossier No. 654 Ocean Data St<strong>and</strong>ards Series:Vol. 1: Recommendation to Adopt ISO 3166-1 <strong>and</strong> 3166-3 Country Codes as the St<strong>and</strong>ard <strong>for</strong>Identifying Countries in Oceanographic Data Exchange. 2010. 13 pp. (English)55 <strong>Microscopic</strong> <strong>and</strong> Molecular Methods <strong>for</strong> Quantitative Phytoplankton Analysis. 2010. 114 pp. (English)114
The Intergovernmental Oceanographic Commission (IOC) of UNESCO celebrates its 50th anniversary in 2010. Since taking thelead in coordinating the International Indian Ocean Expedition in 1960, the IOC has worked to promote marine research, protectionof the ocean, <strong>and</strong> international cooperation. Today the Commission is also developing marine services <strong>and</strong> capacity building, <strong>and</strong> isinstrumental in monitoring the ocean through the Global Ocean Observing System (GOOS) <strong>and</strong> developing marine-hazards warningsystems in vulnerable regions. Recognized as the UN focal point <strong>and</strong> mechanism <strong>for</strong> global cooperation in the study of the ocean, akey climate driver, IOC is a key player in the study of climate change. Through promoting international cooperation, the IOC assistsMember States in their decisions towards improved management, sustainable development, <strong>and</strong> protection of the marine environment.