Dodge & Cox Funds Statutoary Prospectus dated May 1, 2013
Dodge & Cox Funds Statutoary Prospectus dated May 1, 2013
Dodge & Cox Funds Statutoary Prospectus dated May 1, 2013

You also want an ePaper? Increase the reach of your titles
YUMPU automatically turns print PDFs into web optimized ePapers that Google loves.
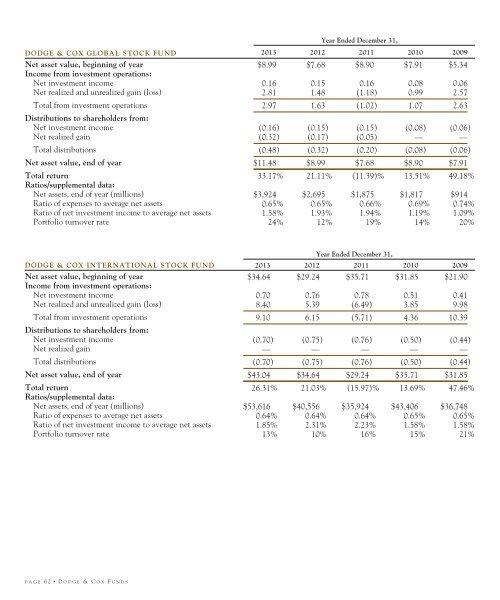
Year Ended December 31,DODGE & COX GLOBAL STOCK FUND<strong>2013</strong> 2012 2011 2010 2009Net asset value, beginning of year $8.99 $7.68 $8.90 $7.91 $5.34Income from investment operations:Net investment income 0.16 0.15 0.16 0.08 0.06Net realized and unrealized gain (loss) 2.81 1.48 (1.18) 0.99 2.57Total from investment operations 2.97 1.63 (1.02) 1.07 2.63Distributions to shareholders from:Net investment income (0.16) (0.15) (0.15) (0.08) (0.06)Net realized gain (0.32) (0.17) (0.05) — —Total distributions (0.48) (0.32) (0.20) (0.08) (0.06)Net asset value, end of year $11.48 $8.99 $7.68 $8.90 $7.91Total return 33.17% 21.11% (11.39)% 13.51% 49.18%Ratios/supplemental data:Net assets, end of year (millions) $3,924 $2,695 $1,875 $1,817 $914Ratio of expenses to average net assets 0.65% 0.65% 0.66% 0.69% 0.74%Ratio of net investment income to average net assets 1.58% 1.93% 1.94% 1.19% 1.09%Portfolio turnover rate 24% 12% 19% 14% 20%Year Ended December 31,DODGE & COX INTERNATIONAL STOCK FUND<strong>2013</strong> 2012 2011 2010 2009Net asset value, beginning of year $34.64 $29.24 $35.71 $31.85 $21.90Income from investment operations:Net investment income 0.70 0.76 0.78 0.51 0.41Net realized and unrealized gain (loss) 8.40 5.39 (6.49) 3.85 9.98Total from investment operations 9.10 6.15 (5.71) 4.36 10.39Distributions to shareholders from:Net investment income (0.70) (0.75) (0.76) (0.50) (0.44)Net realized gain — — — — —Total distributions (0.70) (0.75) (0.76) (0.50) (0.44)Net asset value, end of year $43.04 $34.64 $29.24 $35.71 $31.85Total return 26.31% 21.03% (15.97)% 13.69% 47.46%Ratios/supplemental data:Net assets, end of year (millions) $53,616 $40,556 $35,924 $43,406 $36,748Ratio of expenses to average net assets 0.64% 0.64% 0.64% 0.65% 0.65%Ratio of net investment income to average net assets 1.85% 2.31% 2.23% 1.58% 1.58%Portfolio turnover rate 13% 10% 16% 15% 21%PAGE 62 ▪ D ODGE & C OX F UNDS