Dodge & Cox Funds Statutoary Prospectus dated May 1, 2013
Dodge & Cox Funds Statutoary Prospectus dated May 1, 2013
Dodge & Cox Funds Statutoary Prospectus dated May 1, 2013

Create successful ePaper yourself
Turn your PDF publications into a flip-book with our unique Google optimized e-Paper software.
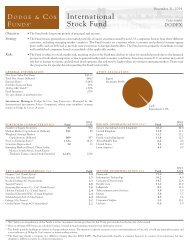
An investment in the Fund is not a deposit of abank and is not insured or guaranteed by the FederalDeposit Insurance Corporation or any othergovernment agency.PERFORMANCE INFORMATIONThe following bar chart and table are intended to help youunderstand the risks of investing in the Fund. The barchart shows changes in the Fund’s returns from year toyear. The table shows how the Fund’s average annual totalreturns for one, five, and ten years compare to that of abroad measure of market performance.The Fund’s past performance (before and after taxes) doesnot necessarily indicate how the Fund will perform inthe future. Visit the Fund’s website at www.dodgeandcox.comor call 800-621-3979 for current performance figures.DODGE & COX INTERNATIONAL STOCK FUNDAnnual total returns 2004-<strong>2013</strong> (%)32.4616.7428.0011.7147.4613.6921.03 26.31AVERAGE ANNUAL TOTAL RETURNSFOR THE PERIODS ENDED 12/31/<strong>2013</strong><strong>Dodge</strong> & <strong>Cox</strong>International Stock Fund 1 Year 5 Years 10 YearsReturn before taxes 26.31% 16.58% 9.77%Return after taxes on distributions 25.97 16.43 9.40Return after taxes on distributionsand sale of Fund shares 15.43 13.71 8.30MSCI EAFE (Europe, Australasia,Far East) Index (Net)* (reflectsno deduction for expenses or taxes) 22.79 12.44 6.91* MSCI Index (Net) returns are calculated applying dividendwithholding rates applicable to non-resident persons who do notbenefit from double taxation treaties. Withholding rates applicableto the Fund may be lower.After-tax returns are calculated using the historicalhighest individual federal marginal income tax rates, butdo not reflect the impact of state or local taxes. Actualafter-tax returns may differ depending on your individualcircumstances. After-tax return figures do not apply to youif you hold your Fund shares through a tax-deferredarrangement such as a 401(k) plan or an individualretirement account.−15.97−46.6804 05 06 07 08 0910 11 12 13Highest/Lowest quarterly results during the time period were:Highest: 33.37% (quarter ended June 30, 2009)Lowest: –26.06% (quarter ended December 31, 2008)PAGE 10 ▪ D ODGE & C OX F UNDS