Extended abstract (PDF) - Sintef
Extended abstract (PDF) - Sintef
Extended abstract (PDF) - Sintef

You also want an ePaper? Increase the reach of your titles
YUMPU automatically turns print PDFs into web optimized ePapers that Google loves.
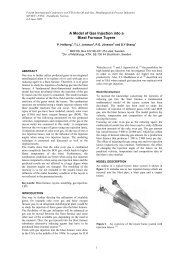
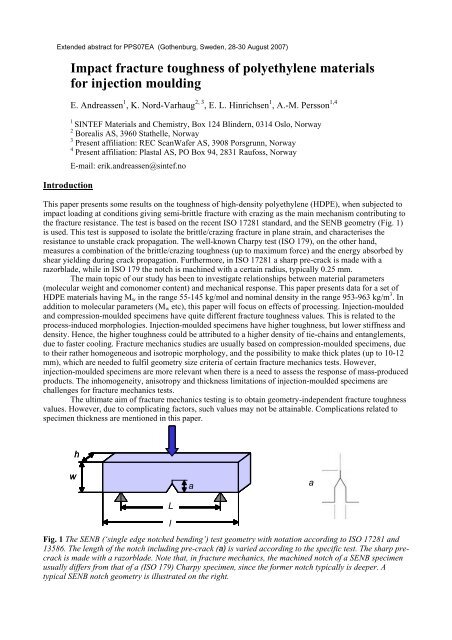
<strong>Extended</strong> <strong>abstract</strong> for PPS07EA (Gothenburg, Sweden, 28-30 August 2007)IntroductionImpact fracture toughness of polyethylene materialsfor injection mouldingE. Andreassen 1 , K. Nord-Varhaug 2, 3 , E. L. Hinrichsen 1 , A.-M. Persson 1,41SINTEF Materials and Chemistry, Box 124 Blindern, 0314 Oslo, Norway2 Borealis AS, 3960 Stathelle, Norway3 Present affiliation: REC ScanWafer AS, 3908 Porsgrunn, Norway4 Present affiliation: Plastal AS, PO Box 94, 2831 Raufoss, NorwayE-mail: erik.andreassen@sintef.noThis paper presents some results on the toughness of high-density polyethylene (HDPE), when subjected toimpact loading at conditions giving semi-brittle fracture with crazing as the main mechanism contributing tothe fracture resistance. The test is based on the recent ISO 17281 standard, and the SENB geometry (Fig. 1)is used. This test is supposed to isolate the brittle/crazing fracture in plane strain, and characterises theresistance to unstable crack propagation. The well-known Charpy test (ISO 179), on the other hand,measures a combination of the brittle/crazing toughness (up to maximum force) and the energy absorbed byshear yielding during crack propagation. Furthermore, in ISO 17281 a sharp pre-crack is made with arazorblade, while in ISO 179 the notch is machined with a certain radius, typically 0.25 mm.The main topic of our study has been to investigate relationships between material parameters(molecular weight and comonomer content) and mechanical response. This paper presents data for a set ofHDPE materials having M w in the range 55-145 kg/mol and nominal density in the range 953-963 kg/m 3 . Inaddition to molecular parameters (M w etc), this paper will focus on effects of processing. Injection-mouldedand compression-moulded specimens have quite different fracture toughness values. This is related to theprocess-induced morphologies. Injection-moulded specimens have higher toughness, but lower stiffness anddensity. Hence, the higher toughness could be attributed to a higher density of tie-chains and entanglements,due to faster cooling. Fracture mechanics studies are usually based on compression-moulded specimens, dueto their rather homogeneous and isotropic morphology, and the possibility to make thick plates (up to 10-12mm), which are needed to fulfil geometry size criteria of certain fracture mechanics tests. However,injection-moulded specimens are more relevant when there is a need to assess the response of mass-producedproducts. The inhomogeneity, anisotropy and thickness limitations of injection-moulded specimens arechallenges for fracture mechanics tests.The ultimate aim of fracture mechanics testing is to obtain geometry-independent fracture toughnessvalues. However, due to complicating factors, such values may not be attainable. Complications related tospecimen thickness are mentioned in this paper.hwaaLaLllFig. 1 The SENB (‘single edge notched bending’) test geometry with notation according to ISO 17281 and13586. The length of the notch including pre-crack (a) is varied according to the specific test. The sharp precrackis made with a razorblade. Note that, in fracture mechanics, the machined notch of a SENB specimenusually differs from that of a (ISO 179) Charpy specimen, since the former notch typically is deeper. Atypical SENB notch geometry is illustrated on the right.
Materials, experimental procedures and data analysisMaterials: High-density polyethylene (HDPE) materials supplied by Borealis were used in these tests. Allthe materials are commercial grades with injection moulding as the main application. Table 1 shows the maincharacteristics of the materials. The grades with the lowest densities are copolymers, with 1-butene ascomonomer. Ti-based Ziegler-Natta catalysts were used for all materials.Table 1 Material parameters and mechanical properties of the polyethylene grades used in this study. Theinformation is based on datasheets and information from Borealis. The mechanical properties weredetermined with specimens injection-moulded according to ISO 1872-2 and ISO 294-1.PE1 PE2 PE3 PE4 PE5 PE6MFR a [g/10min] 31 12 8 4 4 1.5M b n [kg/mol] 9 17 19 19 11 8M b w [kg/mol]M b z [kg/mol]55 74 90 1154751156851451140M w /M n 6.1 4.4 4.7 6.1 10.5 18.0Density c [kg/m 3 ] 960 961 963 954 953 956Modulus d [MPa] 1050 1150 1200 950 850 900Yield stress d [MPa]25 26 27 24 22 23Strain at yield d [%]9 9 8 10 10 10Charpy toughness e at -20°C [kJ/m 2 ]Charpy toughness e at 23°C [kJ/m 2 ]334467711ESCR f [h] ~1 < 10 < 10 10 40 110a MFR = Melt flow rate measured according to ISO 1133 (190°C/2.16kg)b Number-average (M n ), weight-average (M w ) and z-average (M z ) molecular weight calculated from size exclusionchromatography (SEC) data. The M z value of PE4 was not measured on the actual lot.c These data were measured on the actual lots. Standard: ISO 1183. Circular samples with diameter 5 mm were stampedout of 2 mm thick compression-moulded plates. The cooling rate of the compression moulding process was 15 K/min.d Tensile properties measured according to ISO 527-2. The cross-head speed was 1 mm/min for the tensile modulusdata and 50 mm/min at yield.e Charpy impact toughness measured according to ISO 179-1 with notched geometry type 1eA. The actuallots/specimens used in the fracture mechanics tests were also subjected to standard Charpy testing.f Environmental Stress Crack Resistance (ASTM D 1693). Some of these ESCR values were not measured on the actuallots.Injection moulding of test specimens: Charpy specimens (ISO 179 type 1 bars with dimensions l = 80 mm,w = 10 mm and h = 4 mm) were injection moulded with an Engel ES 330/65 machine. The injectionmoulding was performed according to ISO 294-1 and ISO 1872-2. The bars are filled along the lengthdirection, and ISO standards specify the melt front speed through the critical cross-section (h x w in ourcase). This value is 100 mm/s for PE, and the effective injection time was set according to this (ca. 0.8 s).The temperature of the melt was 210°C, and the mould temperature was 40°C. The packing time was 25 s,and the packing pressure was varied according to the MFR value in order to obtain the correct dimensions,and avoid sink marks, flash and other defects. The packing pressure was 90 MPa for the materials with MFRup to 4, and 70 MPa for the rest. The total cycle time was 45 s.Compression moulding of test specimens: Specimens were machined from compression-moulded plates,with thickness 4 mm (for making bars with w = 10 mm and h = 4 mm) and 8 mm (for making bars with w =20 mm and h = 8 mm). A Collins laboratory press was used with the following process for the 4 mm thickplates (based on ISO 1872-2):• Heating for 4 minutes from 23°C to 180°C, while the mould is closing• Heating for 10 minutes without pressure (180°C)• Packing for 5 minutes (16.5 MPa, 180°C)• Cooling for 11 minutes (16.5 MPa, 15 K/min)For the 8 mm thick plates a pressure of 0.3-0.4 MPa was applied during the second step, and a new step wasinserted after this (5 minutes, 1 MPa). Hence, the total cycle time was 35 minutes for the 8 mm thick plates.
Morphology of test specimens: Samples from the bulk, in the vicinity of the notch, of untested specimenswere analysed by differential scanning calorimetry (DSC), using a Perkin Elmer Pyris 1 instrument. Thesamples were heated (10 K/min) to 200°C, cooled (10 K/min) to 20°C and then heated again (10 K/min) to200°C. The degree of crystallinity was calculated from the normalised integral of the melting endotherm,using the value ΔH = 270 J/g [1] for the enthalpy of fusion of 100% crystalline PE. A density column wasused to measure the densities of samples taken from the bulk in the vicinity of the notch of untestedspecimens. The degree of crystallinity was also calculated from the measured density, using the followingvalues for the density of crystalline and amorphous PE: ρ c = 996 kg/m 3 [2] and ρ a = 850 kg/m 3 [3].Thin films(~ 10 μm) were microtomed from untested specimens, and characterised by optical (transmission)microscopy, using polarised light. The films were microtomed from two planes in the vicinity of the notch:The thickness–length plane (h–l plane in Fig. 1) and the thickness–width (h–w) plane.Fracture mechanics testing: The tests were based on ISO 17281 using the single edge notched bending(SENB) geometry. The standard conditions were 23°C and an impact speed of 1 m/s, and the tests wereperformed with a Rosand/Imatek instrumented falling weight impact tester The notches were milled, and precrackswere made with a razorblade. The large compression-moulded specimens (cross-section 20 mm x 8mm before notching) also had machined side-grooves (Fig. 2), in order to avoid shear lips. The side-grooveswere 0.8 mm deep on each side, giving an h value of 6.4 mm at the loaded cross-section. With thesematerials and specimens, dynamic effects (force oscillations) is a major concern at impact speeds around 1m/s and above. Hence, mechanical damping (silicone grease) was applied on all fracture mechanicsspecimens. Values for the dynamic flexural yield stress and the dynamic flexural modulus were also obtained(using un-notched specimens). The impact speed was 0.55 m/s, giving a similar time to yield as the time tofracture initiation in the fracture tests. The yield stress and modulus values were needed in some of the dataanalyses.Fig. 2 Testing of a specimen with a/w = 0.5. Note that this specimen also has so-called side-grooves(the vertical notches on picture to the right) with opening angle 45° and root radius 0.25 mm.Calculation of fracture mechanics parameters: ISO 17281 apply to linear-elastic fracture mechanics,characterising theresistance to unstable crack growth by the fracture toughness parameters K c (the criticalstress intensity factor– a force/stress based parameter) or G c (the critical energy release rate – an energybased parameter). Most PE materials are too tough for a linear-elastic description, even at impact conditions,and an elastic-plastic description must be used. A common parameter for elastic-plastic fracture mechanics isthe critical value of the J integral (J c ). (J c is equal to G c in the linear-elastic limit). There are several methodsfor obtaining J c . Based on work by Grellmann et al. [4] and Fasce et al. [5], we determined J c values fromdata obtained with ISO 17281, using the expression by Rice et al. [6]. This expression is the simplest andmost robust; other are sensitive to details in the calculation procedure (e.g. separation of elastic and plasticenergy), and require tensile data at similar strain rates. Two other expressions were assessed in the presentstudy, but the discussion of these expressions is beyond the scope of this paper.
ResultsDSC, density and microscopy (bars with h = 4 mm)Thermograms from the first heating (Fig. 3 and Table 2) reflect the crystalline structures of the specimens asused in the fracture mechanics test. The temperature range of the first melting endotherm is an indication ofthe lamella thickness distribution, although factors such as crystal defects and chain constraints also affectthe endotherm. As an illustrative reference, the theoretical estmate for the equilibrium melting point of aperfect infinite PE crystal is reported to be in the range 141-146 °C. Furthermore, the normalised integral ofthe endotherm (enthalpy of fusion, ΔH) of the first heating is a measure of the degree of crystallinity (weightfraction). In the second heating scan, compression-moulded and injection-moulded samples should havesimilar degree of crystallinity, as the history from the original moulding process should be erased to a largeextent.The crystallinities of samples from injection-moulded (IM) specimens vary from 62 to 69 wt% (1 stheating), and are correlated with the densities in Table 1. There may also be a molecular weight effectinvolved. For all samples from IM specimens, a higher crystallinity is recorded in the 2 nd heating, due to thelower cooling rate in the DSC than in the IM process. Also, note that for IM specimens the crystallinitiesrecorded during the first heating are correlated with those of the second heating (Fig. 4), indicating that theinjection moulding process does not induce totally different microstructures (in the core) from those obtainedduring slow cooling without flow.For PE3 it is observed that compression moulding (CM) gives higher crystallinity (1 st heating) thanIM, again due to the lower cooling rate. For the CM specimen, the crystallinity recorded during the firstheating is lower than that of the second. The nominal cooling rate was higher during compression moulding(15 K/min compared to 10 K/min in the DSC pan), but the effective rate at the core was lower, due to thethicker sample. The compression-moulded PE3 specimen had higher density than the injection-mouldedspecimen, in agreement with the DSC crystallinity trends.The peak melting temperature (T m ) is related to the average lamella thickness, and the upper-endtemperature of the melting regime, T u , is related to the lamellae with the highest melting point (i.e. thethickest lamellae). Fig. 3 shows that T m and T u values decrease with decreasing (data sheet) density. Hence,adding more short-chain branches (reducing the density) probably reduces the average and maximum lamellathickness. The highest T m and T u values were observed for the CM specimen. This must be due to the slowcooling, allowing for thick lamellae to develop.Some micrographs obtained with polarised light are shown in Fig. 5. As expected, the CM specimenis more homogeneous than the IM specimen. The former has a spherulitic morphology with spherulitediameter around 15-20 μm. The spherulites are slightly larger near the centre than near the surface (whichtouched the mould during compression moulding). A 15-20 μm thick skin layer shows somewhat differentpolarisation, perhaps due to transcrystallisation. The IM specimen has different morphological zones throughthe cross-section. This is well-known from the literature. The spherulites near the centre are somewhatsmaller than those in the CM specimen. With even higher magnification (not shown in Fig. 5), bandedspherulites are observed for the IM specimen. The structure near the surface of the IM specimen is too fine tobe resolved by optical microscopy. Sections of the IM specimen cut parallel and perpendicular to the flowdirection only differ slightly.Table 2 DSC and density results for samples cut out from the bulk in the vicinity of the crack of untestedspecimens (bars). The specimens were injection moulded, except ‘CM’ (compression moulded).PE2 PE3 PE3 PE4 PE5 PE6CMCrystallinity (DSC) [wt%] 69.1 77.0 68.9 63.6 62.3 64.6FirstPeak melting temp. , [°C] 133.5 136.4 134.5 131.4 131.8 131.2heatingOnset of melting a [°C] 125.8 126.9 125.0 129.0 124.5 122.4Second Crystallinity (DSC) [wt%] 75.3 73.2 73.5 68.4 65.4 67.8heating Peak melting temp. [°C] 132.8 132.1 132.5 131.3 130.0 130.3Density [kg/m 3 ] - 962 953 - - -a The onset of melting is defined as the intersection between the temperature axis and a tangent to the endotherm.
80Heat flowPE3 CMPE3PE2Crystallinity (2 nd heating) [wt%]75IMCM7065PE46060 65 70 75 80PE5Crystallinity (1 st heating) [wt% ]PE6Fig. 4 Crystallinities calculated from the 1 st and2 nd DSC heating scans. IM = Injection moulded.CM = Compression moulded. The figure is basedon data in Table 2.110 115 120 125 130 135 140 145 150Temperature [°C]Fig. 3 DSC traces for the first melting. Injectionmouldedspecimens, except ‘PE3 CM’ which wascompression moulded.Flexural modulus (un-notched bars with h = 4 mm)The flexural modulus of elasticity was measured at impact (dynamic) conditions. Data for injection-moulded(IM) specimens and compression-moulded (CM) specimens are shown in Table 3. CM specimens havehigher moduli than IM specimens. For quasi-static testing the difference is smaller; for PE6 the modulus of aCM specimen was 27% higher than for an IM specimen.In our data set for IM specimens, the dynamic moduli of most specimens are lower than moduli fromquasi-static tensile testing. This is probably not correct. Quasi-static moduli are obtained for strains between0.2 and 0.5% (ISO 527). In the dynamic data, a possibly higher slope at such low strains was hidden by forceoscillations.The (pseudo) moduli of IM specimens can be determined with somewhat higher certainty than thoseof CM specimens. The stress-strain curves of IM specimens are typically linear up to 3% strain, while thecurves of CM specimens are only linear up to 2% strain (using the same fitting criteria). The curves of CMspecimens also have stronger initial oscillations.Table 3 Flexural moduli at impact conditions.Bars with cross-section 4 mm (h) x 10 mm (w). Data based onthree parallels. Quasi-static properties from the data sheets are given for comparison (last row).PE1 PE2 PE3 PE4 PE5 PE6E, IM bars [GPa] – 1.04 ± .03 0.99 ± .04 0.87 ± .06 0.86 ± .03 0.89 ± .06E, CM bars [GPa] 1.37 ± .09 1.62 ± .04 1.50 ± .07 1.32 ± .02 1.18 ± .04 1.36 ± .02E quasi-static , IM bars [GPa] 1.05 1.15 1.20 0.95 0.85 0.90
Overview (specimen surface at bottom, centre of specimen indicated by dash-dot line)Position near the centrePE3 CM, E = 1.5 GPaPosition near the surfacePE3 IM, E= 1.0 GPa,Fig. 5 Optical microscopy of microtomed sections from 4 mm thick compression-moulded (left) and injectionmoulded(right) specimens. The sections of the injection-moulded specimen were cut parallel to the flowdirection. Values of the dynamic moduli (E) are given in the bottom line.
Fracture mechanics results (bars with w = 10 mm and h = 4 mm)In this section we will mainly focus on injection-moulded (IM) vs. compression-moulded (CM) specimens,but some other main trends will also be summarised. A fracture surface with some of the main features isshown in Fig. 6. The size of the craze zone increases with increasing molecular weight and decreasingdensity. When injection-moulded, the toughest material (PE6) does not fracture in a semi-brittle manner, asthe other materials.IM and CM specimens of PE3 are compared in Fig. 7 and Fig. 8. The CM specimen absorbs lessenergy to peak force (less pronounced craze zone), and also seems to absorb less energy during crackpropagation (no clear shear lips).Fig. 6 Left: Optical microscopy of fracture surface of IM PE3. The crack tip (notch) made with a razorbladeis indicated by the red arrows. Right: Fractured specimen (fracture surfaces inside the red circle). Also notethe strain gauge that was used on some specimens.MG9621 - IMIM a=6mmCM a=5mmFig. 7 Representative fracture surfaces for injection-moulded (IM) and compression-moulded (CM)specimens of PE3 (h = 4 mm and w = 10 mm).
6040IM vs. CM specimens – PE3h =4mm, w =10mm, a/w =0.53, v =1m/s, T =23°CIMCMForce [N]2000.0E+00 1.0E-03 2.0E-03 3.0E-03Time [s]Fig. 8 Force vs. time for injection-moulded (IM) and compression-moulded (CM) PE3 specimens.Note that the oscillations before and after the peak force, are highly reproducible. Only the curveup to maximum force is used for calculating the fracture mechanics parameter in this study.Fracture toughness values are shown in Table 4. Note that IM specimens have higer G C and J Cvalues, but lower K C values (i.e. lower maximum force). The difference between IM and CM specimens islarger for larger for PE5 than for PE3. Charpy (ISO 179) data for PE6 showed even larger differences. At23°C the IM specimen had a factor 3.5 higher Charpy toughness, while at -20°C the factor was 2.0.With the linear-elastic approach (G C and K C ), the criteria given in the standard could not always besatisfied with these specimen dimensions and the chosen notch depths and test conditions (impact speed andtemperature).Table 4 Results for linear-elastic fracture toughness (K C and G C ), elastic-plastic fracture toughness (J C ).The impact speed was 1 m/s and the temperature was 23 °C. Only fracture mechanics parameters in bold arevalid with regard to the criteria of the standards/protocols.K C[MPa m 0.5 ]G C[kJ/m 2 ]J C[kJ/m 2 ]PE2 IM 1.38 ±0.1 2.05 1.5 ±0.3PE3 IM 1.55 ±0.1 2.4 1.9 ±0.5PE3 CM 1.60 ±0.1 1.6 1.5 ±0.1PE4 IM 1.7 ±0.1 2.8 3.6 ±0.2PE5 IM 1.8 ±0.1 3.6 ±0.3PE5 CM 1.93 ±0.03 2.1 ±0.3PE6 IM 7 ±1
Fracture mechanics results for large compression-moulded bars(w = 20 mm and h = 6.4 mm (8 mm minus side-grooves))The most common validity criteria for elastic-plastic fracture mechanics tests were satisfied when usingcompression-moulded bars with this cross-section. Also, the side-grooves prevented the formation of shearlips (yielding), thereby isolating a semi-brittle plane-strain fracture with crazing as the main mechanismcontributing to the fracture resistance. All the criteria of ISO 17281 (linear-elastic fracture mechanics) werestill only satisfied for PE1, PE2 and PE3 (with our rather conservative yield stress values). Typical loadcurves for PE1 (the least tough material) and PE6 (the toughest material) are shown in Fig. 9. Note that PE6exhibits a time to fracture which is a factor 2 higher than that of PE1.250200PE1, side-grooved CM specimensh = 6.4mm, w = 20mm, a/w = 0.52v = 1m/s, T = 23°CForce [N]1501005000.0E+00 1.0E-03 2.0E-03Time [s]250200PE6, side-grooved CM specimensh = 6.4mm, w = 20mm, a/w = 0.52v = 1m/s, T = 23°CForce [N]1501005000.0E+00 1.0E-03 2.0E-03Time [s]Fig. 9 Recorded force vs. time for PE1 (upper diagram) and PE6. Data for three tested specimens are shown(red, blue and green curves).
The main trends for this set of materials are the same as reported earlier. The main effects ofmolecular weight and density are seen in Fig. 10.For the materials PE3 and PE5, compression-moulded specimens were made in two ‘sizes’. Thelarge specimens (with w = 20 mm and h = 6.4 mm) gave higher toughness values for all three toughnessparameters (K C , G C and J C ). The values were a factor 1.3-1.4 higher.Finally, some comments on the reproducibility and statistics:• The reproducibility of the force vs. time curves is good, taking into account the impactspeed and the rather low forces involved, see Fig. 9.• The least tough material (PE1) had the lowest standard deviation of the J C value.• The average coefficient of variation (CV) for all six materials was 7 %.• The J C values generally had somewhat higher standard deviation and CV than the K Cvalues. The average CV of the K C values was 4%.65J c [kJ/m 2 ]4321Density:954-956 kg/m 3(comonomer: butene)Density:960-963 kg/m 300 50 100 150 200M w [kg/mol]Fig. 10 Fracture toughness vs. weight-average molecular weight for large compression-moulded bars.DiscussionGeneralBased on the literature from the last 20 years, we can say that the mechanisms resisting the initiation andpropagation of crack growth in HDPE (crazing, yielding), and their relationships with MWD (molecularweight distribution) and CCD (comonomer concentration, type and distribution) via morphology, arequalitatively understood. Fracture mechanics is an important tool in analysing structure-propertyrelationships. Some important features of fracture mechanics are 1) the isolation of fracture mechanisms and2) the concept of geometry-independent parameters. However, in order to analyse the performance of a set ofmaterials, a rigorous fracture mechanics approach needs to be complemented with high-quality datacharacterising the material (MWD, CCD), the morphology, and the fracture surfaces. This is especiallyimportant when analysing subtle effects of catalyst system or multimodality. Recent in-situ studies of cracktip deformation have also revealed interesting features.Quantitative impact fracture mechanics is not straight forward. The fracture mechanisms cansometimes not be decoupled, thermal effects may affect the tests results, and the size criteria in the literature
are perhaps not suitable for tough polymers. Furthermore, dynamic oscillations in the recorded force are aproblem at high impact speeds.A geometry-independent toughness value is the ideal. However, validity criteria, especially withregard to specimen size, are seldom mentioned in the scientific literature on impact fracture mechanics ofpolymers. When discussing and comparing the responses of different materials, all guidelines and criteriamay not need to be taken literally, i.e. some ‘technically invalid’ results may still be interesting, showingqualitatively correct trends.Fracture toughness vs. molecular weight and comonomer contentThe main trend for this set of materials is that the toughness increases with increasing weight-averagemolecular weight (M w ). This is known from the literature. It is attributed to increasing density ofinterlamellar tie-chains and chain entanglements, which give a higher craze fibril strength, and, hence, ahigher energy for initiation of fracture. An increase in the size of the craze zone with increasing M w is seenon the fracture surfaces.A higher comonomer content (lower bulk density) is also known to increase the density of tie-chains,at least in a certain range. Higher toughness for grades with lower bulk density is observed in our study.The two grades with similar M w and density (PE4 and PE5) have almost the same fracture toughness(within the uncertainty). The bimodal grade (PE5) has higher M z (Table 1), and should have a bettercomonomer distribution (more comomoners in the high MW fraction). On the other hand, the lower M n valuemay have a negative effect. Overall, it was expected that the bimodal grade would have a higher toughness.We will discuss this further in another publication, where also other mechanical parameters will be comparedfor these two materials.Finally, note that the tensile modulus of the material may affect the apparent impact toughnessindirectly via an adiabatic micomechanism. According to Leevers [7], adiabatic effects will reduce thetoughness with increasing modulus (G c proportional to E -1/3 ).Fracture toughness of injection-moulded (IM) vs. compression-moulded (CM) specimensFracture mechanics tests in the literature are usually performed with specimens machined from CM plates.This gives isotropic and homogeneous specimens (surface effects can be minimised by machining off thesurfaces of the original plate). IM specimens, on the other hand, always have a certain degree of anisotropy(processing-induced molecular orientation), and a skin-core variation in morphology (caused by a variationin cooling rate, pressure and shear stress during solidification). Another difference between CM and IMspecimens is the cooling rate, which is much higher for the latter. For an injection moulding grade of HPDE,the morphology obtained by injection moulding is the most relevant to probe by fracture mechanics testing.However, when testing IM specimens, possible effects of inhomogeneities and anisotropy should beassessed.In our data set, IM specimens are tougher 1 than CM specimens. The main explanation for the highertoughness of IM specimens is probably the higher density of tie-molecules and chain entanglements, due tothe higher cooling rate. Flow-induced orientation in the IM specimens may also play a role [8, 9]. In ourtests, the fracture plane is perpendicular to the flow direction in the IM process, i.e. the loading is parallel tothe flow direction. However, it is difficult to separate the orientation effect from the cooling rate effectwithout also testing specimens with loading perpendicular to the flow direction. This could be done bymachining out specimens from a plate with width at least the length of the specimens. Schrauwen et al. [8]reported that IM specimens with thickness above 1 mm and different injection temperatures, loaded paralleland perpendicular to the flow direction, had similar Izod impact toughness values. The toughness of a 1 mmthick CM plate was similar to that of a 1 mm thick IM specimen with low orientation level loadedperpendicular to the flow direction.The IM specimens have lower flexural modulus (Table 3). This must be due to the lower crystallinityin the core (Table 2), and probably also lower crystallinity out towards the surface. We are saying probably,because the shearing near the surface, and the pressure during crystallization further into the specimens,increase the nucleation and crystallization rates. Since the IM specimens have lower flexural modulus, theanisotropy effect (orientation in the flow direction) is overshadowed by the crystallinity effect.The yield stress may have a separate effect on the toughness. A lower yield stress will give a largerdamage zone, and also affect the relative amounts of crazing and shear yielding. CM and IM specimens have1 IM specimens have higher J C and G C values. However, the K C values are slightly lower. Different trends forparameters based on energy and force (stress field) are not uncommon in the literature.
different yield stress. Above the γ relaxation the yield stress should reflect the degree of crystallinity, whichis higher for CM specimens. In our tests with un-nnotched specimens in three-point bending at impactconditions, CM specimens have a higher stress than IM specimens at the highest strains in the test, but alocal maximum or a clear yield plateau was not reached in these tests. Results for two common yield criteriabased on the deviation from elastic behaviour were not conclusive regarding CM vs IM specimens. The firstcriterion was based on stiffness reduction to 95%. The other criterion was based on ‘strain offset’, i.e. theintersection between the stress curve and a line parallel to the elastic part of the curve, but translated (offset)to a higher strain. Strain offset values of 0.002 and 0.005 were tried. Testing with a high-speed tensile testeris planned.The standard deviation of the fracture toughness is typically lower for CM specimens than for IMspecimens. Optimising the IM process to obtain a more stable processing window, or controlling the IMprocess via pressure sensors in the mould, could reduce the shot-to-shot variation of the IM specimens.Removing the skin layer of the IM specimens could maybe also reduce the scatter. However, theinhomogeneous and anisotropic structure of IM specimens is unavoidable.Effect of specimen sizeOur data, as well as data from Imperial College London on some of the same materials, shows that the largecompression-moulded specimens give higher toughness values than the small compression-mouldedspecimens. In linear-elastic fracture mechanics, a lower or equal toughness value is expected whenincreasing the specimen thickness (h in Fig. 1), see Fig. 11. Williams [10] also reported a decrease in theapparent impact toughness of an HDPE when increasing the specimen thickness (h) in the range 6-12 mm.The higher apparent toughness of the large specimens in our study is in line with the thermaldecohesion model [7, [11,]. According to this model, G c should be a factor 2 1/3 (1.26) higher for specimenswith twice the size and the same shape. (According to ref. [7], G c is proportional to w 1/3 ). Our ratios for G cand J c are somewhat higher. It would be interesting to study size effects further, in particular to study theeffects of h and w independently. Size criteria for fracture mechanics of polymer materials is a field wherefurther work is needed, but this is beyond the scope of the present study.In the scientific literature on impact fracture mechanics of PE, the specimens are typically made from8-12 mm thick compression-moulded plates, i.e. h = 8-12 mm. However, size criteria are usually notdiscussed in the scientific literature. From a practical point of view, injection-moulded (IM) 4 mm thick(Charpy) specimens are interesting, because they can be made fast for extensive screening and routinetesting, and because their morphology is the relevant one for IM grades. Grellmann et al. [4] used such smallspecimens, and also focused on size criteria [12, 13, 14].Plane strainPlane stresshPlane stressSpecimen thicknessPlane straina)b)Fig. 11 a) Plastic zone around crack tip, and its variation through the specimen thickness (h), according tolinear-elastic fracture mechanics [15]. b) The resulting effect of specimen thickness (h) on apparenttoughness. Note the plane-strain lower-bound toughness plateau for thick specimens.Fracture toughness
In order to study effect of specimen thickness and processing further, we propose trying to weldtogether specimens, e.g. welding three specimens with cross-section 10 mm x 4 mm together, making aspecimen with h = 10 mm and w = 12 mm. Since the most common relative pre-crack length tests isa/w = 0.5 (used for K C and J C ), welding together three specimens would give us a pre-crack ending halfwaybetween two weld lines.Could differences in morphology contribute to the size effect? The cooling rate is lower at the centreof the 8 mm thick plate. Slower cooling would mean higher crystallinity and lower tie-chain density. Thedirect effect of this (if significant) would probably rather be the opposite, i.e. lower toughness for the thickerspecimen.Finally, it could be mentioned that for thin injection-moulded products the plane-stress toughness is arelevant value, although the plane-strain toughness is the ‘lower-bound’ (conservative) toughness. Differentmethods can be used to obtained the plane-stress toughness. Preliminary work by the authors indicates thatthe so-called reversed Charpy test [16, 17] may not be suitable for the least tough HDPE materials in thisstudy.ConclusionsValues for the fracture toughness of six injection moulding grades of HDPE were obtained. We havedetermined critical parameters for the onset of unstable crack growth in plane strain at impact conditions(1 m/s) and 23 °C. The testing and data analysis was based on the ISO 17281 standard (linear-elastic fracturemechanics) using the single edge notched bending (SENB) geometry. In addition, values for the critical Jintegral (elastic-plastic fracture mechanics) were calculated.• With compression-moulded side-grooved specimens machined from 8 mm thick plates, the toughnessvalues for all materials were valid in terms of criteria for elastic-plastic fracture mechanics (J integral).The formation of shear lips was prevented, and the craze zone length was quite uniform over the fracturesurface cross-section.• The fracture toughness increased with increasing M w and increasing comonomer content.• Injection-moulded specimens had higher fracture toughness than compression-moulded specimens.In both cases, the main morphological factor determining the fracture toughness was believed to be thedensity of tie-chains and chain entanglements. A higher ‘network’ density increases the strength of crazemicro-fibrils.• Two (compression-moulded) specimen sizes were tested, and the largest specimens gave the highesttoughness value. This could be explained by the thermal decohesion model by Leevers et al. Furtherwork is needed to assess size effects, in particular to study the effects of specimen height and width(SENB geometry) independently. This could also teach us more about how to interpret the results forinjection-moulded specimens, with limited (wall) thickness.
References[1] Cazenave J, Seguela R, Sixou B, Germain Y, Short-term mechanical and structural approaches for theevaluation of PE stress crack resistance, Polymer, 47, 3904 (2006)[2] Clark ES, Unit cell information on some important polymers, Ch. 30 in Physical Properties of PolymersHandbook, Mark JE (Ed.), American Institute of Physics, 1996[3] Welsh WJ, Densities of amorphous and crystalline polymers, Ch. 29 in Physical Properties of PolymersHandbook, Mark JE (Ed.), American Institute of Physics, 1996[4] Grellmann W, Seidler S, Hesse W, Procedure for determining the crack resistance behaviour using theinstrumented Charpy impact test,.p. 71 in Grellmann W, Seidler S (Eds.), Deformation and fracturebehaviour of polymers, Springer, 2001[5] Fasce LA, Pettarin V, Seltzer R, Frontini PM, Evaluation of impact fracture toughness of polymericmaterials by means of the J-integral approach, Polym. Eng. Sci., 43, 1081 (2003)[6] Rice JR, Paris PC, Merkle JG, Some further results of J-integral analysis and estimates, in Progress inflaw growth and fracture toughness testing, ASTM, STP 536, p. 231, 1973[7] Leevers PS, Why ductile thermoplastics sometimes fracture under impact, in Moore D (Ed.): TheApplication of Fracture Mechanics to Polymers, Adhesives and Composites, ESIS publ. 33, p 63, Elsevier;2003[8] Schrauwen BAG, Govaert LE, Peters GWM, Meijer HEH, The influence of flow-induced crystallizationon the impact toughness of high-density polyethylene, Macromol. Symp., 185, 89 (2002)[9] Schrauwen BAG, v. Breemen LCA, Spolstra AB, Govaert LE, Peters GWM, Meijer HEH. Structure,deformation, and failure of flow-oriented semicrystalline polymers, Macromolecules, 37, 8618 (2004)[10]Williams JG, p. 255 in Williams JG, Fracture mechanics of polymers, Ellis Horwood, 1984[11] Leevers PS, private communication[12] Grellmann W, Lach R, Seidler S, Determination of geometry-independent fracture mechanics values forpolymers, in Francois D, Pineau A (Eds.), From Charpy to present impact testing, ESIS Publ. 30, Elsevier,2002[13] Grellmann W, Lach R, Seidler S, Experimental determination of geometry-independent fracturemechanics values J, CTOD and K for polymers, Int. J. Fract., 118, L9 (2002)[14] Seidler S, Grellmann W, Determination of geometry-independent J-integral values of tough polymers,Int. J. Fract., 96, L17 (1999)[15] Williams JG, Fracture mechanics of polymers, Ellis Horwood, 1984[16] Leevers P, Plastics – Determination of impact plastic work dissipation – Reversed Charpy test, ESISTC4 test protocol, Version 2, October 2004[17] Paizis A, Leevers P, Orientation and strain cycle effects on the impact performance of polyethylene,Polymer Eng. Sci., 45, 596 (2005)