- Page 3:
ContentsCopyright © Glencoe/McGraw
- Page 7 and 8: 1-5 Algebra: Variables and Expressi
- Page 9 and 10: C H A P T E R1 Number Patterns and
- Page 11: Chapter 1 BUILD YOUR VOCABULARYVoca
- Page 14 and 15: 1-2 Prime FactorsMAIN IDEA• Find
- Page 16 and 17: 1-3Powers and ExponentsMAIN IDEA•
- Page 18 and 19: 1-4 Order of OperationsMAIN IDEA•
- Page 20 and 21: 1-4ORGANIZE ITOn the Lesson 1-4 tab
- Page 22 and 23: 1-5REMEMBER ITIn algebra, thesymbol
- Page 24 and 25: 1-6EXAMPLE Find the Rule for a Func
- Page 26 and 27: 1-8 Algebra: EquationsMAIN IDEA•
- Page 28 and 29: 1-9Algebra: Area FormulasMAIN IDEA
- Page 31 and 32: Chapter 1 BRINGING IT ALL TOGETHER1
- Page 33 and 34: C H A P T E R1ChecklistARE YOU READ
- Page 35 and 36: P T A E RH C2BUILD YOUR VOCABULARYT
- Page 37 and 38: 2-1 Problem-Solving Investigation:M
- Page 39 and 40: 2-2Step 1 Decide on a scale and . T
- Page 41 and 42: 2-2Check Your Progress SNOWFALL Mak
- Page 43 and 44: 2-3Check Your Progress INCOME The a
- Page 45 and 46: 2-4ORGANIZE ITUnder Lesson 2-4 in y
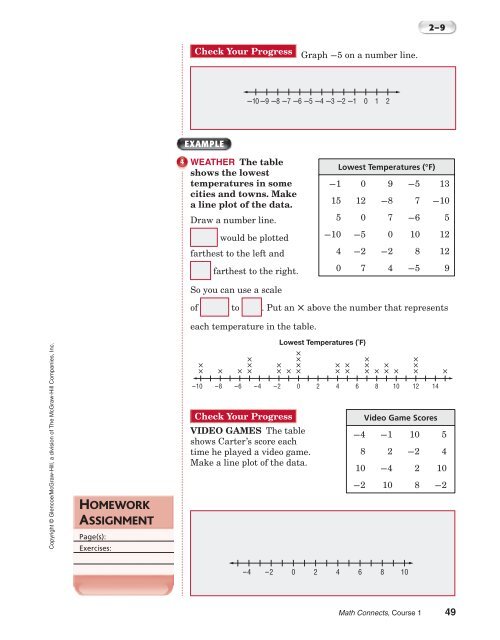
- Page 47 and 48: 2-5 Line PlotsEXAMPLE Display Data
- Page 49 and 50: 2-6 MeanMAIN IDEA• Find the mean
- Page 51 and 52: 2-7 Median, Mode, and RangeMAIN IDE
- Page 53 and 54: 2-7ORGANIZE ITUnder Lesson 2-7 in y
- Page 55: 2-8EXAMPLESSelect an appropriatetyp
- Page 59 and 60: Chapter 2 BRINGING IT ALL TOGETHER2
- Page 61 and 62: Chapter 2 BRINGING IT ALL TOGETHERW
- Page 63 and 64: C H A P T E R3Operations with Decim
- Page 65 and 66: 3-1Representing DecimalsMAIN IDEA
- Page 67 and 68: 3-2Comparing and Ordering DecimalsM
- Page 69 and 70: 3-3 Rounding DecimalsEXAMPLE Round
- Page 71 and 72: 3-4 Estimating Sums and Differences
- Page 73 and 74: 3-4Read the ItemThe addends are clu
- Page 75 and 76: 3-5WRITE ITExplain in your ownwords
- Page 77 and 78: 3-6 Multiplying Decimals by Whole N
- Page 79 and 80: 3-7Multiplying DecimalsEXAMPLES Mul
- Page 81 and 82: 3-8Dividing Decimals by Whole Numbe
- Page 84 and 85: 3-9EXAMPLES Zeros in the Quotient a
- Page 86 and 87: 3-10 Problem-Solving Investigation:
- Page 88 and 89: Chapter 3 BRINGING IT ALL TOGETHER3
- Page 90 and 91: Chapter 3 BRINGING IT ALL TOGETHER3
- Page 92 and 93: C H A P T E R3ChecklistARE YOU READ
- Page 94 and 95: C H A P T E R4BUILD YOUR VOCABULARY
- Page 96 and 97: 4-1A Plan for Problem SolvingMAIN I
- Page 98 and 99: 4-1EXAMPLESWRITE ITWhy is the great
- Page 100 and 101: 4-2BUILD YOUR VOCABULARY (pages 86-
- Page 102 and 103: 4-3 Mixed Numbers and Improper Frac
- Page 104 and 105: 4-4 Problem-Solving Investigation:M
- Page 106 and 107:
4-5EXAMPLE Find the LCMREVIEW ITWhy
- Page 108 and 109:
4-6ORGANIZE ITSummarize ways you ca
- Page 110 and 111:
4-7 Writing Decimals as FractionsMA
- Page 112 and 113:
4-8 Writing Fractions as DecimalsMA
- Page 114 and 115:
4-9Algebra: Ordered Pairs and Funct
- Page 116 and 117:
4-9EXAMPLESPETS Amelia feeds her do
- Page 118 and 119:
Chapter 4 BRINGING IT ALL TOGETHERM
- Page 120 and 121:
Chapter 4 BRINGING IT ALL TOGETHER4
- Page 122 and 123:
C H A P T E R5Operations with Fract
- Page 124 and 125:
5-1 Rounding Fractions and Mixed Nu
- Page 126 and 127:
5-2Problem-Solving Investigation: A
- Page 128 and 129:
5-3®ORGANIZE ITUse the note cards
- Page 130 and 131:
5-4Check Your Progresssimplest form
- Page 132 and 133:
5-5 Adding and Subtracting Mixed Nu
- Page 134 and 135:
5-5REMEMBER ITUse estimation tochec
- Page 136 and 137:
5-6REMEMBER ITPlacing fractions ona
- Page 138 and 139:
5-7EXAMPLE Simplify Before Multiply
- Page 140 and 141:
5-8Check Your Progress WEIGHT A bag
- Page 142 and 143:
5-9Find 5 ÷ 1 _6 .5 ÷ 1_6 = _ 5
- Page 144 and 145:
5-10EXAMPLEADVENTURE RACING A team
- Page 146 and 147:
Chapter 5 BRINGING IT ALL TOGETHER5
- Page 148 and 149:
Chapter 5 BRINGING IT ALL TOGETHER5
- Page 150 and 151:
C H A P T E R5ChecklistARE YOU READ
- Page 152 and 153:
C H A P T E R6BUILD YOUR VOCABULARY
- Page 154 and 155:
6-1 Ratios and RatesMAIN IDEA• Ex
- Page 156 and 157:
6-2 Ratio TablesMAIN IDEA• Use ra
- Page 158 and 159:
6-2BUILD YOUR VOCABULARY (pages 144
- Page 160 and 161:
6-3FOOD You can buy 3 medium pizzas
- Page 162 and 163:
6-4Algebra: Solving ProportionsEXAM
- Page 164 and 165:
6-4EXAMPLE Solve Using Unit RatesWA
- Page 166 and 167:
6-6 Sequences and ExpressionsMAIN I
- Page 168 and 169:
6-6EXAMPLETEST EXAMPLE The table sh
- Page 170 and 171:
6-7Write an equation to find the to
- Page 172 and 173:
C H A P T E R6BRINGING IT ALL TOGET
- Page 174 and 175:
Chapter 6 BRINGING IT ALL TOGETHER6
- Page 176 and 177:
C H A P T E R7Percent and Probabili
- Page 178 and 179:
Chapter 7 BUILD YOUR VOCABULARYVoca
- Page 180 and 181:
7-1Check Your Progress Write each p
- Page 182 and 183:
7-2Circle GraphsMAIN IDEA• Sketch
- Page 184 and 185:
7-2Which two methods of transportat
- Page 186 and 187:
7-3EXAMPLES Write a Decimal as a Pe
- Page 188 and 189:
7-4BUILD YOUR VOCABULARY (pages 169
- Page 190 and 191:
7-5Sample SpacesBUILD YOUR VOCABULA
- Page 192 and 193:
7-5BUILD YOUR VOCABULARY (pages 169
- Page 194 and 195:
7-6REVIEW ITUse mental math to solv
- Page 196 and 197:
7-8 Estimating with PercentsMAIN ID
- Page 198 and 199:
7-8EXAMPLETEST EXAMPLE Clairesurvey
- Page 200 and 201:
Chapter 7 BRINGING IT ALL TOGETHER7
- Page 202 and 203:
Chapter 7 BRINGING IT ALL TOGETHER7
- Page 204 and 205:
C H A P T E R8Systems of Measuremen
- Page 206 and 207:
Chapter 8 BUILD YOUR VOCABULARYVoca
- Page 208 and 209:
8-1Check Your Progress CRAYONS Meas
- Page 210 and 211:
8-2EXAMPLES Change Units of WeightE
- Page 212 and 213:
8-3REMEMBER ITOne centimeter isabou
- Page 214 and 215:
8-4Check Your Progress Write the me
- Page 216 and 217:
8-6 Changing Metric UnitsEXAMPLES C
- Page 218 and 219:
8-7Measures of TimeEXAMPLE Add Unit
- Page 221 and 222:
8-8EXAMPLES Give Reasonable Tempera
- Page 223 and 224:
Chapter 8 BRINGING IT ALL TOGETHER8
- Page 225 and 226:
C H A P T E R8ChecklistARE YOU READ
- Page 227 and 228:
C H A P T E R9BUILD YOUR VOCABULARY
- Page 229 and 230:
9-1 Measuring AnglesMAIN IDEA• Me
- Page 231 and 232:
203015030150170109-2Estimating and
- Page 233 and 234:
9-3Angle RelationshipsMAIN IDEA•
- Page 235 and 236:
9-4 TrianglesBUILD YOUR VOCABULARY
- Page 237 and 238:
9-4EXAMPLES Classify a Triangle by
- Page 239 and 240:
9-5BUILD YOUR VOCABULARY (pages 219
- Page 241 and 242:
9-7 Similar and Congruent FiguresMA
- Page 243 and 244:
9-7EXAMPLE Identify Similar Figures
- Page 245 and 246:
Chapter 9 BRINGING IT ALL TOGETHER9
- Page 247 and 248:
P T A E RH C9ChecklistARE YOU READY
- Page 249 and 250:
C H A P T E R10BUILD YOUR VOCABULAR
- Page 251 and 252:
10-1PerimeterMAIN IDEA• Find the
- Page 253 and 254:
10-2Circles and CircumferenceMAIN I
- Page 255 and 256:
10-2Check Your Progress Use a calcu
- Page 257 and 258:
10-3Check Your Progress Find the ar
- Page 259 and 260:
10-4®ORGANIZE ITWrite the formula
- Page 261 and 262:
10-6Volume of Rectangular PrismsMAI
- Page 263 and 264:
10-7Surface Area of Rectangular Pri
- Page 265 and 266:
C H A P T E R10BRINGING IT ALL TOGE
- Page 267 and 268:
Chapter 10 BRINGING IT ALL TOGETHER
- Page 269 and 270:
C H A P T E R11Integers and Transfo
- Page 271 and 272:
11-1 Ordering IntegersEXAMPLE Compa
- Page 273 and 274:
11-2Adding IntegersEXAMPLES Add Int
- Page 275 and 276:
11-2KEY CONCEPTAdding Integers The
- Page 277 and 278:
11-3WRITE ITThink about the numberl
- Page 279 and 280:
11-4Multiplying IntegersEXAMPLES Mu
- Page 281 and 282:
11-6Dividing IntegersEXAMPLES Divid
- Page 283 and 284:
11-6EXAMPLETEST EXAMPLE A scuba div
- Page 285 and 286:
11-7point SStep 1 Start at the orig
- Page 287 and 288:
11-8EXAMPLE Graph a TranslationTran
- Page 289 and 290:
11-9 ReflectionsMAIN IDEA• Graph
- Page 291 and 292:
11-10 RotationsMAIN IDEA• Graph r
- Page 293 and 294:
C H A P T E R11BRINGING IT ALL TOGE
- Page 295 and 296:
Chapter 11 BRINGING IT ALL TOGETHER
- Page 297 and 298:
Chapter 11 BRINGING IT ALL TOGETHER
- Page 299 and 300:
C H A P T E R12Algebra: Properties
- Page 301 and 302:
12-1The Distributive PropertyMAIN I
- Page 303 and 304:
12-2Simplifying Algebraic Expressio
- Page 305 and 306:
12-3Solving Addition EquationsMAIN
- Page 307 and 308:
12-1 12-3BUILD YOUR VOCABULARY (pag
- Page 309 and 310:
12-4BUILD YOUR VOCABULARY (page 292
- Page 311 and 312:
12-5EXAMPLE Solve a Multiplication
- Page 313 and 314:
C H A P T E R12BRINGING IT ALL TOGE
- Page 315 and 316:
Chapter 12 BRINGING IT ALL TOGETHER