

Holocene paleoceanography and glacial history of the West ...
Holocene paleoceanography and glacial history of the West ...
Holocene paleoceanography and glacial history of the West ...

Create successful ePaper yourself
Turn your PDF publications into a flip-book with our unique Google optimized e-Paper software.
ARTICLE IN PRESSQuaternary Science Reviews 23 (2004) 2075–2088<strong>Holocene</strong> <strong>paleoceanography</strong> <strong>and</strong><strong>glacial</strong> <strong>history</strong> <strong>of</strong> <strong>the</strong> <strong>West</strong>Spitsbergen area, Euro-Arctic marginMorten Hald a, , Hanne Ebbesen a , Matthias Forwick a , FredGodtliebsen b ,Liza Khomenko c , Sergei Korsun c , Lena RingstadOlsen b , Tore O. Vorren aa Department <strong>of</strong> Geology, University <strong>of</strong> Tromsoe, Tromsoe, Norwayb Department <strong>of</strong> Ma<strong>the</strong>matics <strong>and</strong> Statistics, University <strong>of</strong> Tromsoe, Norwayc Department <strong>of</strong> Biology, St. Petersburg University, RussiaAbstractTwo sediment cores from <strong>the</strong> <strong>West</strong> Spitsbergen area, Euro-Arctic margin, MD99-2304 <strong>and</strong> MD99-2305, have been investigatedfor paleoceanographic proxies, including benthic <strong>and</strong> planktonic foraminifera, benthic foraminiferal stable isotopes <strong>and</strong> ice rafteddebris. Core MD99-2304 is located on <strong>the</strong> upper continental margin, reflecting variations in <strong>the</strong> influx <strong>of</strong> Atlantic Water in <strong>the</strong> <strong>West</strong>Spitsbergen Current. Core MD99-2305 is located in Van Mijenfjord, picturing variations in tidewater glacier activity as well as fjordoceancirculation changes. Surface water warmer than today, was present on <strong>the</strong> margin as soon as <strong>the</strong> Van Mijenfjord wasdeglaciated by 11,200 cal. years BP. Relatively warm water invaded <strong>the</strong> fjord bottom almost immediately after <strong>the</strong> deglaciation. Arelatively warm early <strong>Holocene</strong> was followedby an abrupt cooling at 8800 cal. years BP on <strong>the</strong> continental margin. Ano<strong>the</strong>r coolingin <strong>the</strong> fjord record, 8000–4000 cal. years BP, is documented by an increase in ice rafted debris <strong>and</strong> an increase in benthicforaminiferal d 18 O: The IRD-record indicates that central Spitsbergen never was completely deglaciated during <strong>the</strong> <strong>Holocene</strong>.Relatively cool <strong>and</strong>stable conditions similar to <strong>the</strong> present were establishedabout 4000 cal. years BP.r 2004 Elsevier Ltd. All rights reserved.1. IntroductionThe <strong>West</strong> Spitsbergen continental margin is aclimatically sensitive area. The main reason for this is<strong>the</strong> present oceanographic regime characterizedbynorth-flowing warm Atlantic Water in <strong>the</strong> <strong>West</strong>Spitsbergen Current along <strong>the</strong> continental margin withsharp gradients to cool, partly sea-ice covered PolarWater (Fig. 1). Small geographical displacements in <strong>the</strong>ocean fronts in this area may impose large climaticchanges affecting <strong>the</strong> society, life habitats <strong>and</strong>earthprocesses in <strong>the</strong> area. Climate models predict that <strong>the</strong>global warming will have its largest impact in <strong>the</strong> highnor<strong>the</strong>rn latitudes (e.g. Hadley Centre (2004)). However,<strong>the</strong> instrumental record<strong>of</strong> climate variability is too short<strong>and</strong>spatially incomplete to reveal <strong>the</strong> full range <strong>of</strong> Corresponding author. Tel.: +47-776-44412; fax: +47-776-45600.E-mail address: morten.hald@ig.uit.no (M. Hald).seasonal to millennial-scale climate variability, or toprovide empirical examples <strong>of</strong> how <strong>the</strong> climate systemresponds to large changes in climate forcing. Longertime series may be provided with well dated <strong>and</strong> highresolution proxy records.We have investigatedtwo proxy records from <strong>the</strong><strong>West</strong> Spitsbergen area, one from <strong>the</strong> open ocean uppercontinental margin <strong>and</strong>one from a silledfjordsetting,Van Mijenfjord. The core from <strong>the</strong> continental margin islocatedunder <strong>the</strong> axis <strong>of</strong> Arctic Water. This core shouldreflect changes <strong>and</strong>variability in heat flux to <strong>the</strong> highnor<strong>the</strong>rn latitudes, representing <strong>the</strong> nor<strong>the</strong>rn limb <strong>of</strong> <strong>the</strong>North Atlantic conveyor circulation. The fjordrecordon <strong>the</strong> o<strong>the</strong>r h<strong>and</strong>represents more <strong>of</strong> a continentalclimate signal, linkedto processes such as iceberg raftingfrom tidewater glaciers <strong>and</strong> exchange between fjordwater <strong>and</strong>open oceanic water. Our knowledge <strong>of</strong> <strong>the</strong><strong>Holocene</strong> climatic record<strong>of</strong> <strong>the</strong> Svalbardarea is sparsedue to lack <strong>of</strong> high resolution <strong>and</strong> well-dated proxy0277-3791/$ - see front matter r 2004 Elsevier Ltd. All rights reserved.doi:10.1016/j.quascirev.2004.08.006
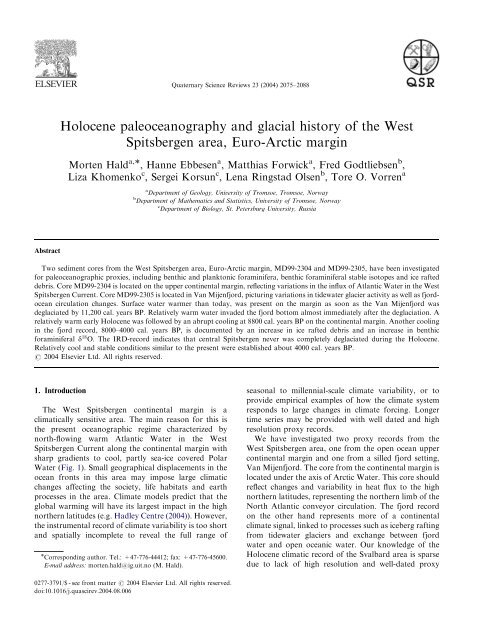
2076ARTICLE IN PRESSM. Hald et al. / Quaternary Science Reviews 23 (2004) 2075–20888° 12° 16° 20° 24° 28°2000100081°ARCTICOCEANKara SeaSiberiaYeniseyriver50020010080°80°SvalbardWSCBearIsl<strong>and</strong>BarentsSeaObriver379°60°Norwegian Sea70°NCSc<strong>and</strong>inaviaPOLAR WATERARCTIC WATERCOASTAL WATERATLANTIC WATERSEA-ICEBORDER, APRILWESTWSC SPITSBERGENCURRENTNCNORWEGIANCURRENTSURFACECURRENTSMD99-2304200050010002IsfjordMD99-23051100200Van Mijenfjorden78°77°(A)(B)Fig. 1. Location maps: (A) index map showing <strong>the</strong> surface water masses <strong>and</strong>surface currents in <strong>the</strong> Norwegian Sea <strong>and</strong>adjoining seas; (B) close up<strong>of</strong> Svalbard <strong>and</strong> surrounding continental margin. Location <strong>of</strong> <strong>the</strong> two investigated sediment cores MD99-2304 <strong>and</strong> MD99-2305 are shown.1=Akseløya; 2=Linnèvannet <strong>and</strong>3=Billefjorden.records. The purpose <strong>of</strong> <strong>the</strong> present paper is to (1)present well-dated paleoclimate data for <strong>the</strong> <strong>West</strong>Spitsbergen area during <strong>the</strong> <strong>Holocene</strong> <strong>and</strong> (2) investigatecentury to decadal scale climate changes <strong>and</strong> variability.2. Physical settingSpitsbergen is <strong>the</strong> largest isl<strong>and</strong><strong>of</strong> <strong>the</strong> Svalbardarchipelago, situatedbetween 761 <strong>and</strong>801N, <strong>and</strong>bordered by <strong>the</strong> Arctic Ocean to <strong>the</strong> north, <strong>the</strong> BarentsSea to <strong>the</strong> south <strong>and</strong>east, <strong>and</strong><strong>the</strong> Norwegian–Greenl<strong>and</strong>Seato <strong>the</strong> west (Fig. 1). The archipelago isdominated by Phanerozoic sedimentary rocks (Steel<strong>and</strong>Worsley, 1984).The continental margin west <strong>of</strong> Spitsbergen ischaracterizedby a relatively narrow shelf with a typical<strong>glacial</strong> morphology representedby shallow banksbetween <strong>glacial</strong> troughs, <strong>the</strong> latter foundin <strong>the</strong>continuation <strong>of</strong> <strong>the</strong> east-west trending fjords. Thecontinental slope has a relatively steep gradient <strong>of</strong>4–51. Quaternary sediments rest on Tertiary sediments,<strong>and</strong>have accumulatedin well-definedsubmarinetroughs on <strong>the</strong> shelf <strong>and</strong>in submarine fans on <strong>the</strong> slope(Andersen et al., 1996).Spitsbergen is cut by several fjords. Van Mijenfjord(Fig. 1) is <strong>the</strong> secondlargest <strong>of</strong> <strong>the</strong>se, 50 km long <strong>and</strong>ca10 km broad. It has restricted oceanic communicationdue to <strong>the</strong> isl<strong>and</strong> Akseløya in <strong>the</strong> outer part. The fjord isdivided into three basins. Maximum depth <strong>of</strong> <strong>the</strong> outerbasin is 112 m as compared to 74 m in <strong>the</strong> middle basin<strong>and</strong>ca 30 m in <strong>the</strong> inner basin. Most <strong>of</strong> <strong>the</strong> fjordislocated within Paleogene sedimentary bedrock <strong>of</strong>various types such as s<strong>and</strong>stones, siltstones, shales,coals <strong>and</strong>coals pebbles (Steel <strong>and</strong>Worsley, 1984).Early Cretaceous sedimentary rocks are found in <strong>the</strong>innermost part (Salvigsen <strong>and</strong>Winsnes, 1989). The innerpart <strong>of</strong> <strong>the</strong> fjord is dominated by sediments producedduring a surge AD 1300 (Punning et al., 1976; Rowan etal., 1982; Haldet al., 2001). The outer basin <strong>of</strong> <strong>the</strong> fjordis characterizedby a maximum <strong>of</strong> 25 milli-seconds (ms)<strong>of</strong> acoustically transparent sediments representing <strong>the</strong>
ARTICLE IN PRESSM. Hald et al. / Quaternary Science Reviews 23 (2004) 2075–2088 2077last deglaciation <strong>and</strong> <strong>the</strong> <strong>Holocene</strong> (Dahlgren, 1998).The sea-floor surface sediments are dominantly silty clay(Hald<strong>and</strong>Korsun, 1997).The catchments area <strong>of</strong> Van Mijenfjordis approximately2.8 10 3 km 2 , <strong>and</strong>50% <strong>of</strong> this area is coveredbyglaciers (Hagen et al., 1993). A tidewater glacier(Fridtj<strong>of</strong>breen) is located in <strong>the</strong> nor<strong>the</strong>rn outermostparts <strong>of</strong> Van Mijenfjord. The fjord head is occupied by<strong>the</strong> large tidewater glacier system <strong>of</strong> Paulabreen (PGS),<strong>of</strong> which two glaciers (<strong>the</strong> Paulabreen <strong>and</strong>Bakininbreen)are <strong>the</strong> only glaciers that today calve into VanMijenfjord. Several tributary glaciers feed <strong>the</strong> mainglaciers <strong>of</strong> <strong>the</strong> PGS. All <strong>the</strong> glaciers in <strong>the</strong> area haveexperienceda significant loss <strong>of</strong> volume during <strong>the</strong> last100 years (Hagen et al., 1993). The climate <strong>of</strong> <strong>the</strong> VanMijenfjordis cold<strong>and</strong>dry. Annual temperature <strong>of</strong> <strong>the</strong>west coast <strong>of</strong> Spitsbergen is 6 1C <strong>and</strong>mean annualprecipitation varies between 180 <strong>and</strong>440 mm (Hanssen-Bauer et al., 1990). The equilibrium line altitudes <strong>of</strong> <strong>the</strong>glaciers vary from 200 m above sea level along <strong>the</strong> coastto 4600 m in <strong>the</strong> central-eastern parts <strong>of</strong> Spitsbergen(Hagen et al., 1993).2.1. OceanographyThe Spitsbergen margin <strong>and</strong>fjords are influencedbyrelatively warm Atlantic Water transportedfrom southwith <strong>the</strong> <strong>West</strong> Spitsbergen Current <strong>and</strong>coldPolar Waterfrom north (Fig. 1). The sea-ice conditions varyseasonally (Dowdeswell <strong>and</strong> Dowdeswell, 1989). Acover <strong>of</strong> l<strong>and</strong>-fast ice forms in <strong>the</strong> major fjord systems<strong>and</strong>in o<strong>the</strong>r shelteredcoastal areas by about lateNovember <strong>and</strong>is usually retaineduntil late May or June(Wadhams, 1981). Arctic pack ice is usually presentaroundnor<strong>the</strong>rn Spitsbergen throughout <strong>the</strong> year, with<strong>the</strong> lowest flow densities in August <strong>and</strong> September(Vinje, 1985). Between November <strong>and</strong>April <strong>the</strong> pack icemay surround<strong>the</strong> entire Svalbardarchipelago, withminimum densities on <strong>the</strong> west coast <strong>of</strong> Spitsbergen. Theasymmetric distribution <strong>of</strong> polar pack ice results fromoceanic circulation in which polar waters transport packice southwardon <strong>the</strong> eastern side <strong>of</strong> Svalbard<strong>and</strong><strong>the</strong><strong>West</strong> Spitsbergen Current brings warm Atlantic Waternorthwardto <strong>the</strong> western coast <strong>of</strong> Svalbard(Wadhams,1981; Vinje, 1985) (Fig. 1).The mouth <strong>of</strong> Van Mijenfjordis almost closedfrom<strong>the</strong> open ocean by <strong>the</strong> isl<strong>and</strong>Akseløya <strong>and</strong>thus allowsonly for a very modest inflow <strong>of</strong> Atlantic Water. Thewater column is dominated by cold local water, withbottom water temperatures <strong>of</strong> around 1 1C <strong>and</strong>aseasonally warmedsurface layer (cf. Haldet al., 2001).Gulliksen et al. (1985) reporteda minimum July bottomwatertemperature <strong>of</strong> 1.5 1C. Bottom water salinity isaround34 PSU in <strong>the</strong> two outer basins <strong>and</strong>a pycnoclineis observedin <strong>the</strong> upper 10–15 m. Tidewater rangesare o1m.3. Material <strong>and</strong> methodsWe investigatedtwo sediment cores, core MD99-2304is locatedon <strong>the</strong> upper <strong>West</strong> Spitsbergen continentalmargin 771 37. 26 0 N <strong>and</strong>091 56. 90 0 E, at 1315 m waterdepth, <strong>and</strong> core MD99-2305 located in Van Mijenfjord771 46.87 0 N <strong>and</strong>151 17.81 0 E at 110 m water depth. Thesampling sites were determined by several high resolutionseismic surveys during <strong>the</strong> 1990s using 3.5 kHzpenetration echo sounder <strong>and</strong> Sparker. Both cores weresampledduring <strong>the</strong> IMAGES-1999 cruise with ‘‘R/VMarion Dufresne’’ using a modified piston coringsystem, a ‘‘Calypso-corer’’, especially designed tosample long cores. Multi sensor track (MST) loggingwas appliedto <strong>the</strong> sealedcore MD99-2305. The sealedcores, with an inner diameter <strong>of</strong> 10 cm, were opened bysplitting <strong>the</strong>m longitudinally in two equal parts. Onehalf was studied with regard to various geotechnical <strong>and</strong>sedimentological analyses including MST logging (onlyMD99-2304), X-radiography, <strong>and</strong> colour determinationby using <strong>the</strong> Munsell Colour Charts. The whole length<strong>of</strong> MD99-2305, 18 m, was analysed. MD99-2304 is 23 mlong, but only <strong>the</strong> upper 1.5 m were usedin <strong>the</strong> presentstudy. In core MD99-2305 ice rafted debris (IRD)41 mm was countedfrom X-radiographs.Preparation <strong>of</strong> <strong>the</strong> foraminiferal samples mainlyfollowed<strong>the</strong> methods <strong>of</strong> Feyling-Hanssen (1958) <strong>and</strong>Meldgaard <strong>and</strong> Knudsen (1979). Between 300 <strong>and</strong>400individuals <strong>of</strong> benthic <strong>and</strong>/or planktonic foraminiferawere identified from <strong>the</strong> 4100 mm fraction using abinocular microscope. The planktonic foraminiferalcensus data were used to reconstruct sea surface summertemperatures (SST) in core MD99-2304. Three differentreconstructions were performed. One reconstructionrepresents quantitative estimations <strong>of</strong> SST basedon<strong>the</strong> Modern Analogue Technique in <strong>the</strong> data analysisprogram C2 version 1.3 (Juggins, 2002). The moderndata set used in <strong>the</strong> estimations is from ATL 947core-top database <strong>of</strong> modern planktonic foraminiferain <strong>the</strong> 150 mm fraction (Pflaumann et al., 2003).The general deviation <strong>of</strong> SST is about 0.3–1.3 1C.The two o<strong>the</strong>r SST reconstructions were basedlinear regression using smaller modern data setsfrom <strong>the</strong> Nordic Seas <strong>of</strong> respectively 125 mm fraction(Johannessen et al., 1994) <strong>and</strong>100 mm fractions (Burhol,1994).d 18 O measurements were carriedout at <strong>the</strong> NorwegianGMS laboratory at <strong>the</strong> University <strong>of</strong> Bergen, usingFiningan MAT 251 mass spectrometer. The reproducibilityat this laboratory is 0.07% for d 18 O: The sampleswere prepared following <strong>the</strong> procedures described byShackleton <strong>and</strong>Opdyke (1973), Shackleton et al. (1983)<strong>and</strong> Duplessy (1978). In MD99-2305, d 18 O was analysedon <strong>the</strong> benthic foraminifer Cassidulina reniforme, aninfaunal species that appears to precipitate its shell indisequilibrium with an <strong>of</strong>fset <strong>of</strong> 0.13% d 18 O(Austin <strong>and</strong>
2078ARTICLE IN PRESSM. Hald et al. / Quaternary Science Reviews 23 (2004) 2075–2088Kroon, 1996). The plotted d 18 O are correctedfor <strong>the</strong>global ice volume effect (Fairbanks, 1989).Accelerator Mass Spectrometry (AMS) radiocarbondates (Table 1) were performedon bivalve tests (MD99-2305) <strong>and</strong>foraminifera (MD99-2304) in Trondheim,Norway <strong>and</strong>Uppsala, Sweden (TUa), Arizona, US(AA) <strong>and</strong>Kiel, Germany (KIA). For <strong>the</strong> TUa-dates, <strong>the</strong>targets were preparedat Radiocarbon Laboratory inTrondheim, Norway <strong>and</strong> were measured at <strong>the</strong> SvedbergLaboratory in Uppsala, Sweden.In order to check <strong>the</strong> statistical reliability <strong>and</strong> trends<strong>of</strong> proxy data variations <strong>and</strong> to identify a lower limit <strong>of</strong>reliable time resolution we applied<strong>the</strong> SiZer methodologydeveloped by Chaudhuri <strong>and</strong> Marron (1999). Thismethodwas appliedonly on <strong>the</strong> most high resolutiondata sets in MD99-2305 (i.e. IRD, foraminiferal flux <strong>and</strong>% Elphidium. excavatum f. clavatum) (Fig. 3). The SiZermethodology has not been applied on <strong>the</strong> lowerresolution data sets in MD99-2304 <strong>and</strong> <strong>the</strong> d 18 O <strong>and</strong>d 13 C data in MD99-2305. For <strong>the</strong>se proxy sets we willonly discuss millennial scale changes. The SiZer methodis explainedin <strong>the</strong> following.A realistic statistical model for this situation is given byy i ¼ mðx i Þþ i ; 1 ¼ 1; ...; n; (1)where m(x) is <strong>the</strong> underlying smooth target curve, hererepresenting <strong>the</strong> ‘‘mean behaviour’’ <strong>of</strong> <strong>the</strong> proxy data attime x. The i are independent Gaussian variables withmean 0 <strong>and</strong>variance s 2 i ; <strong>and</strong> y i represents <strong>the</strong> observedproxy value in data point number i.In smoothing approaches, one frequently uses a locallinear kernel estimator; see Fan (1991), to produce agoodestimate <strong>of</strong> m from <strong>the</strong> observations y 1 ,y,y n .Tobe specific, this means that, at time x, ^m h ðxÞ equals <strong>the</strong> fit^a 0 where ^a 0 ; ^a 1 minimizesX ni¼1ðy i a 0 a 1 ðx i xÞÞ 2 K h ðx i xÞ: (2)Table 1Radiocarbon ages for MD99-2304 <strong>and</strong> MD992305, showing <strong>the</strong> core location, depth in core (cm), reference to <strong>the</strong> dating laboratory, Radiocarbondating laboratory <strong>of</strong> Trondheim <strong>and</strong> <strong>the</strong> T<strong>and</strong>em Accelerator Laboratory in Uppsala (Tua); Kiel Germany (KIA) <strong>and</strong> Arizona, US (AA)Core Core depth, Lab ref Material 14C age 1-sigma Cal.age 2-sigma RangesMD99-2305 8–9 Tua-4168 Nucula tenuis 345 750 410 468 294MD99-2305 100–101 TUa-3249 N. tenuis 1115 755 1056 1176 944MD99-2305 156–157 Tua-4169 Acanthocardia echinata 1300 745 1260 1325 1167MD99-2305 212–213 Tua-4170 Thyasira sp. 1930 745 1937 2050 1838MD99-2305 408–409 TUa-4171 Yoildia sp. 3940 7105 4443 4788 4209MD99-2305 540–541 TUa-3250 N. tenuis 5400 755 6208 6316 6316MD99-2305 625–626B Tua-4173 Thyasira equalis 6475 7105 7403 7563 7211MD99-2305 625–626A Tua-4172 Nuculana minuta 6610 765 7497 7604 7404MD99-2305 786–787 Tua-4174 Yoldiella lenticula 7780 755 8637 8866 8519MD99-2305 853–854 Tua-4175 Y. lenticula 8040 765 8929 9059 8784MD99-2305 926–927 Tua-4176 Y. lenticula 8430 765 9189 9648 9042MD99-2305 1106–1107 Tua-4177 N. tenuis 8850 755 9839 10,278 977MD99-2305 1132–1135 Tua-3144 Yoldia hyperborea 8670 765 9788 9950 9417MD99-2305 1135–1136 TUa-3251 N. tenuis 8910 765 9929 10,292 9790MD99-2305 1389–1390 TUa-3252 Y. hyperborea 9350 765 10,497 10,808 10,248MD99-2305 1390–1391 TUa-3253 N. tenuis 9375 770 10,564 10,816 10,274MD99-2305 1479–1481 TUa-3254 Y. hyperborea 9470 785 10,617 10,853 10,312MD99-2305 1480–1481 TUa-3255 N. tenuis 9535 780 10,801 10,864 10,333MD99-2305 1535–1536 TUa-3256 N. tenuis 9615 775 10,990 10,880 10,354MD99-2305 1569–1570 TUa-3257 N. tenuis 9765 775 11,118 11,348 10,791MD99-2305 1580 TUa-4319 N. tenuis 9835 745 11,141 11,357 10,834MD99-2305 1595–1596 TUa-4318 N. tenuis 9920 745 11,171 11,639 11,074MD99-2305 1763–1767 TUa-3258 2 bivalve fragments 45,285 +31402250MD99-2304 2,5 Tua-4421 Plan+bent. forams 580 730 560 627 494MD99-2304 28,5 TUa-3911 Planktonic forams 7855 755 8730 8905 8555MD99-2304 38,5 TUa-3912 Planktonic forams 8105* 760 8942* 9080 8804MD99-2304 56,5 TUa-3913 Planktonic forams 8010 765 8855 9023 8688MD99-2304 80 AA 36609 Shell fragments 8965 785 10,044 10,303 9784MD99-2304 130 KIA9346 Shell fragments 9670 755 11,404 11,725 11,082MD99-2304 156,8 KIA9526 Shell fragments 10,030 750 10,607 10,866 10,349MD99-2304 186 AA 36610 Shell fragments 12,170 7180 13,945 14,386 13,503MD99-2304 215 KIA9863 Benthic forams 12,660 770 14,835 15,473 14,197Asterisk denotes age excluded from <strong>the</strong> age model. The 14 C dates were calibrated (cal. ages) using <strong>the</strong> INTCAL-98 calibration data set (Stuiver et al.,1998).
ARTICLE IN PRESSM. Hald et al. / Quaternary Science Reviews 23 (2004) 2075–2088 2079In Eq. (2), K h ( )=(1/h) K( /h), where K is a kernelfunction symmetric aroundzero. Typically, we haveKðxÞ ¼1 x 2 pffiffiffiffiffiexp : (3)2p 2The degree <strong>of</strong> smoothness in <strong>the</strong> estimate ^m h iscontrolledthrough <strong>the</strong> b<strong>and</strong>width h. Note that whereastraditional smoothing methods seek an ‘‘optimal’’ value<strong>of</strong> h, SiZer exploits ‘‘all’’ values <strong>of</strong> h to findsignificantfeatures. This is crucial in climatological applicationssince important features typically change as a function<strong>of</strong> scale. Hence, <strong>the</strong> whole scale-space is needed in orderto findall significant features in a data set. By <strong>the</strong> SiZerapproach one also avoids <strong>the</strong> bias difficulty that appearsin traditional smoothing. This is caused by <strong>the</strong> fact that^m h is an unbiasedestimator <strong>of</strong> <strong>the</strong> true curve at <strong>the</strong>resolution corresponding to h.MD99-2304CoredepthStratigraphy(C yr)Datings14(cm)1020±308295±558545±608450±65100 8965±859670±5510030±5020012170±18012660±70300MD99-2305Coredepth(cm) Stratigraphy100200300400500600700Datings14(C yr)1115±551300±453940±1055400±556475±1056610±654. ChronologyThe chronology <strong>of</strong> MD99-2305 is basedon 21 AMSradiocarbon dates performed on mollusc bivalves (Table1). Most <strong>of</strong> <strong>the</strong>se bivalves were identified to species level.All <strong>the</strong> dates were corrected for a reservoir effect <strong>of</strong> 464years (including a DR value <strong>of</strong> 64 +/ 35 years)(Mangerud<strong>and</strong>Gulliksen, 1975) <strong>and</strong>show increasingages versus depth in core (Fig. 2). An age model wasproduced by converting <strong>the</strong> dates to calendar yearsfollowing <strong>the</strong> calibration model <strong>of</strong> Stuiver et al. (1998)(Fig. 4F). Sedimentation rates (mm/cal. years) werecalculatedby applying a fourth order polynomial fitthrough <strong>the</strong> dates. The age model implies that sedimentationrates vary from 66 cm/1000 cal. year to 4500 cm/1000 cal. years. The highest rates occurredduring <strong>the</strong>early <strong>Holocene</strong>, <strong>the</strong> lowest during mid-<strong>Holocene</strong> <strong>and</strong><strong>the</strong>n a slight increase <strong>the</strong> last 1700 years. Thesedimentation rates in <strong>the</strong> core allow a high stratigraphicresolution in <strong>the</strong> various proxies. Averageresolution for <strong>the</strong> IRD counts is 6.8 years; foraminiferalcounts 42 years <strong>and</strong>stable isotope analyses 175 years.The age model for MD99-2304 is based on 8 out <strong>of</strong> 9AMS dates performed on mixed benthic/planktonicforaminifera; planktonic foraminifera only, or unidentifiedfragments<strong>of</strong> bivalve shells (Fig. 5H,F, Table 1).One date, TUa 3912 (8105 +/ 60 yrs BP) appears tooold<strong>and</strong>was excludedfrom <strong>the</strong> age model. This may bedue to reworking. However, based on <strong>the</strong> low relief <strong>of</strong><strong>the</strong> core location (Labeyrie et al., 2003), <strong>the</strong> finesediment texture, <strong>and</strong> lack <strong>of</strong> structures indicatingsediment disturbances we assume reworking <strong>of</strong> foraminiferagenerally to be low. A reservoir age <strong>of</strong> 464 yearswas appliedalso for <strong>the</strong>se dates, although we are awarethat <strong>the</strong> reservoir age may be higher for <strong>the</strong> benthicforaminifera at sea bottom (1315 m), comparedto <strong>the</strong>planktonic foraminifera reflecting <strong>the</strong> upper water1800LEGEND:PebblesMacr<strong>of</strong>ossils45285+31402250MudS<strong>and</strong>y peliteDiamictonmasses. The reservoir age may also have variedthroughtime (Waelbroeck et al., 2001). However, at present<strong>the</strong>re is no data from <strong>the</strong> study area to confirm this. Thedates were calibrated to calendar years (Stuiver et al.,1998) <strong>and</strong>sedimentation rates were calculatedby linearinterpolation between <strong>the</strong> dated levels. The results revealrelatively high sedimentation during early <strong>Holocene</strong> (40to 4200 cm/1000 cal. years) dropping abruptly around8800 cal. years BP to 3.2 cm/1000 cal. years for <strong>the</strong>800900100011001200130014001500160017007780±558040±658430±658850±558670±658910±659350±659375±709470±859535±809615±759765±759835±459920±45Fig. 2. Lithostratigraphy <strong>and</strong> radiocarbon dates in Core MD99-2304on <strong>the</strong> continental margin (left) <strong>and</strong>MD99-2305 in Van Mijenfjord(right), <strong>West</strong> Spitsbergen. The legendat bottom right applies to bothrecords.
2080ARTICLE IN PRESSM. Hald et al. / Quaternary Science Reviews 23 (2004) 2075–2088remaining part <strong>of</strong> <strong>the</strong> <strong>Holocene</strong>. Due to low carbonatecontent it was only possible to retrieve one date from <strong>the</strong>uppermost part <strong>of</strong> <strong>the</strong> <strong>Holocene</strong>. Stratigraphical analyseswere performedon sediment samples from each cmin <strong>the</strong> core. This implies a mean time resolution <strong>of</strong> 27years prior to 8800 cal. years BP <strong>and</strong>314 years after thisdate.5. Results5.1. The SiZer analysisThe results <strong>of</strong> <strong>the</strong> SiZer analysis for core MD99-2305are shown in Fig. 3. In <strong>the</strong> top panels <strong>of</strong> Fig. 3 A–C, afamily <strong>of</strong> smoo<strong>the</strong>s (h) is given. The curves plottedhavesmooth ranges as given in <strong>the</strong> figure. The thick solidlinecorresponds to a choice <strong>of</strong> h one typically woulduse ifonly one scale was to be used. This ‘‘optimal’’ h is a datadriven b<strong>and</strong>width <strong>and</strong> a best choice <strong>of</strong> <strong>the</strong> b<strong>and</strong>widthfrom a purely ma<strong>the</strong>matical point <strong>of</strong> view (Ruppert etal., 1995). In <strong>the</strong> lower panels <strong>of</strong> Fig. 3A–C, SiZer plotsare given. The plot shows a feature map as a function <strong>of</strong>scale (controlledby h) <strong>and</strong>location (given by x) for <strong>the</strong>signal. For each (x,h) position, SiZer tests whe<strong>the</strong>r,a 1 a0; i.e. whe<strong>the</strong>r <strong>the</strong> curve at this level <strong>of</strong> resolutionhas a derivative different from zero which means that<strong>the</strong>re is a true increase or decrease <strong>of</strong> <strong>the</strong> curve. Readersinterestedin more details about this are referredtoChaudhuri <strong>and</strong> Marron (1999).A significantly positive derivative in <strong>the</strong> SiZer map isflaggedas black, while a significantly negative derivativeis flaggedas light grey. This means that black showsareas where <strong>the</strong>re is a significant increase, while lightgrey shows where <strong>the</strong>re is a significant decrease. Atlocations where <strong>the</strong> derivative is not found to besignificantly different from zero, <strong>the</strong> colour grey is used.Hence grey means that <strong>the</strong>re is no significant change.The horizontal black line (around h=100) correspondsto <strong>the</strong> smoothing obtainedby <strong>the</strong> solidblack line in <strong>the</strong>upper panel <strong>of</strong> Fig. 3A. Dark grey is usedto indicatethat too few data points are available to do inference.Typically, dark grey colour occurs at very small scalesfor SiZer. It shouldbe notedthat when <strong>the</strong> SiZer mapshow an, e.g. positive derivative <strong>of</strong> <strong>the</strong> curves, thiscorresponds to a rise in <strong>the</strong> actual proxy value, <strong>and</strong> viceversa for negative derivatives. In <strong>the</strong> following wedescribe from too (modern) to bottom (Younger Dryas)<strong>and</strong>explain <strong>the</strong> variability <strong>and</strong>trends in <strong>the</strong> curves asshown by <strong>the</strong> SiZer map.The results show that for <strong>the</strong> IRD variations <strong>the</strong>‘‘optimal’’ h is 109 years (Fig. 3A). Following <strong>the</strong>horizontal line for this h, <strong>the</strong>re was a markeddecreasefollowedby an increase between 800 <strong>and</strong>1000 years ago.Fur<strong>the</strong>r a markedincrease is shown around3000 cal.years BP <strong>and</strong>a significant increase/decrease about7500 cal. years BP. Finally <strong>the</strong> large amount <strong>of</strong> IRD in<strong>the</strong> older part <strong>of</strong> <strong>the</strong> record is depicted by two markedincreases older than 10,000 cal. years BP.For <strong>the</strong> foraminiferal flux <strong>the</strong> ‘‘optimal’’ time horizonis 311 years (Fig. 3B). It shows a short decrease about2000 cal. years BP <strong>and</strong>an increase between 3500 <strong>and</strong>4000 cal. years BP. In addition, significant decreases aredepicted at ca 7000 cal. years BP <strong>and</strong> 8500 cal. years BP.A reduction in foraminiferal flux is evidenced for <strong>the</strong>lowermost part <strong>of</strong> <strong>the</strong> stratigraphy, older that 10,500 cal. years BP.The ‘‘optimal’’ h for % E. excavatum is 161 years (Fig.3C). At this scale <strong>the</strong> only significant changes areincreases at about <strong>and</strong>11,000, 10,200 <strong>and</strong>8500 cal. yearsBP. For <strong>the</strong> periodfrom 8400 to 6200 cal. years BP <strong>the</strong>reare too few data to do any analysis. Both foraminiferalflux <strong>and</strong> E. excavatum have too few observations to giveany information on variability on time scales less than100 years throughout most <strong>of</strong> <strong>the</strong> <strong>Holocene</strong> (Figs. 3B<strong>and</strong>C).5.2. Proxy data variations in MD99-2305The lithology <strong>of</strong> MD99-2305 is characterizedby twounits (Fig. 2). The lower 2 m <strong>of</strong> <strong>the</strong> core comprise amassive <strong>and</strong>firm diamicton with a high content <strong>of</strong> clasts<strong>and</strong>a low content <strong>of</strong> fossils. One AMS date performedon shell fragments from this unit gave a close to infiniteage <strong>of</strong> 45385 +/ 3140/2250 14 C years (Table 1),assumedto result from reworking. The diamicton has asharp boundary to <strong>the</strong> upper unit characterized by a s<strong>of</strong>tmudwith scatteredclasts. The acoustic data show thatboth units are widespread in <strong>the</strong> fjord; Dahlgren (1998)<strong>and</strong> Haldet al. (2001). We interpret <strong>the</strong> diamicton torepresent a basal till <strong>and</strong><strong>the</strong> upper unit to result fromglaciomarine fjord sedimentation. The boundary between<strong>the</strong> two units is dated to 11,170 cal. years BP. Weconsider this to be a minimum age for <strong>the</strong> deglaciation<strong>of</strong> Van Mijenfjord.The proxy data for IRD, foraminiferal flux <strong>and</strong> E.excavatum are representedby <strong>the</strong> ‘‘optimal’’ curve asgiven in Fig. 3. The early deglaciation <strong>of</strong> Van Mijenfjordaround11,200 cal. years BP is characterizedby high icebergrafting decreasing rapidly reaching relatively lowvalues from ca 10,000 cal. years BP (Fig. 4E). A peak inIRD occurredaround7500 cal. years BP, followedbyhigh flux values between 7000 <strong>and</strong>4000 cal. years BP.As IRD declined <strong>the</strong>re was a rise in <strong>the</strong> flux <strong>of</strong>foraminifera showing relatively high values during early<strong>Holocene</strong> (11,000–7000 cal. years BP). The same timeinterval was characterizedby a high abundance <strong>of</strong>bivalve shells. The benthic foraminiferal species E.excavatum shows peak values during <strong>the</strong> earliest part<strong>of</strong> <strong>the</strong> deglaciation, followed by a marked decline untilca 8600 cal. years BP. There was a markedrise <strong>of</strong> thisspecies after 7000 cal. years BP, reaching peak values
ARTICLE IN PRESSM. Hald et al. / Quaternary Science Reviews 23 (2004) 2075–2088 20811000IRD flux # grains > 1 mm/cm 2 /ka100No.10h (years)500020001000500200100(A)2 4 6 8 10kcal. years BP4030Foraminiferal flux (no/cm 2 /years)No.20100h (years)10000500020001000500200100(B)2 4 6 8 10kcal. years BP6050No.40302010100005000% Elphidium excavatumh (years)20001000500200100(C)2 4 6 8 10kcal. years BPLEGEND:SignificantlydecreasingNo significantchangeToo few observationsto do inferenceSignificantlyincreasingFig. 3. SiZer analysis <strong>of</strong> proxy data from core MD99-2305, Van Mijenfjord, <strong>West</strong> Spitsbergen (A) IRD grains 41 mm (B) Foraminiferal flux <strong>and</strong>(C)% E. excavatum. In <strong>the</strong> top panel <strong>of</strong> each figure a family <strong>of</strong> smoo<strong>the</strong>s (h-values) is given. The dots shows all data, <strong>the</strong> thick line shows <strong>the</strong> ‘‘optimal’’smooth (cf. discussion in text) <strong>and</strong><strong>the</strong> thin lines show various smooth values, with maximum <strong>and</strong>minimum values given. In <strong>the</strong> lower panel a SiZerplot is shown depicting at which time <strong>the</strong> proxy show a significant increase, decrease, no change or where <strong>the</strong>re are too few observations.
2082ARTICLE IN PRESSM. Hald et al. / Quaternary Science Reviews 23 (2004) 2075–20880% E.excavatum0 10 20Foram flux (#/cm2/kyr)0 10 2030 40 50 5 15δ 13 C C. reniforme-0.4 -0.8 -1.2 -1.6IRDflux# grains >1mm/cm 2 ka1 10 100(A) (B) (C) (D) (E) (F)1000200030004000Cal. years BP500060007000800090001000011000120004.5 4 3.5δ 18 OC. renif.0 400 800 1200 1600depth in core (cm)Fig. 4. Proxy record for sediment core MD99-2305, Van Mijenfjord, <strong>West</strong> Spitsbergen: (A) % E. excavatum smoo<strong>the</strong>dat value h=161 years; (B)foraminiferal flux, smoo<strong>the</strong>dby h=311 years; (C) d 13 C measuredon <strong>the</strong> benthic foraminifer C. reniforme; (D) d 18 O measuredon <strong>the</strong> benthicforaminifer C. reniforme; (E) ice rafteddebris (IRD) smoo<strong>the</strong>dat h=109 years; (F) age (cal. years BP) vs. cm depth in core plotted as a fourthpolynomial fit through <strong>the</strong> dated levels in <strong>the</strong> core. Cf. discussion in text <strong>of</strong> smoothing technique in (A), (B) <strong>and</strong> (E).around2800 cal. years BP. E. excavatum shows aincreasing trend(Fig. 4A) <strong>and</strong>foraminiferal flux (Fig.4B) a decreasing trend throughout <strong>the</strong> <strong>Holocene</strong>. Thed 13 C(Fig. 4C) <strong>and</strong> d 18 O(Fig. 4D), measuredon <strong>the</strong>benthic foraminifer C. reniforme, show a parallel trendthroughout most <strong>of</strong> <strong>the</strong> <strong>Holocene</strong>. Both show a markeddepletion during <strong>the</strong> earliest part <strong>of</strong> <strong>the</strong> deglaciationleading to peak low values between 10,500 <strong>and</strong> 8300 cal.years BP. Maximum values occurredbetween ca 8000<strong>and</strong>4000 cal. years BP followedby a slight depletionduring <strong>the</strong> last 3000 years.5.3. Proxy data variations in MD99-2304The lithology <strong>of</strong> <strong>the</strong> upper 150 cm <strong>of</strong> MD99-2304 ischaracterizedby a brownish-grey homogenous mudwith scatteredclasts. The planktonic foraminifera aredominated by <strong>the</strong> polar species Neogloboquadrinapachyderma (sinistral) (Fig. 5A), followedby <strong>the</strong>subpolar species Globigerina quinqueloba (Fig. 5B). Inaddition, <strong>the</strong> following subpolar species are recorded: N.pachyderma (dextral) (Fig. 5C), Globigerinita glutinata(not shown), G. bulloides (Fig. 5D), G. scitula <strong>and</strong>G. uvula (not shown). The SST reconstruction showshighly varying temperatures during earliest <strong>Holocene</strong>until ca 10,800 cal. years BP, followedby stable,relatively warm temperatures until a rapidcooling <strong>of</strong>ca 4 1C around8800 cal. years BP. This cooling step isbracketedby two AMS dates (Table 1, Fig. 5F). Theremaining part <strong>of</strong> <strong>the</strong> <strong>Holocene</strong> appears to be characterizedbystable, cool sea surface temperatures.However, possible short-livedchanges may be obscuredby <strong>the</strong> low stratigraphic resolution for this part <strong>of</strong> <strong>the</strong>core. Reconstruction <strong>of</strong> SST for <strong>the</strong> core-top sample (ca4 1C) is in agreement with instrumental observations <strong>of</strong>summer temperatures in <strong>the</strong> area.6. Paleoceanographic implications6.1. The proxy indicatorsPlanktonic foraminifera are reliable tracers <strong>of</strong> surface<strong>and</strong>sub-surface ocean temperatures (e.g. Be´ <strong>and</strong>Tolderlund, 1971) <strong>and</strong>quantitative reconstructions <strong>of</strong>SST basedon various statistical approaches have been
ARTICLE IN PRESSM. Hald et al. / Quaternary Science Reviews 23 (2004) 2075–2088 2083% N.pachyderma (s) % G. quinq % N.pachyderma (d) %G. bulloides SST-1(°C) SST-2 (°C) SST-3 (°C) cm in core0 50 100 0 50 100 0 10 20 30 0 1 2 3 4 3 4 5 6 7 8 9 3 4 5 6 7 8 9 3 4 5 6 7 8 9 0 40 80 120 16001000(A) (B) (C) (D) (E) (F) (G) (H)200030004000Age (cal. years BP)50006000700080009000100001100012000Fig. 5. Proxy recordfor sediment core MD99-2304, western Svalbardcontinental margin. (A–D) Percent frequencies for <strong>the</strong> most importantplanktonic foraminiferal species. (E) Sea surface temperature SST-1 reconstructed by <strong>the</strong> modern analogue technique, using <strong>the</strong> modern database <strong>of</strong>Pflaumann et al. (2003). (F) Sea surface temperature (SST-2) reconstructed by linear regression applying a modern data set from Johannesen et al.(1994). (G) Sea surface temperature (SST-2) reconstructed by linear regression applying a modern data set from Burhol (1994). (H) Age (cal. yearsBP) vs. cm depth in core plotted by linear interpolation between <strong>the</strong> dated levels in <strong>the</strong> core.applied over <strong>the</strong> last three decades. In <strong>the</strong> present study<strong>the</strong> planktonic foraminiferal fauna was countedin <strong>the</strong>100 mm fraction, were as <strong>the</strong> modern data set <strong>of</strong>Pflaumann et al. (1996, 2003) usedfor <strong>the</strong> SST-1reconstruction (Fig. 5E) represents <strong>the</strong> 150 mm fraction.This adds an uncertainty to <strong>the</strong> reconstruction, since one<strong>of</strong> <strong>the</strong> subpolar species, G. quinqueloba, frequently issmaller than 150 mm (Carstens <strong>and</strong>Wefer, 1992). Thus,this species may be overrepresentedin <strong>the</strong> proxy recordcompared to <strong>the</strong> modern data set <strong>and</strong> lead to too highreconstructedSSTs. Thus, in order to elucidate thisuncertainty, we additionally reconstructed SST byapplying two smaller modern data sets in <strong>the</strong> 125 mmfraction (Johannessen et al., 1994) (Fig. 5F) <strong>and</strong><strong>the</strong>100 mm fraction (Burhol Fig. 5G), respectively. Theplanktonic foraminiferal fauna in <strong>the</strong> coldest watermasses (0–3 1C) is <strong>of</strong>ten completely dominated by <strong>the</strong>single species N. pachyderma (sinistral). Estimates in thistemperature interval are <strong>the</strong>refore considered to beuncertain (Pflaumann et al., 2003). In general, <strong>the</strong> mainstructure <strong>of</strong> three SST reconstructions compare well. Allshow a markedSST reduction at 8800 cal. years BP <strong>and</strong>fairly stable cool temperatures for <strong>the</strong> remaining part <strong>of</strong><strong>the</strong> record. The SST-2 appears to be <strong>of</strong>fset towardswarmer temperatures by 1–2 1C comparedto SST-1. Theoxygen <strong>and</strong>carbon isotopes measuredon benthicforaminifera reflect both <strong>the</strong> ambient bottom watertemperature as well as <strong>the</strong> water mass isotopic compositionduring <strong>the</strong> time <strong>of</strong> precipitation <strong>of</strong> <strong>the</strong> carbonatetest. The benthic foraminiferal species E. excavatum iscommon in Arctic fjords <strong>and</strong> occurs with high frequenciesclose to tide-water glacier termini (Hald<strong>and</strong>Korsun, 1997; Korsun <strong>and</strong>Hald1998).6.2. Early <strong>Holocene</strong>The SST-reconstruction from <strong>the</strong> continental margin<strong>of</strong>f <strong>West</strong> Spitsbergen (MD99-2304, Figs. 5E–G) showthat significantly warmer water than at present wasstarting to develop around 11,000 cal. years BP. Stablewarm conditions prevailed from 10,800 cal. years BPuntil 8800 cal. years BP. This relatively warm periodsuggests that Atlantic Water heat flux in <strong>the</strong> <strong>West</strong>Spitsbergen Current was stronger than at present. Thiswarm periodis reflectedin <strong>the</strong> Van Mijenfjordbydepletion in benthic d 18 O <strong>of</strong> 0.8% between 10,900 <strong>and</strong>10,300 cal. years BP (Fig. 4D), suggesting a warming <strong>of</strong><strong>the</strong> bottom water in <strong>the</strong> fjord. Fur<strong>the</strong>r, warming issupportedby <strong>the</strong> rise in foraminiferal flux, depletion inbenthic d 13 C(Fig. 4C) <strong>and</strong>high abundance <strong>of</strong> macr<strong>of</strong>ossils(Fig. 2), indicative <strong>of</strong> more productive watersthan today. Influx <strong>of</strong> relatively warm oceanic water from<strong>the</strong> continental margin across <strong>the</strong> fjordsill probablycausedthis warming.6.3. Middle <strong>and</strong> Late <strong>Holocene</strong>The rise in d 18 O; d 13 C <strong>and</strong> E. excavatum <strong>and</strong>depletionin foraminiferal flux in <strong>the</strong> fjordrecord(Fig. 4) indicatesa gradual cooling starting around 8800 cal. years BP.
2084ARTICLE IN PRESSM. Hald et al. / Quaternary Science Reviews 23 (2004) 2075–2088This gradual cooling in <strong>the</strong> fjord record differs from <strong>the</strong>abrupt cooling observedon <strong>the</strong> continental margin atthis time (Fig. 5). We assume that <strong>the</strong> abrupt cooling on<strong>the</strong> margin may partly be an indication <strong>of</strong> <strong>the</strong> slowsedimentation rates <strong>and</strong> hence low stratigraphic resolutionafter 8800 cal. years BP as documented for this site(Fig. 5). The fall in SST on <strong>the</strong> margin indicates reducedinfluence <strong>of</strong> warm Atlantic Water <strong>and</strong>increasedinfluence <strong>of</strong> Polar Water <strong>and</strong>/or run<strong>of</strong>f from l<strong>and</strong>.This may be due to a change in <strong>the</strong> drift pattern<strong>and</strong>/or intensity <strong>of</strong> <strong>the</strong> <strong>West</strong> Spitsbergen Current. Theconditions on <strong>the</strong> continental margin apparently remainedstable<strong>and</strong>cool for <strong>the</strong> remaining part <strong>of</strong> <strong>the</strong><strong>Holocene</strong>. However, nei<strong>the</strong>r dating nor time resolutionfor this part <strong>of</strong> <strong>the</strong> record does not permit any detailedreconstructions.We suggest that <strong>the</strong> following three factors may havecontributed to <strong>the</strong> marked reduction in sedimentationrates on <strong>the</strong> continental margin around8800 cal. yearsBP: (1) Early <strong>Holocene</strong> sedimentation rates on continentalmargins that were glaciatedduring <strong>the</strong> last<strong>glacial</strong>, are <strong>of</strong>ten foundto be high due to a large accessto easily erodable glaciogenic sediments from recentlydeglaciated areas (Haldet al., 1999); (2) increase inbottom currents due to a glacio-eustatic fall in sea level(L<strong>and</strong>vik et al., 1987) <strong>and</strong>(3) increasedbottom watererosion due to a deeper flow <strong>of</strong> <strong>the</strong> Atlantic Waterduring cooler conditions. Today, Atlantic Water attainsa gradually deeper flow as it flows northward along <strong>the</strong>Svalbard margin, due to cooling <strong>and</strong> increase <strong>of</strong> density(Hopkins, 1991).In Van Mijenfjord, <strong>the</strong> period 7500–4000 cal. years BPseems to represent a general cooling. This is supportedby high benthic d 18 O indicating cool bottom water, areduction in <strong>the</strong> biogenic production, rise in E.excavatum <strong>and</strong>enhancedIRD (Fig. 4). This generalcooling may partly be influencedby flux <strong>of</strong> cool watersfrom <strong>the</strong> continental margin to <strong>the</strong> fjord, <strong>and</strong> partly dueto a more restrictedfjord/margin water-mass exchangeacross <strong>the</strong> fjord sill due to glacio-isostatic rebound. As<strong>the</strong> isostatic rise continuedtowards <strong>the</strong> present time(L<strong>and</strong>vik et al., 1987), <strong>the</strong> sill <strong>of</strong> Van Mijenfjordgradually became shallower, <strong>and</strong> <strong>the</strong> fjord would likelydevelop more <strong>of</strong> a local climatic signal with reducedconnection to <strong>the</strong> open ocean.The proxy data in <strong>the</strong> fjord record suggest that coolconditions prevailed for <strong>the</strong> last 4000 years, as indicatedby continuedhigh frequencies <strong>of</strong> E. excavatum <strong>and</strong>lowforaminiferal flux (Fig. 4). The slight depletions in bothd 18 O<strong>and</strong>d 13 C indicate changes <strong>of</strong> <strong>the</strong> source <strong>of</strong> <strong>the</strong>bottom water, ra<strong>the</strong>r than a rise temperature sincemodern bottom water temperatures in Van Mijenfjordtoday are already at a minimum between 1 <strong>and</strong>1.5 1C. One possible mechanism for depleting <strong>the</strong>bottom water with respect to d 18 O; without changing <strong>the</strong>temperature, is increasedbrine formation. When sea-icefreezes during <strong>the</strong> fall, brine, characterized by very lowtemperatures <strong>and</strong>high salinity, sinks to a deeper level.This probably explains <strong>the</strong> very coldbottom water inVan Mijenfjordtoday (Skardhamar, 1998). As brineformation takes place in <strong>the</strong> surface water, it also attainsa light d 18 O composition. The brine rapidly sinksthrough <strong>the</strong> water column <strong>and</strong><strong>the</strong>reby brings d 18 O-depleted water to <strong>the</strong> bottom. Current investigationsrecently revealed d 18 O-depleted <strong>and</strong> very cold bottomwater in silled fjords <strong>of</strong> Svalbard, including VanMijenfjord (Mikalsen <strong>and</strong> Hald, unpublished). Thereduction in iceberg rafting over <strong>the</strong> last 4000 years,except for <strong>the</strong> surge event around800 cal. years BP(Haldet al., 2001), may be a response to a morecontinental climate <strong>of</strong> <strong>the</strong> region. This may havedeveloped during an increasing isolation <strong>of</strong> VanMijenfjorddue to glacio-isostatic rebound(cf. L<strong>and</strong>viket al., 1987).7. <strong>Holocene</strong> <strong>glacial</strong> <strong>history</strong> <strong>of</strong> SpitsbergenThe content <strong>of</strong> grains 41 mm in <strong>the</strong> MD99-2305 (Fig.4) may reflect both rafting from icebergs <strong>and</strong>sea-ice. Inaddition, coarser grains may be induced by storminducedsediment suspensions in shallow water (Rumohret al., 2001). However, lack <strong>of</strong> turbidites or o<strong>the</strong>rbottom current structures in <strong>the</strong> sediments, indicate thatthis latter process is <strong>of</strong> less importance in vanMijenfjord. To our knowledge, no systematic studieshave been undertaken with respect to <strong>the</strong> content <strong>of</strong>debris in sea-ice in <strong>the</strong> Svalbard fjords. However, weassume that most <strong>of</strong> <strong>the</strong> IRD reflects rafting from icebergsbasedon <strong>the</strong> following. At present, <strong>the</strong> fjordiscoveredby sea-ice 6–9 months per year, <strong>and</strong>has threeglaciers that calve into <strong>the</strong> fjord, but <strong>the</strong>re is a very lowcontent <strong>of</strong> IRD both at present <strong>and</strong>during <strong>the</strong> last 1000years. This is well documented both in <strong>the</strong> present study(Fig. 4E) <strong>and</strong>by Haldet al. (2001). For two <strong>of</strong> <strong>the</strong>intervals with high IRD flux, <strong>the</strong>re is very goodevidencefor increasedice berg rafting. One <strong>of</strong> <strong>the</strong>se intervals is<strong>the</strong> markedIRD-peak at ca 800 cal. years BP (Fig. 4E)that is correlatedto a surge event that is welldocumented both on l<strong>and</strong> <strong>and</strong> in submarine sedimentsin <strong>the</strong> fjord(Punning et al., 1976; Rowan et al., 1982;Haldet al., 2001). Ano<strong>the</strong>r interval with high IRD fluxwas <strong>the</strong> last deglaciation <strong>of</strong> Van Mijenfjord following<strong>the</strong> Younger Dryas. This deglaciation is well documentedbothin <strong>the</strong> present core <strong>and</strong>from studies on l<strong>and</strong>(L<strong>and</strong>vik et al., 1987; Mangerudet al., 1992).Van Mijenfjordwas deglaciatedby 11,200 cal. yearsBP (corresponding to 9900 14 C years). The lowest date islocatedjust above a diamicton, interpretedto be a till(Fig. 2). This age is assumedto represent a minimum agefor <strong>the</strong> deglaciation <strong>of</strong> <strong>the</strong> fjord <strong>and</strong> is relatively youngcompared to <strong>the</strong> oldest dates <strong>of</strong> <strong>the</strong> deglaciation <strong>of</strong> van
ARTICLE IN PRESSM. Hald et al. / Quaternary Science Reviews 23 (2004) 2075–2088 2085Mijenfjordobtainedby Mangerudet al. (1992).They retrieved a number <strong>of</strong> radiocarbon datesfrom raised marine deposits underlain by till east <strong>of</strong><strong>the</strong> sill in <strong>the</strong> Van Mijenfjordarea, ranging between10,650 <strong>and</strong>9500 14 C years BP. We cannot excludethat <strong>the</strong> oldest de<strong>glacial</strong> sediments in MD99-2305 ismissing, thus implying a younger minimum age for <strong>the</strong>deglaciation compared to oldest dates retrieved byMangerudet al. (1992).The deglaciation phase <strong>of</strong> <strong>the</strong> fjord was characterizedby a very high IRD flux (Fig. 4E). A markedreduction<strong>of</strong> IRD occurredbetween 11,200 <strong>and</strong>11,000 cal. yearsBP (Figs. 3A <strong>and</strong>4E). We assume that this reductionreflects that a larger part <strong>of</strong> <strong>the</strong> glacier withdrew onl<strong>and</strong>. Again, <strong>the</strong> present data gives somewhat youngerages for this deglaciation phase compared to resultsfrom Mangerudet al. (1992), inferring that <strong>the</strong> VanMijenfjordglacier broke up very fast, between 10,600<strong>and</strong>10,300 14 C years BP. However, <strong>the</strong> chronology <strong>of</strong><strong>the</strong> IRD curve from 11,200 cal. years BP (9900 14 C yearsBP) <strong>and</strong>onwards is well supportedin <strong>the</strong> presentstudy. This we believe is a good indicator that an intensebreak-up <strong>of</strong> <strong>the</strong> glacier prevailedat least until 11,000 cal.years BP.The moderate to low IRD flux between 10,500 <strong>and</strong>8000 cal. years BP (Fig. 4E) corresponds partly to aperiod during which <strong>the</strong> o<strong>the</strong>r proxy data in MD99-2305(Figs. 4A–D) indicate a climatic optimum. Fur<strong>the</strong>r,increasedrafting peaking around7500, as well asbetween 7000 <strong>and</strong>4000 cal. years BP, correlates to acooling <strong>of</strong> <strong>the</strong> bottom water <strong>of</strong> <strong>the</strong> fjord, <strong>and</strong> to lowSSTs on <strong>the</strong> continental margin. Thus, increasedraftingmay be a response to a reduction <strong>of</strong> <strong>the</strong> equilibrium linealtitude causing increased tide-water glaciation in VanMijenfjord. After 4000 cal. years BP, ice rating wasreduced. Today, 50% <strong>of</strong> <strong>the</strong> catchment area <strong>of</strong> VanMijenfjordis glaciated, <strong>and</strong>only three glaciers calvedirectly into <strong>the</strong> fjord (Hagen et al., 1993). Thesignificant IRD-flux at ca 800 cal. years BP is, asmentionedabove, correlatedto a markedsurge event,namely that <strong>of</strong> <strong>the</strong> Paula Glacier System (PGS) in <strong>the</strong>inner part <strong>of</strong> <strong>the</strong> fjord(Haldet al., 2001; Dahlgren, inprep.). During this event <strong>the</strong> PGS advanced 35 kmbeyondits present glacier front, leaving an IRD spikethat is evident as a marker horizon in high resolutionacoustic pr<strong>of</strong>iles as well as in a number <strong>of</strong> sediment coresthroughout <strong>the</strong> fjord. We find no evidence in <strong>the</strong>acoustic record <strong>of</strong> any older surges during, e.g. early<strong>and</strong> middle <strong>Holocene</strong>. The presence <strong>of</strong> IRD throughout<strong>the</strong> entire <strong>Holocene</strong> indicates that central Spitsbergenwas never completely deglaciated during this inter<strong>glacial</strong>period.<strong>Holocene</strong> <strong>glacial</strong> fluctuations on Svalbardhave beeninvestigatedin <strong>the</strong> Isfjordarea (Elverhøi et al., 1995;Svendsen <strong>and</strong> Mangerud, 1997). These studies inferreduced <strong>glacial</strong> activity during early/middle <strong>Holocene</strong><strong>and</strong>increasedglaciation for <strong>the</strong> last 4000 years inBillefjordin <strong>the</strong> inner Isfjord, <strong>and</strong><strong>the</strong> last 2000 years atLinnévannet, outer Isfjord. Reduced glaciation duringearly <strong>Holocene</strong> correlates well to <strong>the</strong> present study.However for <strong>the</strong> mid<strong>and</strong>late <strong>Holocene</strong> <strong>the</strong> Isfjordreconstructions <strong>and</strong> <strong>the</strong> present study differ. The IRDrecord in Van Mijenfjord indicates enhanced tidewaterglaciation during mid-<strong>Holocene</strong> <strong>and</strong> somewhat reducedduring late <strong>Holocene</strong>. Svendsen <strong>and</strong> Mangerud (1997)present goodevidences that <strong>the</strong> Linne´ vannet glacier, in<strong>the</strong> outer Isfjordarea, startedto form 4000–5000 yearsago reaching a maximum during <strong>the</strong> Little Ice Age.Thus, we cannot exclude that <strong>the</strong>re are local differencesin <strong>glacial</strong> <strong>history</strong> on Svalbard, although this is not whatwe wouldexpect since <strong>the</strong> areas are only some50–100 km apart. The <strong>Holocene</strong> glacier variations ininner Isfjordare basedlargely on sedimentation rates(Elverhøi et al., 1995). In terms <strong>of</strong> sedimentation ratesall records show a similar pattern. However, we considerIRD to be a more reliable indicator <strong>of</strong> tidewaterglaciation, ra<strong>the</strong>r than sedimentation rates. Changes insedimentation rate are not only dependent on relativeglaciation in <strong>the</strong> catchment area, but also <strong>the</strong> conditionsin <strong>the</strong> accumulation basin.8. CorrelationsWe compare <strong>the</strong> proxy records from <strong>the</strong> Svalbardmargin <strong>and</strong>Van Mijenfjordwith a high resolutionmarine SST proxy recordfrom <strong>the</strong> <strong>West</strong>ern Barents Sea,ca 751N (Sarn<strong>the</strong>in et al., 2003) (Fig. 6). Both SSTrecordsare reconstructed by applying <strong>the</strong> modernanalogue technique to planktonic foraminiferal faunaldata, <strong>and</strong> <strong>the</strong>y are interpreted to reflect latitudinaltemperature gradients <strong>of</strong> Atlantic Water in <strong>the</strong> SpitsbergenCurrent during <strong>the</strong> <strong>Holocene</strong>. These SST-recordsare comparedto <strong>the</strong> Van MijenfjordIRD record<strong>and</strong>summer insolation at 781N (Berger <strong>and</strong>Loutre, 1991).All records have individual, independent, radiocarbonbasedtimescales. The absolute temperatures estimateson <strong>the</strong> Svalbardmargin are somewhat higher comparedto those from <strong>the</strong> Barents Sea. We assume this can beattributedto <strong>the</strong> difference in size fraction usedfor <strong>the</strong>foraminiferal analysis. In <strong>the</strong> present study we used <strong>the</strong>100 mm fraction that will include more <strong>of</strong> <strong>the</strong> smallsubpolar species, implying higher SST, comparedto <strong>the</strong>study <strong>of</strong> Sarn<strong>the</strong>in et al. (2003) using <strong>the</strong>150 mm fraction.However, both SST-records show a remarkable similarityduring <strong>the</strong> early <strong>Holocene</strong>, including <strong>the</strong> abruptcooling around8800 cal. years BP. The early <strong>Holocene</strong>appears to represent <strong>the</strong> <strong>Holocene</strong> climatic optimum.This supports modelling experiments by Liu et al. (2003)predicting increased SST with increasing nor<strong>the</strong>rnlatitude as a function <strong>of</strong> stronger insolation during <strong>the</strong>early <strong>Holocene</strong> (Fig. 6D). The middle <strong>Holocene</strong> SST
2086ARTICLE IN PRESSM. Hald et al. / Quaternary Science Reviews 23 (2004) 2075–208801000SST(°C)SST(°C)W.Barents Sea marginW.Svalbard margin2 4 6 8 10 2 4 6 8 10IRD flux# grains > 1mm/cm 2 /ka1 10 100(A) (B) (C) (D)Insolation (W/m 2 78 − N)500 520 540 560 580200030004000Cal. years BP50006000700080009000100001100012000Fig. 6. Correlation between SST records from (A) <strong>West</strong>ern Barents Sea (Sarn<strong>the</strong>in et al., 2003), (B) W. Svalbardmargin (SST-1, present study), (C)Van MijenfjordIRD (present study) <strong>and</strong>(D) insolation 781N (Berger <strong>and</strong>Loutre, 1991).depicts a decreasing trend in <strong>the</strong> Barents Sea. Superimposedonthis trendare millennial–centennial scalefluctuations. These fluctuations were not identified in <strong>the</strong>Svalbard record, probably due to low stratigraphicresolution. The overall cooling trend during <strong>the</strong> middle<strong>Holocene</strong> in <strong>the</strong> Barents Sea correlates well to increasedtidewater glaciation in Van Mijenfjord. The Barents Searecordis locatedat 751N in a sensitive boundary area(Fig. 1A), <strong>and</strong>abrupt coolings/warmings can be linkedto relatively small displacements <strong>of</strong> <strong>the</strong> Arctic oceanicfront system, separating cool Arctic Water from warmerAtlantic Water (Sarn<strong>the</strong>in et al., 2003).An early <strong>Holocene</strong> warm periodis well documentedina number <strong>of</strong> proxy records from <strong>the</strong> Svalbard <strong>and</strong>western Barents Sea region. In addition to high SSTs <strong>of</strong><strong>the</strong> <strong>West</strong> Spitsbergen Current (Hald<strong>and</strong>Aspeli, 1997;Sarn<strong>the</strong>in et al., 2003), warmer surface waters in <strong>the</strong>fjords are indicated by <strong>the</strong>rmophilic molluscs (Salvigsenet al., 1992). The conclusion <strong>of</strong> Svendsen <strong>and</strong> Mangerud(1997) that <strong>the</strong> glacier Linne´ breen in outer Isfjorddidnot exist during early <strong>Holocene</strong>, may imply atmospherictemperatures <strong>of</strong> at least 1.5–2.5 1C higher than atpresent, if winter precipitation was similar to <strong>the</strong>present. In a study <strong>of</strong> lacustrine sediments on <strong>the</strong> isl<strong>and</strong>Bear Isl<strong>and</strong>, (741N, western Barents Sea), Wohlfarth etal. (1995) concluded that a climatic optimum occurredbetween 9500 <strong>and</strong>8000 14 C years. This is in fairly goodagreement with <strong>the</strong> present study (Fig. 6). However,<strong>the</strong>re are indications <strong>of</strong> a relatively warm middle<strong>Holocene</strong> which contradict <strong>the</strong> present study. Thisincludes both reduced glaciation <strong>of</strong> <strong>the</strong> glacier Linnébreen,as well as presence <strong>of</strong> <strong>the</strong>rmophilic bivalves(Salvigsen et al., 1992). However, <strong>the</strong> frequency <strong>of</strong> <strong>the</strong><strong>the</strong>rmophilic bivalves appears to decline during <strong>the</strong><strong>Holocene</strong>, implying a cooling trendin line with <strong>the</strong>present study. In a study <strong>of</strong> plant macr<strong>of</strong>ossils in asediment core from a lake in <strong>the</strong> outer coastal Isfjordarea Birks (1991) suggests that mean July temperatureswere 2 1C warmer than today between 8000 <strong>and</strong> 500014 C years BP. But <strong>the</strong> periodprior to 8000 years BP wasnot investigatedin that study.9. Conclusions Sea surface temperatures, significantly warmer than atpresent, were recorded on <strong>the</strong> continental margin <strong>of</strong>f<strong>West</strong> Spitsbergen from ca 11,200–8800 cal. years BP. As <strong>the</strong> Van Mijenfjordwas deglaciatedafter <strong>the</strong>Younger Dryas, ca 11,200 cal. years BP, waterwarmer than present almost immediately invaded<strong>the</strong> fjordbottom. The presence <strong>of</strong> IRD throughout <strong>the</strong> entire <strong>Holocene</strong>indicates that central Spitsbergen was never completelydeglaciated during this inter<strong>glacial</strong> period.After <strong>the</strong> glaciation during <strong>the</strong> Younger Dryas, <strong>the</strong>rewas an intense deglaciation phase until ca 11,000 cal.years BP. Moderate to low tidewater glaciationcharacterized<strong>the</strong> early <strong>Holocene</strong>, 11,000–7500 cal.years BP, followedby enhancedglaciation around7500 cal. years BP <strong>and</strong>between 7000 <strong>and</strong>5000 cal.years BP. The <strong>glacial</strong> <strong>history</strong> is supportedby <strong>the</strong> quantitativereconstructions <strong>of</strong> SST on <strong>the</strong> continental margin <strong>and</strong>
ARTICLE IN PRESSM. Hald et al. / Quaternary Science Reviews 23 (2004) 2075–2088 2087relative bottom water temperature in <strong>the</strong> VanMijenfjord record, indicating that <strong>the</strong> warm early<strong>Holocene</strong>, 11,200–8800 cal. years BP, was followedbya cooling, 8800–4000 cal. BP <strong>and</strong>relatively stable,cool conditions <strong>the</strong> last 4000 years.AcknowledgementsFunding was provided by <strong>the</strong> VISTA programme, <strong>the</strong>Research Council <strong>of</strong> Norway to <strong>the</strong> Strategic UniversityProgramme SPONCOM, <strong>and</strong>by <strong>the</strong> RoaldAmundsenCentre, University <strong>of</strong> Tromsø. Technical assistance wasprovided by <strong>the</strong> crews onboard R/V Jan Mayen <strong>and</strong> R/V Marion Dufresne, Jan P. Holm (computer drawings),Edel Ellingsen, Trine Dahl, Odd Aasheim (laboratorywork), Elsebeth Thomsen Hanken (macr<strong>of</strong>ossil identification).Carin Andersson Dahl <strong>and</strong> Kari-Lise Rørvikhelpedwith <strong>the</strong> C2-SST reconstructions. Stable isotopeswere measuredat <strong>the</strong> University <strong>of</strong> Bergen, Norway,Radiocarbon dates were run by <strong>the</strong> RadiocarbonLaboratory in Trondheim, Norway, Uppsala, Sweden,Kiel, Germany <strong>and</strong>Arizona, USA. To all <strong>the</strong>se persons<strong>and</strong>institutions we <strong>of</strong>fer our sincere thanks.ReferencesAndersen, E.S., Dokken, T.M., Elverhøi, A., Solheim, A., Fossen, I.,1996. Late Quaternary sedimentation <strong>and</strong> <strong>glacial</strong> <strong>history</strong> <strong>of</strong> <strong>the</strong>western Svalbardcontinental margin. Marine Geology 133,123–156.Austin, W.E.N., Kroon, D., 1996. Late <strong>glacial</strong> sedimentology,foraminifera <strong>and</strong>stable isotope stratigraphy <strong>of</strong> <strong>the</strong> Hebrideancontinental shelf, northwest Scotl<strong>and</strong>. Late Quaternary Paleoceanography<strong>of</strong> <strong>the</strong> North Atlantic Margins, vol. 111. GeologicalSociety Special Publication, London, pp. 187–213.Bé, A.W.H., Tolderlund, D.S., 1971. Distribution <strong>and</strong> ecology <strong>of</strong> livingplanktonic foraminifera in surface waters <strong>of</strong> <strong>the</strong> Atlantic <strong>and</strong>Indian Oceans. In: Funnel, B.M., Riedel, W.R. (Eds.), TheMicropaleontology <strong>of</strong> Oceans. Cambridge University Press,London.Berger, A., Loutre, M.F., 1991. Insolation values for <strong>the</strong> climate <strong>of</strong> <strong>the</strong>last 10 million years. Quaternary Sciences Review 10 (4), 297–317.Birks, H.H., 1991. <strong>Holocene</strong> vegetational <strong>history</strong> <strong>and</strong>climate change inwest Spitsbergen—plant macr<strong>of</strong>ossils from Skardtjørna, an Arcticlake. The <strong>Holocene</strong> 1 (3), 209–218.Burhol, A., 1994. Resent planktonic foraminifera in <strong>the</strong> NENorwegian Sea <strong>and</strong>western Barents Sea. UnpublishedMasterThesis, University <strong>of</strong> Tromsø (in Norwegian).Carstens, J., Wefer, G., 1992. Recent distribution <strong>of</strong> planktonicforaminifera in <strong>the</strong> Nansen Basin, Arctic Ocean. Deep-SeaResearch 39, S507–S524.Chaudhuri, P., Marron, S., 1999. SiZer for exploration <strong>of</strong> sturctures incurves. Journal <strong>of</strong> <strong>the</strong> Amerikan Statistical Association 94,807–823.Dahlgren, T., 1998. <strong>Holocene</strong> Sedimentation And Glacial <strong>history</strong> <strong>of</strong>inner Van Mijenfjorden, Spitsbergen, University <strong>of</strong> Tromsø, 86pp.Dowdeswell, J., Dowdeswell, E.-K., 1989. Debris in icebergs <strong>and</strong> rates<strong>of</strong> glaci-marine sedimentation; observations from Spitsbergen <strong>and</strong>a simple model. Journal <strong>of</strong> Geology 92 (2), 221–231.Duplessy, J.-C., 1978. Isotope studies. In: Gribbin, J.R. (Ed.),Climatic Change. Cambridge University Press, Cambridge,pp. 46–67.Elverhøi, A., Svendsen, J. I., Solheim, A., Andersen, E. S., Milliman,J., Mangerud, J., Hooke, R.L., 1995. Late Quaternary SedimentYieldfrom <strong>the</strong> High Actic SvalbardArea: The Journal <strong>of</strong> Geology,vol. 103, pp. 1–17.Fairbanks, R.G., 1989. A 17000-year glacio-eustatic sea level record:influence <strong>of</strong> <strong>glacial</strong> melting rates on <strong>the</strong> Younger Dryas event <strong>and</strong>deep-ocean circulation. Nature 342, 637–642.Fan, J., 1991. Design-adaptive nonparametric regression. Journal <strong>of</strong><strong>the</strong> American Statistical Association 87, 998–1004.Feyling-Hanssen, R.W., 1958. Mikropaleontologiens teknikk. NorwegianGeotechnical Institute 29, 1–14.Gulliksen, B., Holte, B., Jakola, K.-J., 1985. The s<strong>of</strong>t bottom fauna invan Mijenfjord <strong>and</strong> Raudfjord, Svalbard. In: Gray, J.S., Christiansen,M.E. (Eds.), Marine Biology <strong>of</strong> Polar Regions <strong>and</strong> Effects<strong>of</strong> Stress on Marine Organisms, pp. 199–215Hadley Centre, 2004. http://www.met-<strong>of</strong>fice.gov.uk/research/hadleycentre/models/modeldata.html.Hagen, J.O., Liestøl, O., Sollid, J.L., Wold, B., Østrem, G., 1993.Glacier atlas <strong>of</strong> Svalbard<strong>and</strong>Jan Mayen. Norsk PolarinstituttMeddelelser(129), 141pp.Hald, M., Aspeli, R., 1997. Rapid climatic shifts <strong>of</strong> <strong>the</strong> nor<strong>the</strong>rnNorwegian Sea during <strong>the</strong> last deglaciation <strong>and</strong> <strong>the</strong> <strong>Holocene</strong>.Boreas 26, 15–28.Hald, M., Korsun, S., 1997. Distribution <strong>of</strong> modern Arctic benthicforaminifera from fjords <strong>of</strong> Svalbard. Journal <strong>of</strong> ForaminiferalResearch 27, 101–122.Hald, M., Kolstad, V., Polyak, L., Forman, L., Herlihy, F.A., Ivanov,G., Nescheretov, A., 1999. Late-<strong>glacial</strong> <strong>and</strong><strong>Holocene</strong> <strong>paleoceanography</strong><strong>and</strong>sedimentary environments in <strong>the</strong> Saint Anna Trough,Eurasian Arctic Ocean Margin. Palaeogeography, Palaeoclimatology,Palaeoecology 146, 229–249.Hald, M., Dahlgren, T., Olsen, T.-E., Lebesbye, E., 2001. Late<strong>Holocene</strong> <strong>paleoceanography</strong> in Van Mijenfjorden, Svalbard. PolarResearch 20, 23–35.Hanssen-Bauer, I., Kristensen, M.S., Steffensen, E.L., 1990. TheClimate <strong>of</strong> Spitsbergen. DNMI, Oslo.Hopkins, T.S., 1991. The GIN Sea—a syn<strong>the</strong>sis <strong>of</strong> its physicaloceanography <strong>and</strong>literature review 1972–1985. Earth-ScienceReviews 30, 175–318.Johannessen, T., Jansen, E., et al., 1994. The relationship betweensurface water masses, oceanographic fronts, <strong>and</strong>paleoclimaticproxies in surface sediments <strong>of</strong> <strong>the</strong> Greenl<strong>and</strong>, Icel<strong>and</strong>, NorwegianSeas. Nato ASI Series 117, 61–85.Juggins, S., 2002. C2 1.3 version. http://www.staff.ncl.ac.uk/stephen.juggins.Korsun, S., Hald, M., 1998. Modern benthic foraminifera <strong>of</strong>f tidewater glaciers, Novaja Semlja, Russian Arctic. Arctic <strong>and</strong>AlpineResearch 30 (1), 61–77.Labeyrie, L., Jansen, E., Cortijo, 2003. Les rapports de campagnes a` lamer. MD 114/IMAGES V OCE/2003/02. Brest, Institut PolaireFrancais-Paul Emile Victor, 850pp.L<strong>and</strong>vik, J.Y., Mangerud, J., Salvigsen, O., 1987. The late Weichselian<strong>and</strong><strong>Holocene</strong> shoreline displacement on <strong>the</strong> west-central coast <strong>of</strong>Svalbard. Polar Research 5, 29–44.Liu, Z., Brady, E., Lynch-Stieglitz, J., 2003. Global ocean response toorbital forcing in <strong>the</strong> <strong>Holocene</strong>. Paleoceanography 18, 1041,doi:10.1029/2002PA000819.Mangerud, J., Gulliksen, S., 1975. Apparent Radiocarbon Ages <strong>of</strong>Recent Marine Shells from Norway, Spitsbergen <strong>and</strong>ArcticCanada. Quaternary Research 5, 263–273.Mangerud, J., Bolstad, M., Elgersma, A., Helliksen, D., L<strong>and</strong>vik, J.Y.,Lønne, I., Lycke, A.K., Salvigsen, O., S<strong>and</strong>ahl, T., Svendsen, J.I.,
2088ARTICLE IN PRESSM. Hald et al. / Quaternary Science Reviews 23 (2004) 2075–20881992. The Last Glacial Maximum on Spitsbergen, Svalbard. Boreas38, 1–31.Meldgaard, S., Knudsen, K.L., 1979. Metoder til indsamling ogoparbejding af prøver til foraminifer-analyser. Dansk natur Danskskole.Pflaumann, U., Duprat, J., Pujol, C., Labeyrie, L.D., 1996. SIMMAX:A modern analog technique to deduce Atlantic sea surfacetemperatures from planktonic foraminifera in deep-sea sediments.Paleoceanography 11, 15–35.Pflaumann, U., Sarn<strong>the</strong>in, M., Chapman, M., Ld’AZbreu, L., Funnell,B., Huels, M., Kiefer, T., Maslin, M., Schultz, H., Swallow, J., vanKreveld, S., Vautravers, M., Vogelsang, E., Weinelt, M., 2003.Glacial North Atlantic Sea-surface conditions reconstructed byGLAMAP 2000. Paleoceanography 18 (3) 10-1–10-21.Punning, J.-M., Troitsky, L., Rajamae, R., 1976. The genesis <strong>and</strong>age<strong>of</strong> <strong>the</strong> Quaternary deposits in <strong>the</strong> eastern part <strong>of</strong> Van Mijenfjorden,<strong>West</strong> Spitsbergen. Geologiska Fo¨reningens Fo¨rh<strong>and</strong>lingar 98,343–347.Rowan, D.E., Pewe, T.L., Pewe, R.H., 1982. <strong>Holocene</strong> <strong>glacial</strong> geology<strong>of</strong> <strong>the</strong> Svea lowl<strong>and</strong>, Spitsbergen, Svalbard. Geografiske Annaler64A, 35–51.Rumohr, J., Blaume, F., Erlenkeuser, H., Fohrmann, H., Hollender,F.-J., Mienert, J., Schäfer-Neth, C., 2001. Records <strong>and</strong> processes <strong>of</strong>near-bottom sediment transport along <strong>the</strong> Norwegian–Greenl<strong>and</strong>Sea margins during <strong>the</strong> <strong>Holocene</strong> <strong>and</strong> Late Weichselian (TerminationI) times. In: Schäfer, P., Ritzrau, W., Schlüter, M., Thiede, J.(Eds.), The Nor<strong>the</strong>rn North Atlantic, a Changing Environment.Springer, Berlin, Heidelberg, New York, 500pp.Ruppert, D., Shea<strong>the</strong>r, S.J., W<strong>and</strong>, M.P., 1995. An effective b<strong>and</strong>withselector for local least square selections. Journal <strong>of</strong> <strong>the</strong> AmericanStatistical Association 90, 1257–1270.Salvigsen, O., Winsnes, T.O., 1989. Geological map <strong>of</strong> Svalbard1:100,000. Sheet C10G Braganzavågen (Map). Norsk PolarinstituttTemakart 4.Salvigsen, O., Forman, S.L., Miller, G.H., 1992. Thermophilousmolluscs on Svalbardduring <strong>the</strong> <strong>Holocene</strong> <strong>and</strong><strong>the</strong>ir paleoclimaticimplications. Polar Research 11 (1), 1–10.Sarn<strong>the</strong>in, M., Van Kreveld, S., Erlenkeuser, H., Grootes, P.M.,Kucera, M., Pflaumann, U., Schulz, M., 2003. Centennial-tomillennial-scaleperiodicities <strong>of</strong> <strong>Holocene</strong> climate <strong>and</strong> sedimentinjections <strong>of</strong>f <strong>the</strong> western Baretns shelf, 751N. Boreas 32, 447–461.Shackleton, N.J., Opdyke, N.D., 1973. Oxygen Isotope <strong>and</strong> PalaeomagneticStratigraphy <strong>of</strong> Equatorial Pacific Core V28-238: OxygenIsotope Temperatures <strong>and</strong>Ice Volume on a 10 5 Year <strong>and</strong>10 6 YearScale. Quaternary Research 3, 39–55.Shackleton, N.J., Imbrie, J., Hall, M.A., 1983. Oxygen <strong>and</strong>carbonisotope record<strong>of</strong> The East Pacific core V19-30: implications for <strong>the</strong>formation <strong>of</strong> deep water in <strong>the</strong> late Pleistocene North Atlantic.Earth Planetary Science Letter 65, 233–244.Skardhamar, J., 1998. Sirkulasjonen i Van Mijenfjorden, en arktiskfjord (Circulation in Van Mijenfjorden, an Arctic fiord). MasterThesis, University <strong>of</strong> Bergen, Bergen, 79pp.Steel, R.J., Worsley, D., 1984. Svalbards post-Caledonian strata—anatlas <strong>of</strong> seidmentological patterns <strong>and</strong> paleogeographicevolution. In: Spencer, A.M.e.a.e. (Ed.), Petroleum Geology <strong>of</strong><strong>the</strong> Nor<strong>the</strong>rn European Margin. Graham <strong>and</strong>Trotman, London,pp. 109–135.Stuiver, M., et al., 1998. INTCAL98 Radiocarbon age calibration,24,000-0 cal BP. Radiocarbon 40 (3), 1041–1083.Svendsen, J.I., Mangerud, J., 1997. <strong>Holocene</strong> <strong>glacial</strong> <strong>and</strong> climaticvariations on Spitsbergen, Svalbard. The <strong>Holocene</strong> 7, 45–57.Vinje, T., 1985. The physical environment, <strong>the</strong> western Barents Sea.Drift, composition, morphology <strong>and</strong>distribution <strong>of</strong> <strong>the</strong> sea icefields in <strong>the</strong> Barents Sea. Norsk Polarinstitutt Skrifter 179c p. 26.Wadhams, P., 1981. The ice cover in <strong>the</strong> Greenl<strong>and</strong> <strong>and</strong> NorwegianSeas. Review Geophysical Space Physics 19, 345–393.Waelbroeck, C., Duplessy, J.-C., Miches, E., Labeyrie, L., Paillard, D.,Duprat, J., 2001. The timing <strong>of</strong> <strong>the</strong> last deglaciation in NorthAtlantic climate records. Nature 412, 724–727.Wohlfarth, B., et al., 1995. Early <strong>Holocene</strong> environment on Bjørnøya(Svalbard) inferred from multidisciplinary lake sediment studies.Polar Research 14, 253–275.


