QOF Plus Year 1 - Imperial College London
QOF Plus Year 1 - Imperial College London
QOF Plus Year 1 - Imperial College London

Create successful ePaper yourself
Turn your PDF publications into a flip-book with our unique Google optimized e-Paper software.
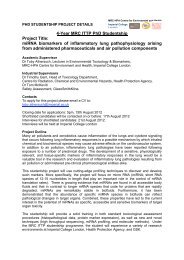
Exception Reporting Rate (Percentage of Eligible Patients)25%20%r=0.72 (outliers removed)15%10%5%0%70% 75% 80% 85% 90%AttainmentOutliersFigure A2.8Scatter plot relating aggregate attainment and exception reporting rates for 28 (out of 30)Hammersmith and Fulham practices across the 12 <strong>QOF</strong> indicators used in <strong>QOF</strong>+. Data were sourcedfrom QMAS in June 2008 and were incomplete for 1 practice (omitted) and 1 outlier is not shown(attainment 51.9%, exception reporting grate 5.1%). Practices with above average disease registersizes (adjusted for list size) are shaded in green while those with below average register sizes areoutlined in red. There is a strong correlation between increased attainment and exception reportingrates in Hammersmith and Fulham (r=0.72, circled outliers not included). The exception rates shownare not EER but the means of the individual rates for each practice, attainment was determined in thesame way.A somewhat counterintuitive mathematical feature of exception reporting is that it sometimesrewards considerably less than if excepted patients were treated to meet the indicator criteriainstead. For simplicity, consider a situation where there is a patient population of 4, two of whommeet target criteria (i.e. current attainment of 50%). If both patients are either excepted ortreated then attainment increases to 100% in both instances. If, however, one patient remainsunmanaged (not treated and not excepted) and we consider only the treatment or exception of asingle patient, the situation is different. Excepting that patient reduces the denominator by 1 andresults in an attainment of 66.7%. By contrast, treating that patient increases the numerator by 1and results in an attainment of 75% (8.3% more). In general, it can be said that excepting isalways less profitable than treating while there are unmanaged patients in the denominatorgroup (8.3% is the maximal difference). This issue is relevant to both indicator design (as towhether particular actions should be considered as numerator qualifiers or exceptions) and tothe way exception reporting is promoted or otherwise to GPs.113