QOF Plus Year 1 - Imperial College London
QOF Plus Year 1 - Imperial College London
QOF Plus Year 1 - Imperial College London

You also want an ePaper? Increase the reach of your titles
YUMPU automatically turns print PDFs into web optimized ePapers that Google loves.
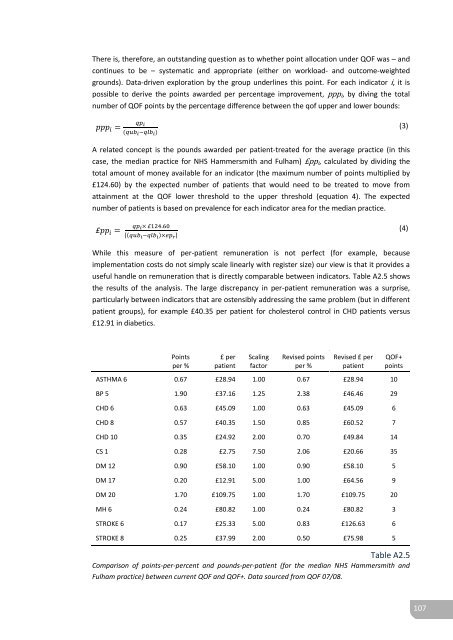
There is, therefore, an outstanding question as to whether point allocation under <strong>QOF</strong> was – andcontinues to be – systematic and appropriate (either on workload- and outcome-weightedgrounds). Data-driven exploration by the group underlines this point. For each indicator i, it ispossible to derive the points awarded per percentage improvement, ppp i, by diving the totalnumber of <strong>QOF</strong> points by the percentage difference between the qof upper and lower bounds:(3)A related concept is the pounds awarded per patient-treated for the average practice (in thiscase, the median practice for NHS Hammersmith and Fulham) £pp i, calculated by dividing thetotal amount of money available for an indicator (the maximum number of points multiplied by£124.60) by the expected number of patients that would need to be treated to move fromattainment at the <strong>QOF</strong> lower threshold to the upper threshold (equation 4). The expectednumber of patients is based on prevalence for each indicator area for the median practice.⌈⌉(4)While this measure of per-patient remuneration is not perfect (for example, becauseimplementation costs do not simply scale linearly with register size) our view is that it provides auseful handle on remuneration that is directly comparable between indicators. Table A2.5 showsthe results of the analysis. The large discrepancy in per-patient remuneration was a surprise,particularly between indicators that are ostensibly addressing the same problem (but in differentpatient groups), for example £40.35 per patient for cholesterol control in CHD patients versus£12.91 in diabetics.Pointsper %£ perpatientScalingfactorRevised pointsper %Revised £ perpatient<strong>QOF</strong>+pointsASTHMA 6 0.67 £28.94 1.00 0.67 £28.94 10BP 5 1.90 £37.16 1.25 2.38 £46.46 29CHD 6 0.63 £45.09 1.00 0.63 £45.09 6CHD 8 0.57 £40.35 1.50 0.85 £60.52 7CHD 10 0.35 £24.92 2.00 0.70 £49.84 14CS 1 0.28 £2.75 7.50 2.06 £20.66 35DM 12 0.90 £58.10 1.00 0.90 £58.10 5DM 17 0.20 £12.91 5.00 1.00 £64.56 9DM 20 1.70 £109.75 1.00 1.70 £109.75 20MH 6 0.24 £80.82 1.00 0.24 £80.82 3STROKE 6 0.17 £25.33 5.00 0.83 £126.63 6STROKE 8 0.25 £37.99 2.00 0.50 £75.98 5Table A2.5Comparison of points-per-percent and pounds-per-patient (for the median NHS Hammersmith andFulham practice) between current <strong>QOF</strong> and <strong>QOF</strong>+. Data sourced from <strong>QOF</strong> 07/08.107