QOF Plus Year 1 - Imperial College London
QOF Plus Year 1 - Imperial College London
QOF Plus Year 1 - Imperial College London

You also want an ePaper? Increase the reach of your titles
YUMPU automatically turns print PDFs into web optimized ePapers that Google loves.
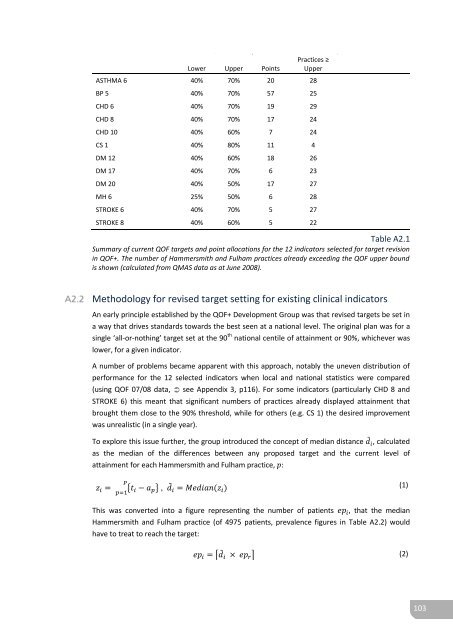
Lower Upper PointsPractices ≥UpperASTHMA 6 40% 70% 20 28BP 5 40% 70% 57 25CHD 6 40% 70% 19 29CHD 8 40% 70% 17 24CHD 10 40% 60% 7 24CS 1 40% 80% 11 4DM 12 40% 60% 18 26DM 17 40% 70% 6 23DM 20 40% 50% 17 27MH 6 25% 50% 6 28STROKE 6 40% 70% 5 27STROKE 8 40% 60% 5 22Table A2.1Summary of current <strong>QOF</strong> targets and point allocations for the 12 indicators selected for target revisionin <strong>QOF</strong>+. The number of Hammersmith and Fulham practices already exceeding the <strong>QOF</strong> upper boundis shown (calculated from QMAS data as at June 2008).Methodology for revised target setting for existing clinical indicatorsAn early principle established by the <strong>QOF</strong>+ Development Group was that revised targets be set ina way that drives standards towards the best seen at a national level. The original plan was for asingle ‘all-or-nothing’ target set at the 90 th national centile of attainment or 90%, whichever waslower, for a given indicator.A number of problems became apparent with this approach, notably the uneven distribution ofperformance for the 12 selected indicators when local and national statistics were compared(using <strong>QOF</strong> 07/08 data, see Appendix 3, p116). For some indicators (particularly CHD 8 andSTROKE 6) this meant that significant numbers of practices already displayed attainment thatbrought them close to the 90% threshold, while for others (e.g. CS 1) the desired improvementwas unrealistic (in a single year).To explore this issue further, the group introduced the concept of median distance ̃ , calculatedas the median of the differences between any proposed target and the current level ofattainment for each Hammersmith and Fulham practice, :{ } , ̃ (1)This was converted into a figure representing the number of patients that the medianHammersmith and Fulham practice (of 4975 patients, prevalence figures in Table A2.2) wouldhave to treat to reach the target:⌈ ̃ ⌉ (2)103