THE GEOLOGY AND GEOCHEMISTRY OF THREE HOT SPRING ...
THE GEOLOGY AND GEOCHEMISTRY OF THREE HOT SPRING ...
THE GEOLOGY AND GEOCHEMISTRY OF THREE HOT SPRING ...

You also want an ePaper? Increase the reach of your titles
YUMPU automatically turns print PDFs into web optimized ePapers that Google loves.
<strong>THE</strong> <strong>GEOLOGY</strong> <strong>AND</strong> <strong>GEOCHEMISTRY</strong> <strong>OF</strong> <strong>THREE</strong> <strong>HOT</strong><strong>SPRING</strong> SYSTEMS IN <strong>THE</strong> SHOUP GEO<strong>THE</strong>RMALAREA, LEMHI COUNTY, IDAHOIByDAVID B. VANCEi'~!IiA thesis submitted in partial fulfillment ofthe requirements for the degree ofMASTER <strong>OF</strong> SCIENCE IN <strong>GEOLOGY</strong>WASHINGTON STATE UNIVERSITYDepartment of GeologyDecember 1986
To the faculty of Washington State University:The members of the Committee appointed to examine thethesis of DAVID B. VANCE find it satisfactory andrecommend that it be accepted:i i
ACKNOWLEDGMENTSI would like to express my sincere appreciation to my thesisadvisor, Dr. Philip E. Rosenberg, for his guidance, support andpatience during the course of this research. Also, thanks to Dr. A. J.Watkinson and Dr. F. F. Foit for serving on my thesis committee. Iexpress special thanks to the staff of Advanced Mineral Technologies,Inc. for their support and aid in assembling this thesis.Thanks is given to the Washington Mining and Mineral ResourcesResearch Institute for their financial support of my field research.Lastly, special thanks to my parents, Gaston B. and Melba Vance,and my wife, Karen, for their support in this endeavor.iii
<strong>THE</strong> <strong>GEOLOGY</strong> <strong>AND</strong> <strong>GEOCHEMISTRY</strong> <strong>OF</strong> <strong>THREE</strong> <strong>HOT</strong><strong>SPRING</strong> SYSTEMS IN <strong>THE</strong> SHOUP GEO<strong>THE</strong>RMAL AREA,LEMHI COUNTY, IDAHOABSTRACTby David B. Vance, M.S.Washington State UniversityDecember 1986Chairman:Philip E. RosenbergThree geotllermal systems in the Shoup Geothermal Area in LemhiCounty, Idaho were studied.Detailed mapping and chemical analysiswere done for thermal vent sites at Big Creek, Owl Creek and HorseCreek Hot Springs.Temperature and depth of equilibration wereestimated to be 181·C at 3.4 km and 127·C at 2.4 km for Big Creek andOwl Creek Hot Springs, respectively.At Horse Creek two vent systems,40·C at 0.5 km and 70·C at 1.0 km are present. Slightly higher thannormal geothermal gradients exist in the area, probably due to theproximity of relatively highly radioactive epizonal Eocene plutons.The geothermal systems at Big Creek and Owl Creek Hot Springs arecontained within fracture zones in Precambrian (1.5 B.Y.) terrain. Astrong linear-planar fabric with NWorientation has been imprinted onthe rocks by at least 3 deformational episodes resulting in a preferredorientation for fracture zones that have been active since thePrecambrian.At Horse Creek the geothermal system is located in a NWtrending cataclastic border zone between the Eocene Painted Rocks Lakepluton and the Precambrian terrain.The vellts at Big Creek Hot Springs are located at the edge of theanisotropic terrain; the fracture zone intersects structurallyisotropic rock, causing the zone to widen and fracture density to;vH," I
I" !.'.;~'~:!Ii ~i~ ~decrease. The vents at Owl Creek are controlled by a minor reverse; I'Bfault in a shear zone located in the corner of a faulted block. The~:~!'vents at Horse Creek are in sheared quartz monzonite. The lowtemperature vents are controlled by an intersecting minor strike slipfault that serves to dilate fractures in the shear zone, increasingpermeability.Dikes cross-cutting the cataclastic border zone forceswater into the available channels.The high temperature vents areadjacent to a cross-cutting plug of quartz latite porphyry.vJI
ITABLE <strong>OF</strong> CONTENTSPageACKNOWLEDGEMENTSiiiABSTRACTivLIST <strong>OF</strong> TABLESxLIST <strong>OF</strong> ILLUSTRATIONSxiiI. INTRDDUCT ION 1Purpose and Scope1Location and Access1Geologic Mapping3Structural Analysis4Petrologic Survey4Hydrologic Survey4Geochemical Survey5Previous Investigations6II. REGIONAL GEOLOGIC SETTING <strong>AND</strong> HISTORY8Geologic Setting8Geologic History11Precambrian Events11Mesozoic Events13Tertiary Events13I II . PETROLOG IC Sli RVEY 15Introduction15Metamorphic Rocks15Augen Gneiss17QUartz-Feldspar-Biotite Gneiss18Quartz Biotite Schist19Quartzite Member of the Yellow Jacket Formation19Amph ibo 1ite20Carbonate-Rich Dikes21Petrogenesis of the Metamorphic Rocks21Augen Gneiss21Rocks of the Yellow Jacket Formation22Amphibolite23Carbonate-Rich Dikes23vi
•IiTertiary Intrusive Rocks24The Painted Rocks Lake Pluton at Horse Creek24Dik es27Hors e Creek27Quartz Lat ite27Spherulitic Quartz Latite28Quartz Latite Porphyry28Owl Creek28Diorite30Porphyritic Dacite30Hot Springs Creek30Petrogenesis of Tertiary Intrusive Rocks30Quartz Monzonite Main Body30Mi crogran ite31Cataclastic Zone32Quartz Latite Dikes33Dikes at Owl Creek and Hot Springs Creek34IV. STRUCTURAL <strong>GEOLOGY</strong> 35Introduction35Distribution of Rock Types46Hot Springs Creek46Owl Creek46Horse Creek46Geometrical Analysis47Deformational History: Effect of Anisotropy 47on Ductile and Brittle FieldsIntroduction47Ductile Field50Fl Deformation50F2 Deformation53F3 Deformation56Brittle Field57I nt rodu cti on58Hot Springs Creek61Owl Creek61Hors e CreekGeology of Hot Spring Vent Sites63Big Creek Hot Springs63Ow 1 Creek64Hors e Creek65vii
· !.I'; ~:J
;I~i~ VIII.I::::::~::~e:::::CONOHICEconomic Potential.Ii IX. CONCLUSIONS~I~REFERENCES, ~:~! APPENDICES:~'CITEDPOTENTIAL <strong>OF</strong> <strong>THE</strong> SHOUPI: Appendi x A: Contoured structural diagrams for Hot SpringsI:Creek, Owl Creek, and Horse Creek Study areas..,liAppendix B: Determination of the Temperature of a Hot WaterComponent in a Mixed Geothermal WaterIId !! ": I117117120122126137146I!;I i, :i: IIIIiIii; ~!ix
LIST <strong>OF</strong> TABLESTable 1Table 2Table 3Visually estimated modal composition of majorPrecambrian metamorphic units in the Shoup GeothermalAreaVisually estimated modal composition of major unitsin the Tertiary Painted Rocks lake PlutonVisually estimated modal composition of Teritiarydikei in the ~houp Geothermal Area162629Table 4 Structural field data 48,Table 5Table 6Table 7Table 8Table 9Table 10Table 11Table 12Table 13Table 14Physical/chemical data for Big Creek Hot Springson 6/23/81Physical/chemical data for Big Creek Hot Springson 10/3/81Calculated temperatures 0C using the Na/KF, NaKT,Na/K/Ca, li, and Na/li geothermometers for Big CreekHot Spri ngsPhysical/chemical data for Owlon 6/25/81 and 10/4/81777778Creek Hot Springs 83Calculated tem~eratures using the Na/KF, NaKT,Na/K/Ca, li, and Na/li geothermometers for OwlHot SpringsPhysical/chemical data for Horse Creekon 6/21/81, 9/18/81 and 9/19/81Calculated temperatures using the Na/KF, NaKT,Na/K/Ca, li, and Na/li geothermometers for HorseCreek Hot SpringsSilica concentration and calculated temperaturesfor Big Creek Hot Springs, Owl Creek Hot Springsand Horse Creek Hot SpringspH, temperature and conductivity of nonthermalsprings in the Shoup Geothermal AreaCreekpH, temperature and cation chemistry of nonthermalsprings in hot spring drainage basins84Hot Springs 8888899393x.İf'1111,.
Table 15Table 16Table 17Table 18Indications of radioactivity in epizonal Tertiaryplutons bordering the Idaho batholithRate of mass removal from the Big Creek,and Horse Creek geothermal systems98Owl Creek, 113Hydraulic head, maximum temperature, density, andpercent density decrease (from 10 0 C) of thermal watersin the Big Creek, Owl Creek, and Horse Creek geothermalsystemsReservoir volume and reservoir thermal energy for theBig Creek, Owl Creek, and Horse Creek geothermalsystems116120xi
LIST <strong>OF</strong> ILLUSTRATIONSI!Figure 11i'Figure 2'F i gu re 3Figure 4IFigure 5iFigure 6IFigure 7I'Figure 8Locat i on of therma 1 spring sites. nontherma 1spring sites, drainages and position of thestudy area in IdahoGeologic setting of the Shoup Geothermal Area 10Geologic outcrop map of the Shoup Geothermal Area 38Geologic map of the Big Creek Hot Springs study area 39Geologic map of the Owl Creek Hot Springs study area 40Geologic map of the Horse Creek Hot Springs study area 41Geologic mapvent siteGeologic mapvent siteof the Big Creek Hot Springs thermal 42of the Owl Creek Hot Springs thermal 432Figure 9Geologic map of the Horse CreekHorse Creek Hot Springs (HC-1)thermal vent site, 44Figure 10 Geologic map of the Lindgren Creek thermal vent 45site, Horse Creek Hot Springs (HC-2):Figure 11 Regional foliation and lineation trends F1, F2, 52and F3 North and south of the Hot Springs Creekfault~':'Figure 12 Fracture orientations south of the Hot Springs 59Creek fau ltFigure 13 Fracture orientations north of the Hot Springs 59Creek f au lt;Figure 14 Fracture orientations at Owl Creek 62Figure 15 Location of epizonal Tertiary plutons in and aroundthe study area97,'Figure 16 Structural trends in the south subarea, Hot SpringsI Creek138IFigure 17 Structural trends in the north subarea, Hot Springs 139Creekxii
~,",i1 'F'19ure 18 Struct ura1 t ren ds 1n th e nor theast su barea, 0w1 Creek 140Figure 19 Structural trends in the southeast subarea, Owl Creek 141Figure 20 Structural trends in the west subarea, Owl Creek 142'Figure 21 Composite structural trends at Owl Creek 143iIF'19ure 22 Struet ura 1 t ren ds ln . the sou th su barea, Horse Creek 144Figure 23 Structural trends in the north subarea, Horse Creek 145Figure 24 Dissolved silica-enthalpy graph to be used when 150assumption is made that no steam or heat has,been lost before mixingFigure 25 Temperature-enthalpy relations for liquid water in 151equilibrium with steam,Figure 26 Dissolved silica enthalpy graph to be used when 152assumption is made that steam separated at 100·Cfrom the hot-water component before mixingi Figure 27 Plots for Big Creek and Owl Creek Hot Springs 153I assuming that steam separated at 100·Cfrom the hot-water component before mixingxiii_.....~.;----------------------------I,I~:'
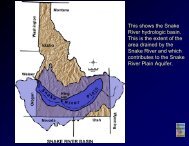
I. IHTROOUCTIOHPURPOSE <strong>AND</strong> SCOPEAn investigation was undertaken of three geothermal systems; BigCreek Hot Springs. Owl Creek Hot Springs and Horse Creek Hot Springslocated in the region west of Shoup, Idaho, named in this study as theShoup Geothermal Area (Figure 1). The purpose of this study is~ fourfold: (1) to determine the structure, petrology and history of theareas surrounding these thermal systems; (2) to determine the specificstructural control of the location of the thermal vents; (3) to analyzethe thermal waters so that chemical geothermometers may be used todetermine the temperature of the last water/rock equilibrium for thewater vented at the surface and to estimate the depth of circulation;and (4) to determine and compare the hydrology of each thermal system.LOCATION <strong>AND</strong> ACCESSThe study area is located in the region adjacent to the- southeastern bord~rzone of the Bitterroot Lobe of the Idaho batholithIi and west of Shoup, Idaho (Figure 1). Big Creek Hot Springs is 9.6 krn-southwest of Shoup, at latitude 45°18'37"N and longitude 114 20'17"W,0-along Hot Springs Creek.Owl Creek Hot Springs is 16.1 kmwest-southwest of Shoup, at latitude 45°20'40"N and longitude1114°27'44W, along Owl Creek.Horse Creek Hot Springs is 20.9 kmnorthwest of Shoup, at latitude 45°30'12"N and longitude 114.27'46"W,along Horse Creek.Most of the area studied is in the U.S. Geological'Survey Shoup (Idaho) 15' quadrangle map; Horse Creek Hot Springs ;slocated in the southern margin of the U.S. Geological Survey PaintedIiRocks Lake (Montana-Idaho) 15' quadrangle map.1~..L..I.~..._
30'25'20'~\25'er 190 lero SilO 4~IClol.l III Kll.OIIITlll1II20';NIL.----------r---.c...--------..-:L -.J45° 15'o 2 3 4 5 /0,-L--1_.... ' _1-'_L.'---J''-- ......' p- <strong>HOT</strong> SPRiNGSSCALE IN KILOMETERS X - NON·.<strong>THE</strong>RMAL <strong>SPRING</strong>S' COMPLETE ANALYSIS• - NON <strong>THE</strong>RMAL <strong>SPRING</strong>S: PH <strong>AND</strong> TEMPERATUREFigure 1 Location of thermal spring sites, nonthermal spring sites,drainages and position of the Shoup Geothermal Area in Idaho.2
Access to the area is from North Fork, Idaho, on State Highway 93and westward along the Salmon River on Salmon National Forest Road 30.Near Shoup, Forest Road 30 is intersected by Forest Road 38 whichtravels north towards Horse Creek. Forest Road 38 intersects Forest! Road 44 at the Idaho-Montana state line. By traveling west on 44Forest Road 65 is reached, which gives direct access to Horse Creek HotSpri ngs.Salmon National Forest Road 30 continues through Shoup and travelswest along the Salmon River (Figure 1), giving access to Big Creek and! Owl Creek Hot Springs. At the confluence of the Salmon River andPanther Creek (Figure I). Forest Road 55 proceeds south along PantherCreek towards Hot Springs Creek. At the confluence of Panther Creek,and Clear Creek (Figure 1), Forest Road 60 can be taken east to HotSprings Creek approximately 400 Mnortheast of Big Creek Hot Springs.There is no direct access by road to 0\.,.1 Creek Hot Springs. Aforest trail that begins at the confluence of the Salmon River and Owlj Creek (Figure 1), along Forest Road 30, is the only access (3.5 km by,foot) to the hot spring site. Numerous other forest roads and loggingtrails give access to the region around and between the hot springsites. The region to the west of Panther Creek is in the Idaho. Primitive Area.GEOLOGIC MAPPINGAn area of approximately 6.5 km2 (2.5 mi 2) was mapped in detailiaround the vents of each of the thermal systems. The distribution ofmajor rock types and structural trends was determined. Mapping wasdone on 1:12,000 scale topographic maps prepared from photographic3
, enlargements of 15 1 USGS quadrangle maps. Detailed maps of the thermal· vent sites were made using a Brunton compass and 100-ft tape measure.1A reconnaissance of the general region around the three hot springsystems was made with particular emphasis on nonthermal springs in the. area. Aerial photographs (1;24,000) obtained from the United Statesi Department of Agriculture, Agriculture Stabilization and Conservation~ Service, were used to provide control for geologic mapping on! topographic base maps and for delineation of major structures.STRUCTURAL ANALYSISOrientation of joints, fracture cleavage in fracture zones, dikes,'foliations and lineations were measured in the study areas. Equal areanet diagrams were used to determine major structural trends and. interpret the structural history. Thin sections were used to examinemicroscopic deformation textures present in the igneous and metamorphicrock s.PETROLOGIC SURVEYThin sections were prepared of the major rock types in the threeareas. Mineral composition and texture were determined, with emphasison the various fabrics present. Thin sections and hand specimens wereused to visually estimate the mode and develop a general classificationscheme for rocks in the three area5 studied.HYDROLOGIC SURVEYTemperature, pH and flow measurements were made at the known majorthermal vents at the beginning and ena of the summer field season.Samples of the discharge water were taken at both times to detectchanges that may occur due to mixing of thermal waters with shallow4-*-------------------
Imeteor1c waters 10 the hydrolog1c systems.~A profound decrease insurface flow of the Hot Springs Creek drainage system was observed fromlate spring to late summer. At Horse Creek and Owl Creek surface flowdid decrease, but not as much.Temperature, pH measurements and water samples for chemicalanalysis were taken at several nonthermal springs in the area (Figure1). These sites were only visited once in early July, 1981.The first set of pH measurements were made with a pH meter. Latermeasurements were made with "La Ion" pH test paper with a precision ofi !O.25 pH units. Conductivities were measured at Big Creek Hot Springsand Owl Creek Hot Springs. Temperatures were measured ~/ith a pocket: thermometer. Flow discharge \'/as determined by measuring the fillingtime of containers of known volume.GEOCHEMICAL SURVEYThe geochemical survey of the area included the three thermalspring systems, meteoric springs in the same catchment basins as thethermal springs and springs in the region between and around thethermal spring sites. Water samples were acidified to pH
The pH of the thermal vents was consistently higher (8.0-8.5) thanthe pH of local surface waters (6.S-7.5). This, along with distinctivebacterial and algal growth that occurred in the mineral-rich waters,. was an aid in prospecting for additional thermal vents. These twoconditions were observed even when the discharge temperature of thevents was near the temperature of nonthermal spring vents.The concentrations of the various cations and silica determined by. the analysis were used in the application of the Na/K,Na/K/Ca, NaILi,Li and Si02 geothermometers. The results are used to estimate thetemperature of the last water/rock equilibrium in the geothermal'reservoir. These temperatures can be used, in conjunction with theestimated geothermal gradient, to determine the depth of circulation ofwater in the three geothermal systems. Models for mixing with localmeteoric water can also be constructed by application of theconcentration data.PREVIOUS INVESTIGATIONSThe first mention of the area in the geOlogic literature is byLindgren (1904). Umpleby (1913) provided the first detaileddescription of rocks in the Big Creek Hot Springs area. Reconnaissancein various parts of the region surrounding Big Creek Hot Springs hasbeen done by Weis et al. (1972), Cater et al. (1973), Bennett (1977),and a detailed study of an 80 square mile area centered around Big.Creek Hot Springs was pUblished by Maley (1974).Lindgren (1904) and Umpleby (1913) mention the presence of hotsprings at Horse Creek and Hot Springs Creek. At Horse Creek, Lindgrenmade specific reference to the hot spring vent site along Horse Creek6
and to another site approximately 1 km down stream. The second site isalong a small tributary to Horse Creek named in this report as LindgrenCreek. Horse Creek as well as Owl Creek and Hot Springs Creek thermalsprings are noted by name in the first comprehensive listing of thermal,springs in the United States (Stearns et al., 1937). Waring (1965) andRoss (1971) mention Big Creek Hot Springs and Owl Creek Hot Springs. Adetailed physical and chemical description of Big Creek Hot Springs wasfirst provided by Young and Mitchell (1973). Further chemical data: were published by Robertson et al., (1976). Reservoir temperatures andestimates for reservoir volume a~d thermal energy content are given byMuffler (1979) for Big Creek Hot Springs and Owl Creek Hot Springs.The most detailed description of the geology and chemistry of Big CreekHot Springs to date is a study by Struhsacker (1981) on the feasibilitylof geothermal power generation at the site. Republic GeothermalCorporation (1981) has also done preliminary investigations at the BigCreek Hot Springs geothermal site. Young (1985) published detailedchemical and isotopic analysis of thermal springs in central Idahoincluding the three selected in this study. There has been no detailedgeologic information published on Owl CreeK or Horse Creek Hot Springs.7
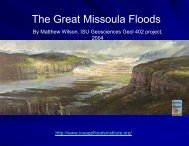
:Explanation of Symbols for Figure 2.0, Tb basalt, rhyolite and valley-fill younger than the IdahoBatholithEvEocene Challis and Lowland Creek volcanicsTiEocene epizonal plutonsKM,PPcCretaceous granite, Cretaceous granodiorite, Mesozoicquartz diorite, trondhjemite and plagiograniteMesozoic and Paleozoic country rocks older than the IdahoBatholithPrecambrian Belt and Pre-Belt quartzite, argillite, gneissand metasedimentary rocksedge of thrust plate or thrust zone--sawteeth on upperpl atemylonite zone along east border of Bitterroot DomeTIDTrans Idaho DiscontinuityTeFStrans Challis fault systemFault9,11 ....1IiiIIII...~ __
111° 1140 IISo,..........-----"-----------.l:'!-7-----...----'I'.....:....------~470NTbQQo !l0I , I tL.....--------- KILOMETERS~.:.=::..;.;;.::.......:..:..:...:....L 430Figure 2 Geologic setting of the Shoup Geothermal Area (modifiedfrom Hyndman, 1983, and Ruppel and Lopez, 1984). Seepage 9 for explanation of symbols.10
North of the batholith are mildly metamorphosed rocks of theBelt Series. To the south, the batholith is bordered by theIvolcanic rocks of the Snake River Plain.To the west, lies a~omplexof sediments and volcanics of an eugeosynclinal subductionItomplex accrued terrains and basalt flows of the ColumbiaPlateau.East of the batholith are a series of thrust sheets,while to the northeast lies the Sapphire Tectonic Block which wasaetached from the Bitterroot Dome (Hyndman,1980) (Figure 2). Therea studied is autochthonous terrain from which the MedicineLodge Thrust Plate was detached (Ruppel and Lopez, 1984).GEOLOGIC HISTORYj :PRECANBRI ANEVENTSThe oldest rocks in the area are the metasediments of thekellow Jacket Formation which is 5,200 m thick (Hahn and Hughes,i984) and an associated quartz-feldspar-biotite gneiss. During, ccumulation of the sediments that formed the Yellow JacketFormation, volcanic rocks were deposited in 1000 m of strata,beginning at the 3000 m level of the section. These volcanics;ldve been dated at 1.7 B.Y. (Hahn and Hughes, 1984).Adamellitelutons in the upper portion of the Yellow Jacket Formation in theI Salmon and Leesburg quadrangles have been dated at 1.4 to 1.5B.y. (Zartman, 1980).After deposition, the sediments underwent two Precambrianlectonic events. The first was deform~tion with the synkinematicdntrusion of adamellite plutons.This event produced large11
isoclinal folds with a well-developed axial plane schistosity· (Greenwood and Morrison, 1973; Maley, 1974).The first event may be due to an intracratonic branching riftlsystem that developed 1.5 B.Y. ago (Sears and Price, 1978; Burkeand Dewey, 1973). One of the branching rifts initiated theformation of a subsiding Belt Basin (Harrison et al., 1974;· Reynolds, 1984; Cressman, 1984). The beginning of subsidence ofthe Belt Basin at 1.5 B.Y. is in accord with the 1.5 B.Y. age of· the basal Belt rocks (Obradovich et al., 1984), and the extremethickness (23,000 m) of the Beltian sediments as they collected inan intracratonic setting. Two other phases of rifting are thoughti to have occurred 850 M.Y. ago and in the early Paleozoic (Lopez,1981) .Another possible mechanism responsible for the first event(and subsequent events) is movement along regional transcurrentshear zones such as the TID (Yates, 1968; Harrison et al., 1974;Pitz and Thiessen, 1986) and the northeast trending (Figure 2)TCFS (Bennett and Knowles, 1986; Kiilsgaard and Lewis, 1986;Bennett, 1986). Motion along these zones has been dated to thePrecambrian with recurrent activity to the present (Ruppel, 1982;Kiilsgaard and Lewis, 1986).The second Precambrian event is dated from 700 to 800H.Y. ago (Greenwood and Morrison, 1973; Harrison, 1972). Theschistosity of this event is nearly p~rallel to that of the firsteventand crenulations were formed on the first event schistosity(Maley, 1974). In addition to the previous possible causes, this12
~ventmay be related to the East Kootenay Orogeny that terminateddeposition in the Belt Basin (Harrison et al., 1974).MESOZOIC EVENTS~soclinalThe third deformation event is of uncertain age.folds were developed which folded second-eventlineations (Maley, 1974).boudinage.The event was characterized byLargeIt may be a continuation of the second event, or maype related to the intrusion of the Idaho batholith.The Idaho batholith was intruded during mid-Cretaceous time,approximately 100 M.Y. ago (Kulp, 1969).Biotite from an outcropin the Shoup quadrangle has been dated by Hyndman (1983) at 95H.Y. ago.The intrusion of the Bitteroot Lobe may have beencontrolled, on its southern margin, by the TID (Figure 2) (Pitzand Thiessen, 1986).During late-Cretaceous time thrust faulting took place andthe Sapphire Tectonic Block (Hyndman, 1980), the GrasshopperThrust Plate, and the Medicine Lodge Thrust Plate (Ruppel andLopez, 1984) became detached and were transported eastward.76 M.Y. ago these thrust blocks were in their present positions.TERTIARY EVENTSActivity in the Tertiary has been dominated by the twotranscurrent shear zones.Motions along both the TID and rCFS are~eft lateral with observed displacement of 29 and 2.9 km,,respectively (Pitz and Thiessen, 1986; Kiilgaard and Lewis, 1986).[his motion contributes to the strongly extensional regime thathas existed in the area since the Eocene (Bennett, 1986).13By
Epizonal granitic plutons and the Challis volcanics were emplacedat this time; both are located adjacent to the TCFS (Figure 2)(Bennett and Knowles, 1986). Eocene epizonal plutons are alsoassociated with the TID (Figure 2).The quartz monzonite which composes the Painted Rocks Lakepluton was intruded during Eocene time. Daniel and Berg (1931)obtained dates at about 51 M.Y. ago from the southeast corner ofthe pluton. The Bighorn Crags pluton to the west of Hot SpringsCreek and the Leesburg stock to the east have been dated at 44-48M.Y. ago (Cater et al .• 1973, and Bennett, 1977).In late-Oligocene (27 H.Y.) extensive block faulting.trending northwest, northeast and east, began in the Beaver HeadMountains and the Lemhi Range to the southeast of the study area(Ruppel, 1982). These faults which terminate against the TCFS(Bennett, 1986) could possibly be reactivated Precambrianstructures. Bennett interprets the TCFS as the transition zone inwhich northeast trending faults give way to younger (overprinting)northwest trending faults to the southeast. In the area studiedfracture sets trend northwest. east and northeast. Major faultsalong Hot Springs Creek and Pine Creek (Maley, 1974) have largedisplacements, bringing into contact rocks of dissimilar type andstructural history; they display signs of recent activity.14
III. PETROLOGIC SURVEYINTRODUCTIONThe rocks in the area studied include metamorphosed Beltand/or Pre-Belt metasedimentary rocks, Tertiary plutonic intrusiverocks and middle to late Tertiary dikes. The microscopic andmacroscopic character of each of the major rock types isdescribed, along with possible petrogenetic interpretations. Thevisually estimated modal compositions of major rock units aretabulated in Tables 1, 2 and 3.The classification of the igneous rocks is based on the modalcomposition and follows I.U.G.S. recommendations (Streckeisen,·1976). However, the term "quartz monzonite" will be applied to,rocks with 5 to 20 percent free quartz, while rocks with greaterthan 20 percent free quartz will be referred to as "adamellites"(H ugh es, 1982).METAMORPHIC ROCKSThe metamorphic rock dominant and ubiquitous in all threelocalities studied is an orthogenetic augen gneiss (Maley, 1984;Greenwood and Morrison, 1973).This unit is intrusive intoquartz-feldspar-biotite gneiss at Owl Creek and Hot Springs.Creek. The remaining major metamorphic rock types in the studyarea are quartz biotite schist at Owl Creek and a quartzite memberof the YelloH Jacket Formation at Hot Springs Creek (Maley, 1974;Bennett, 1977). Minor amphibolites, quartz feldspathic pegmatitesand carbonate rich dikes are associated with the augen gneiss andthe quartz-feldspar-biotite gneiss.15
.......,., ,">- •..-....._*'" -.~"'" ..-__ ",,"-..L;an' __ __....,"SAY'."""' _ --.au Ll!5 ... __•~I.. 1i.:ltlflrr771!Jrr-·orr~rrr_T· , ,'_z"'Qlr\-'ilffinMyt",;,c'jf"'!""]lIr 1 ~-_',':r,'_' -":::.;:;;;;2 & & Z£4L3L2 sa _iiL::flWl I"f[!!!1[WW1]I(tr""lfllibtt '!fl]I9LSCe:er rFLiiJllelsSiI'LTable 1.Visually Estimated Modal Composition of Major PrecambrianMetamorphic Units in the Shoup Geothermal Area.Quartz-Microcline Fe 1dspar- Quartz Biotite Quartzite of theAugen Augen Biotite- Schist Yellow Jacket FormationGneiss Gneiss Gneiss Norma 1 Metasomatic Quartzite ~lliteQuartz 15-25% 18% 25-50r. 70r. 42% 75% 45%20% Avg.Microcline 20-60% 57% 0-5% - 3%40% Avg.~Plagioclase 10-50% 18% 25-30% 1% 10% 2% 3%0" " 30% Avg.Biotite 5-8% 5% 5-15% 15% 27% 15% 25%5% Avg. 10% Avg.Muscovite 0-3% 2% 2-10% 10% . 17% 8% 25%2% Avg. 2% Avg.Minor Zircon Zircon , Opaqu es -4% Opaques-1% Zircon Garnet-2%Minerals Apat ite Apat ite EpidoteEpidote Epidote ApatiteOpaques Sphene OpaquesOpaques-1%
IIiAUGEN GNEISSThe modal composition of the augen gneiss is listed in,Table 1. Microcline is the prominent K-feldspar; it forms largeimegacrysts that are the dominant feature of this rock. The augens'range in size from 1 to 15 cm (the largest occur at Hot Springs.Creek). most being 1 to 4 cm in size. The microcline augens are'commonly rimmed by oligoclase.iPlagioclase composition rangesifrom albite to oligoclase (An4-An25). occurring as lenticular,xenoblastic porphyroblasts up to 1 cm in length that occasionallyform small augens. Both micas (biotite and muscovite) tend towrap around the feldspar augen. Gneissic bands are 1 to 5 mmthick.The matrix consists of quartz. K-feldspar. plagioclase.,biotite and muscovite. Xenoblastic grains of quartz, K-feldspar,and plagioclase produce a granoblastic texture. Mortar andgranulated zones are well-developed around the edges of microclineporphyroblasts. Undulose quartz extinction and bent plagioclasetwin lamellae also indicate cataclasis.The augen gneiss at Owl Creek is in contact with the~uartz-feldspar-biotite gneiss and the quartz biotite schist.[here are two distinct members of the augen gneiss unit present inthe Owl Creek area. The augen gneiss unit on the southern marginOwl Creek study area will be termed the microcline augenin this report. The augens (~ 1 cm) are composedexclusively of microcline; the rock is granitic in composition~ather than quartz monzonitic!adamellitic. The foliation is17
conformable with that of the Owl Creek quartz biotite schist. Thecontact zone (3-100 m thick) between these units is composed ofmigmatites representing lit-par-lit injection of quartzfeldspathic components of the augen gneiss into the quartz biotiteschist. The augen gneiss in the western, center and northernportions of the area mapped at Owl Creek is typical of the unit atHorse Creek and Hot Springs Creek. The augens range in size from1 to 8 cm and typically contain small microcline cores that arethickly mantled by oligoclase.Maley (1974) divided the augen gneiss in the Panther Creekarea into three units; two of which, augen gneiss and ellipsoidalgneiss, outcrop in the Hot Springs Creek study area. Thedifference between these units is not so much one of compositionas it is of texture. Microcline augens are larger (5 to 15 cm) inthe ellipsoidal gneiss; quartz and plagioclase crystals are up to1 cm in size. Some of the microcline augens are mantled witholigoclase that is much thicker (up to 5 mm) than those in theaugen gneiss.QUARTZ-FELDSPAR-BIOTITE GNEISSThe quartz-feldspar-biotite gneiss has been described byMaley (1974) at Hot Springs Creek and by Berg (1977) in Montana,just across the state line, adjacent to the Owl Creek drainage'basin. This unit is the oldest metamorphic rock in the area,studied and is highly deformed. This rock unit varies greatly incomposition (Table 1) probably reflecting variations incomposition of the argillaceous protolith.18
The quartz-feldspar-biotite gneiss is composed of bands of gneiss,biotite schist and biotite quartzite that vary in thickness from a fewmillimeters to several meters. A well developed granoblastic texturewith grain size ranging from 0.2 to 3 mm is present. Plagioclasecomposition ranges fromalbite/oligoclase to oligoclase (An10-An25).At Owl Creek the quartz-feldspar-biotite gneiss has limitedexposure, ranging from small pods a few meters across to an outcrop 500m across in the augen gneiss. The quartz-feldspar-biotite gneiss hasbeen thoroughly described by Maley (1974) in the Hot Springs Creekarea. It has been highly deformed and exhibits the wide compositionalvariability typical of this unit.QUARTZ BIOTITE SCHISTThe quartz biotite schist is similar in mineral portions to thequartz-feldspar-biotite gneiss (Table 1) and probably represents anunusually homogenous unit within the quartz-feldspar-biotite gneiss.It outcrops in one exposure in the Owl Creek area and is distinctiveenough to be classified as a separate unit. The quartz biotite schistis similar to the quartzitic schist described by Berg (1977),outcropping 22 km to the northeast in Montana. Similarities includeevidence for: 1) sodium metasomatism, enriching the rock inK-feldspar (Table 1); and 2) distinctive flexural slip folding. Thetexture is granoblastic with grain size consistently 0.5 mm.Plagioclase composition is oligoclase (AnI3).QUARTZITE MEMBER <strong>OF</strong> <strong>THE</strong> YELLOW JACKET' FORMATIONThis unit is in contact with the augen gneiss andquartz-feldspar-biotite gneiss across the Hot Springs Creek fault at19
. Hot Springs Creek. It has been described by Maley (1974) and. tentatively correlated with the quartzite member of the Yellow Jacket'Formation by Bennett (1977), Ruppel (1982), and others. The rocks arerelatively undeformed and have a different tectonic history than theadjacent quartz-feldspar-biotite gneiss, across the Hot Springs Creekfault. In the Hot Springs Creek area this unit is a dark graymicaceous quartzite with phyllite layers (Maley, 1974). The modalcomposition is tabulated in Table 1. The rock has a granoblastictexture and a grain size varying from 0.1 to 0.3 mm. In the thinphyllitic layers rotational flowage of micas around garnets has createdpressure shadows. The quartzite contacts the ellipsoidal gneissparallel to the foliation of both units. The contact zone is sharp andnarrow with little sign of metasomatism.AMPHIBOLITEAt Horse Creek the amphibolite occurs as a dike 1 m in thickness,crosscutting the foliation of the augen gneiss. At Owl Creek it occursas a thin, sill-like body in discontinuous pods along the foliation ofthe augen gneiss. Maley (1974) describes the amphibolite at HotSprings Creek as sill-like bodies in the quartz-feldspar-biotite gneissand the dark gray micaceous quartzite. The foliation in theamphibolites at Owl Creek and Horse Creek is parallel to that of theenclosing metamorphic country rocks.The strongly foliated amphibolite dike at Horse Creek istechnically a hornblende schist and composed of 80 percent greenhornblende, 10 percent andesine (An33), 5 percent epidote, 3 percentbiotite, 1 percent opaques and minor quartz. The foliated amphibolite20
at Owl Creek is composed of 45 percent green hornblende, 40 percentandesine (An30), 10 percent augite, 4 percent opaques and minor biotiteand quartz.CARBONATE-RICH DIKESSmall outcrops of calcite-rich dikes, 0.5 m wide and 10 to 20 mlong, were found at Horse Creek and Hot Springs Creek.At Horse Creek the rock is composed of 30 percent calcite, 45percent plagioclase, 20 percent epidote, and 5 percent opaques. Theplagioclase is normally zoned labradorite-andesine (An61-An52). Thecalcite is idioblastic; some crystals have epidote cores. Crystal sizeis from 0.2 to 0.4 mm.At Hot Springs Creek the dikes are composed of 8 percent calcite,58 percent plagioclase, 20 percent alkali amphibole, 8 percent epidote,5 percent hornblende, and 1 percent opaques. The plagioclase isfine-grained (0.1 mm), as is the epidote which also forms 0.5 mmphenocrysts that make up 4 percent of the rock volume.PETROGENESIS <strong>OF</strong> <strong>THE</strong> METAMORPHIC ROCKS! AUGEN GNEISSThe evidence for the igneous origin of the matrix of the augengneiss (Greenwood and Morrison, 1973; Maley, 1974) includes thefollowing: 1) the contact with other rock types is sharp and oftencrosscutting; 2) the augen gneiss contains rotated xenoliths ofadjacent host rocks;3) there is no variation in the composition dueto wall rock interactions (not true at Owl Creek); 4) the zirconscontained in the augen gneiss are simple and sharply faceted incontrast to rounded zircons found in the associated metasediments.21
iROCKS <strong>OF</strong> <strong>THE</strong> YELLOW JACKET FORMATIONThe quartz-feldspar-biotite gneiss. quartzite member of the YellowJacket Formation and the quartz biotit~ schist at Owl Creek are verysimilar in composition and may represent different metamorphic grddesof the same sedimentary unit. Bennett (1977). Berg (1977) and Hahn andHughes (1984). assign the quartzitic rocks exposed in the study area tothe Yellow Jacket Formation.PThe Yellow Jacket Formation has been tentatively correlated withthe Prichard Formation of the northern Idaho Belt Basin (Ruppel. 1975;Evans and Lund, 19B1). However, Armstrong (1975) believes that themetasedimentary rocks of the Yellow Jacket Formation are part of thebasement upon which the Beltian rocks were deposited. The areadescribed as the Salmon River Arch was topographically positive andserved both as the southern margin of the Belt Basin and as a source ofdetritus for the Belt. A similar role for the Salmon River Arch hasalso been suggested by Harrison et al., (1974). Hahn and Hughes (1984)have dated volcanics in the upper level of the Yellow Jacket Formationat 1.7 to 1.8 B.Y., providing strong evidence that the Yellow JacketFormation is Pre-Belt.However, direct proof that the Prichard and the Yellow Jacketcannot be correlated is difficult if not impossible to obtain. TheBitterroot Lobe of the Idaho batholith has intruded the contact betweenBeltian rocks in northern Idaho and metasedimentary rocks ineast-central Idaho. The Big Hole region of western Montana may be an22
area of contact, but Cenozoic thrust faulting has complicated thegeology of the region.Two grades of metamorphism are seen in the area. Maley (1974)thought the quartzite unit south of the Hot Springs Creek faultunderwent upper greenschist metamorphism, whereas the quartz-feldsparbiotitegneiss and augen gneiss units north of the fault haveexperienced at least amphibolite-grade metamorphism.AMPHIBOLITEThe amphibolites appear as small discontinuous sills anddikes with moderate to strong foliation that is parallel to thefoliation of the enclosing country rock. These are probablyortho-amphibo1ites derived from mafic intrusions into the augen gneissand metasediments that were subsequently metamorphosed with the countryrock.CARBONATE-RICH DIKESAn extensive carbonatite district, located 32 km east of the studyarea, extends from Deep Creek in Ravalli County, Montana to near NorthFork in Lemhi County, Idaho (Heinrich, 1966). Maley (1974) describes acalcite-rich (15 percent) hornblende diorite located near theconfluence of Pine Creek and the Salmon River. Carbonatites in theBeaver Creek and Sheep Creek drainage basins, 8 km east of the HorseCreek study area, intrude amphibo1ites adjacent to the augen gneiss(Crowley, 1960). Crowley believes the carbonatites formed fromcarbonate-rich units located in the sedimentary pile that underwentalteration by intrusion of basic magmas and subsequent metamorphism. A23
carbonate-rich dike found at Horse Creek was within 200 m of the onlyoutcrop of amphibolite found at Horse Creek.TERTIARY INTRUSIVE ROCKSIntrusive igneous rocks underlie most of the Horse Creek study,area. The northern portion of the Horse Creek area is underlain by a,portion of the Painted Rocks Lake pluton (Lund &Benham. 1984). At OwlCreek and Hot Springs Creek igneous dikes have intruded thequartz-feldspar-biotite gneiss and the augen gneiss. There are alsodikes in the augen gneiss and the Painted Rocks Lake pluton at Horse,Creek.<strong>THE</strong> PAINTED ROCKS LAKE PLUTON ATHORSE CREEKThe Painted Rocks Lake pluton at Horse Creek can be divided intothree units. The first and largest in areal extent is coarse-grained.massive. and poorly foliated. The second unit which is synp1utonic, with the first. is very similar in composition. but much finer grained;it exhibits no foliation and intrudes the first unit and adjacent augen\ gneiss. The third unit has undergone cataclasis and exists solely atthe contact between the Painted Rocks Lake pluton and the augen gneiss.Com~ositiona1ly the three units are similar (Table 2). rangingfrom a quartz monzonite to an adamellite. In this report the firstunit is termed the main body. the second the microgranite. and thethird the catac1astic zone. The main body and microgranite exhibitmiaro1itic cavities that are common in the Tertiary epizona1 plutons ofthe Bitterroot Lobe of the Idaho batholith (Bennett, 1980; Hyndman,1983).24
In the main body, plagioclase has the composition of oligoclase( An 16) and shows brittle displacement of twins along microfractures.The quartz has undulose extinction and also exhibits fine fractures.The microcline forms crystals up to 3 cm in length that align to formfoliation near contacts with quartz latite dikes and the cataclasticzone. Deeper into the main body foliation is poorly developed andtexture is massive.The microgranite occurs as dikes in the augen gneiss and quartzmonzonite main body that range from 2 to 10 m in width and a fewhundred meters in length. In the quartz monzonite there are muchlarger dikes of the microgranite, up to 1.7 km long and 500 mwide.Contacts between the microgranite and the host quartz monzonite areinterlocking and, on a microscopic scale, transitional. Miaroliticcavities are ubiquitous in all exposures.The contact between the augen gneiss and the main body has beenintruded by microgranite. Adjacent to the augen gneiss, microgranitehas undergone cataclasis. The cataclastic zone ranges from 20 to 100 min width. Exact determination of the extent of the zone was difficultas it outcrops on the north slope of the southern side of the HorseCreek drainage and is, in many places, covered with soil andvegetation. In the area upslope from the primary hot springs vent, thecataclastic zone is heavily altered and contains abundant dark gray~ sulfide mineralization.The cataclastic zone exhibits greater compositional variation thanthe quartz monzonite or microgranite. Consequently, two specimens25
Table 2.Visually Estimated Modal Composition of Major Unitsin the Tertiary Painted Rocks Lake Pluton.CataclasticMainBodyMicroGraniteZoneCZ-l CZ-2Quartz 20% 30% 15% 50%Microcline 35% 30% 36% 22%Plagioclase 32% 35% 45% 26%Biotite 9% 3% 1%Opaques 2% 2% 2% 1%Minor Epidote-l% Hematite Flu or ite-l% Ch lor iteMinerals Chlorite Chlorite EpidoteAllanite Zircon ZirconZircon Epidotefrom this zone. CZ-l and CZ-2, (Figure 6. Table 2) will be discussedseparately.texture.Cl-l has plagioclase with a very fine (0.01-0.02 mm), frothyThe grains of quartz, feldspar and biotite are all anhedral;typically larger grains are bordered by very fine crushed grains.fluorite is idioblastic. Sample CZ-l was taken near the contact withthe augen gneiss.In sample CI-2 quartz grains up to 1 cm in size are a distinctivefeature of the rock in outcrop.The grains tend to be rounded withcrushed quartz, epidote and alteration products between them.Plagioclase has the composition of oligoclase (AnI3) with twins showingductile deformation; most of the crystals are broken or crushed.Sample. CI-2, is from the same area of the cataclasis zone as CZ-l, butadjacent to the microgranite contact.26The
III. REGIONAL GEOLOGIC SETTING <strong>AND</strong> HISTORYGEOLOGIC SETTINGIiiII IIThe area studied in this investigation is on the northern flank ofIsoutheasf end of the "Salmon River Arch"(Figure 2) (Armstrong,75). The Salmon River Arch is a NW-trending zone of Pre-BeltItamorphic rOCkS that separates the Idaho batholith into theitterroot Lobe to the north and the Atlanta Lobe to the south(Hyndman, 1983).The study area is located adjacent to and 40 km west of theintersection of the Trans Idaho Oiscontinuity (TID) and trans Challisfault system (TCFS, Figure 2).These two transcurrent shear zones haveprobably been active since Precambrian time and significantlycontributed to the structural development of the area (Pitz andThiessen, 1986; Kiilsgaard and Lewis, 1986).Horse Creek is at the contact of the Eocene epizonal Painted RocksLake pluton with Pre-Belt metaigneous rocks (Lund &Benham, 1984) whichare ~xposed in the Salmon River Arch. Owl Creek and Hot Springs Creekare located deeper in the Arch in the Pre-Belt basement complex ofmetasedimen~aryand metaigneous rocks.The Bitterroot Lobe of the Idaho batholith and its surroundingenvelope of metamorphic rocks are in an area designated as theClearwater Orogenic Zone (Greenwood and Morrison, 1973). ThePrecambrian rocks in the study area are in the SE corner of the,Clearwater Drogenic Zone and are very similar in structural history andlithology to other parts of the zone.8
iii~[jinto the Tertiary rocks crystals are from 0.1 to 0.3 mm in size.'~uartz latitl dikes in the augen gneiss have crystals from 0.05 to 0.1Li, bm in size with a few plagioclase and epidote crystals up to 0.5 mm.I:;i ~I~Plagioclasecomposition in both is albite (An2).t!I';.iSpherulitic ,Quartz Latite. The spherulitic quartz latite (Table 3)~intrudes the quartz monzonite main body 2 km north~northwest of the:,11\~main body/augen gneiss contact. Crystal size is 0.5 mm, feldspars formiiI' ~laths up to 4 mm in length. Small spherules (0.2-0.4 mm) typicallyH!lhave orthocllase cores and albite (An2) rims that are radially~textured. ~ small percentage of the spherules have quartz cores that~areradiall)1 rimmed with orthoclase then albite.~(Quartz Lati~e Porphyry. The quartz latite porphyry (Table 3) intrudes~~the quartz Jonzonite and the augen gneiss. Porphyry dikes 5 to 50 m in'Iwidth crossdut the quartz latite dikes.~pOrPhyryinJrudes the western edge of the study area.A large plug of quartz latiteI I IPhenoclysts which account for 50 percent of the rock volume are!~largelY (70 Ipercent) orthoclase crystals up to 1 cm in length; some ofII~the orthoclase phenocrysts have albite (An]) cores. Quartz ranges inIIIJ.I]size from 2 to 4 mm, while epidote ranges from 1 to 4 mm.II'~porphyritic quartz latite exhibits abundant miarolitic cavities up to 5I:;Imm in diameter, unlike the quartz latite and the spherulitic quartzIII!!latite, whicch show few such cavities.iI'I~~ow 1 Creek, fji ,~ All but one of the dikes at Owl Creek are porphyritic dacitesiWhiCh intru1e the microcline augen gneiss and the biotite schist. One'(diorite dikl was observed to intrude the augen gneiss and~Thel~[,D~28
... ..,...--'0_= _~~ "=_~ _~_~_,..-.-= =~., ......,,,." '=.='=
:~,~I,i~uartz-felds~ar-biotite gneiss. The dikes are typically 5 to 10 m in~ I~idth and extend for long distances before pinching out.biorite. Ititor amounts of interstitial granophyre occur in the~ ,~iorite (Tab~e 3), which contains miarolitic cavities up to 5 mm in~ize. P1agirC1aSe (An62-An12) is normally zoned; crystal size ranges~rom0.3 to 0.7 mm.t~OrPhyritiC ~acite. Porphyritic dacite (Table 3) is the most co_n~ertiary int~usive rock at Owl Creek. Phenocrysts of plagioclase! IfAnll ) up tol5 mm in size make up 5 percent of the rock volume.'iFrystal sizel in the groundmass is uniformly 0.2 mm and small (0.2 to 1I~m) miarolit~c cavities are present.,H ot Spr i ngs Creek· 'I Only oni dike of significant linear extent was found in the area.ilt is 3 to 41 m thick and extends from the northeastern portion of the,~aparea to the Hot Springs Creek fault, 300 m upstream from the BigjI~ Ifreek Hot Sp~ings vent site (See Figure 4, Page 39). The dike is aI~uartzIlatiti porphyry (Table 3) with lath-like phenocrysts, up to 5 mmr n length, of oligoclase (An26) making up 5 percent of the rock volume.II~heImatrix ij 60 percent granophyre with a crystal size of 0.02 to~.04 mm. Ab~ndant miarolitic cavities, 0.2 to 1 mm in size, are present.II1! I PETROGENESIS <strong>OF</strong> <strong>THE</strong> TERTIARY INTRUSIVE ROCKS~UARTZ MON zo~ ITE MAIN BODY,! The Qua1tz monzonite main body is a Tertiary epizonal pluton with~nOrOgeniC o~ A-type characteristics (Bennett and Knowles, 1986). It~.~s part of a series of epizonal Tertiary intrusions that ring the)\]ere taceou s batholith (Figure 2).~~~ n,, 11, I,'30;lli~Ii
iII IIIIIiI!After the intrusion of the Cretaceous mesozonal to katazonalplutons, diapiric uprise of the Bitterroot Dome occurred followed bythe detachlent of the Sapphire Tectonic Block from the east flank ofthe infrastructure (Hyndman, 1980).Further isostatic uplift of theBitterroot Dome followed to compensate for the shift in crustalmass, this uplift created mylonite and shear zones which may havecontrolled the emplacement of the Eocene felsic rocks that followed.Shallow Eo~eneplutons are concentrated in a zone along the western andsouthern eJges of the Bitterroot Dome.The extensional regime thoughtto have existed in the area (Bennett, 1986) is typical of anorogenic\rocks originating from I-type crustal rocks, such as the main body ofthe Idaho Jatholith (Bennett and Knowles, 1986).The more extensiveChallis-LoJland Creek volcanics were erupted contemporaneously with theshallow emdlacement of these plutons. The theoretical depth ofgeneration of magma (25 km), and depth of emplacement andcrystallization (2 km) (Fyfe, 1973; Hyndman, 1981) indicate the magmawas generaJed as the'result of reheating of the previously intrudedCretaceous IIdaho batho 1i th.HI CROGRANIl!EIIIThe microgranite is late synplutonic with the quartz monzonitemain body. The compositional similarity and interlocking contactsindicate an identical source of the magma. During emplacement the areawas underg1ing NW-SE extension. The dominant trend of intrudedmiCrOgrani1e is NE, parallel to the trend of contact of the quartzmonzonite ~ain body with the augen gneiss. The microgranite containsmore and lJrger miarolitic cavities than the quartz monzonite.31
':IIII, I'I'[ATACLASTIC ZONEI, I!~ Cataclas~ic zones on the borders of plutons are cOITmon features inIir1Iii~JegiOnS that have been intruded by igneous bodies (Pitcher and Berger,'Ill j972 l . The cataclastic Izone between the quartz monzonite main body andlithe augen gneiss at Horse Creek is of the type termed "protoclasis"j:'"l(Higgins, 1971), which is produced by late movements of an igneous body'f:Ibefore it ha~ completely crystallized. Some crystallization musti~ccur during]or even slightly after the protoclastic deformation. The~~icroscopic~mineralization, ~!,i~iJ 'i,i:;appearance of the rocks from the cataclastic zone exhibits'~he classic lppearance of protoclasis. Mineral grains are fractured! I,~nd crushed ~ut interstitial fluids were still present to recrystallizeIiIrartiallY granulated, solid components.'I The prelence of fluorite and the frothy texture in the Cl-1 sampleliS probably ~ue to a stage of activity later than the formation of theI~rotoclasticl zone.'lmagma body. ~heIn the later stages of the solidification of apercentage of the lolati Ie components present in theIresidual mell increase (Burnham, 1979).At depths of 1 km or less, the11'Imelt may become metastable with the equilibrium state being crystals,~and vapor (~hitney, 1975). At this point the vapor will tend to find al!path to the Isurface by either fracturing the carapace over thefintrusion o~ by following previously generated fracture systems. In~thecase of Horse Creek, the protoclastic border zone was available as,ija conduit. IThe area in which the volatiles traveled was in the mostlI 'Irhighly frac~ured portion of the border zone.IThe brecciation and(fluorite) is typical of this type of activity.32
i'?, UARTZ LATITE I DIKESI! The quartz latite dikes are compositionally similar to the quartz~~nzonite mai~ body. The dikes were intruded after the microgranite,~11 Ibut the main body had still not comp'letely solidified. On the westiii'~~;ideIof the Hprse Creek study area the quartz monzonite main bodylXhibits folibtion that is bent parallel to the contact withIOrPhyritic q~artz latite dikes.I'I The quar~zlatite and spherulitic quartz latite were intruded!~ ~uring NW extension, as were the main body and microgranite. TheIidpherulitic quartz latite. microgranite, and most of the quartz latiteIlikes trend ~E, as does the contact of the microgranite and main bodyIII!iiith the augrgneiss.During intrusion of the quartz latites attransition to E-NE extension occurred. Some of the quartz latite dikes~~ I,have a N-NW tlrend and the large porphyritic quartz latite dikes exhibit"! ,11 I.'N-NW trends excluslvely. Bennett (1984) indicates that in the studyf; I'~,;rea (adjaCenllt to the trans Challis fault system) Eocene NW extension! r:I 'fhanged to Nfl extension in the Oligocene. This, and the fact that theyI~rosscutI 1 1il1Ithelquartz latite dikes, indicates that quartz latite porphyryrikes are thj youngest intrusions in the area.~ The abs~nce of miarolitic cavities in the quartz latite and theI'I~pherulitic ~uartz latite and their presence in the porphyritic quartzillatite indictte different conditions of emplacement.The porphyriticI~uartz latit~ appears to have been intruded at a shallower depth, orU I '"iintruded dUrrng later stages of the event and sUbsequently contained an~ppreciably greater amount of volatiles.'e~ !~.~i:l~ i~!1, ~ 33, I'
I11III1IIIII'1\, DIKES!AT OWL CREEK <strong>AND</strong> <strong>HOT</strong> <strong>SPRING</strong>S CREEKThe diOfl ite dike and porphyritic dacite dikes at Owl Creek and the'!Creek, moderate density at Owl Creek, and low density at Hot Springs,~:111[:1(1iw~uartzlatiteporphyry dike at Hot Springs Creek exhibit the samelof shallow epizonal intrusion {i.e. miarolitic cavities} as'~vidence,11,11~jthe Tertiary intrusions at Horse Creek. Berg (1977), Bennett (1977),~~!1\;and Maley {1974} describe dikes of felsic composition throughout theI,area. All view 1 the dikes as being the youngest rocks in the area. TheI~~dikes~1,~Tertiaryobserved at Owl Creek and Hot Springs Creek pr6bably reflectintl1rusive activity. The trend of high dike density at Horse~,Ii rjCreek may be a reflection of increasing distance from the site ofij~Tertiary~~iti'~I!'iI~~ij~ii~!~ii, l 1~~I il, f'r ~~'I~~:~,~[1, I'~~K~Ij11I ,11 ]1intrusive activity.34
~ ~IiIi!j~l!'!~r1 IV. STRUCTURAL <strong>GEOLOGY</strong>I i I Fie1dmeasu re me nts of th:N:::::uC:::Nof ma jor and mi nor st ru ctureswere carri+ out to fu lly defi ne the phys i ca 1 nature of thehYdrothermall systems, for each of the areas studied.Major structuresi include faults, shear zones and contacts. Minor structures include~j~ foliation, lineations of various types, fracture cleavage and joints.I~IJ A geologic map of the Shoup Geothermal Area is shown in Figure 3. Thedistributi1n of rock types, major structures, and the trend of tectonici ~ fabrics fo~ Hot Springs Creek, Owl Creek and Horse Creek are shown in~ Figures 4, 5 and 6. Detailed maps of the vent sites and related rock.~I types and s(ructures are sho'lJn in Figures 7,8,9, and 10.'I The a1ea studied is on the southeast margin of the ClearwaterI Orogenic Belt (Greenwood and Morrison, 1973) and bounded by the TID and:! rCFS to thJ north and south respectively (Figure 2). Maley (1974), assumes thfee periods of deformation in the Panther Creek area:'J.....,:•...1) The first event is characterized by synkinematic intrusion of~ augen gneiss, development of a pervasive first event foliation,.IJ and i50cl inal folding.il 2) The stcond deformation was marked by a foliation which is nearII ,R parallel to the first event foliation. Lineations are representedIi,!I il pass;l e flow folds. North of the Hot Springs Creek faultI Iby crLulations on the first event foliation, boudins and small
KEY TO FIGURES 3-10Valley Fill ] - QuaternaryEpizonal intrusivesQuartz latite porphyrySpherulitic quartz latiteQuartz latiteCataclastic microgranite - TertiaryMicrograniteQuartz monzoniteDioriteDac ite porphyryPeiPeeoPeamPcogPemagPeeoQPemgPeyuPcbsPebgIntrusivesCarbonate rich dikesAmphiboliteAugen gneissMicrocline augen gneissEllipsoidal augen gneissMigmatite zoneYellow jacket formationBiotite schistQuartz-feldspar-biotite-gneiss- Precambri an36
SYMBOLS FOR FIGURES 3-10Strike and dip of foliationTrend and plunge of lineationStrike and dip of jointStrike of vertical joint;60Horizontal jointStrike and dip of fracture cleavageDip slip faultStrike slip faults,ZMinor fold vergenceFracture zone (altered when shaded)Cataclastic zone (altered when shaded). 'Alteration zoneOutcrop of dikes37
..~II"~I30' 25' 20'NI! IiIiIITiPcagPeboPeiI(II~'l1'1...!~o )~o, _ -' ....Q'l1'~lPelI ~I';:-"'1"'0'oJI25'20'PcyuPebgo I 2 3 4 5L....-' • I I ISCALE IN KILO"'ETERSFigure 3 Geologic map of the Shoup Geothermal Area (modified fromcpmpilations by Maley, 1974;'Bennett, 1977; Berg, 1977; Hahnand Hughes, 1984; and the author). See pages 36 and 37fbr explanation ofsymbols~10I38
!Pcog~2.y2!1Pcypcbg /7!111r-rnV!l147 J\ e!l!l0fAr--' 70.1IPcog'------o , 500~METERS~L.---L..o'---l..----"'-.;--_..IL.1._.........._-'"Figure 4 Geologic map of the Big Creek Hot Springs study area.pages 36 and 37 for explanation of symbols.See39
NIi, IPcagTd(Jl •oNo• o zZ4~ \"10 S~ ~II10../' ;14 ~_ .PcbsPcbso '00....... ' ----L_~--L...---L____I'METERSFigure 5 Geologic map of Owl Creek Hot Springs study area.36 and 37 for explanation of symbols.See pages40
I / i/ I!.!1/ 114 0 ITqlp...Ulo(IIo. Ii'i!~a, , , ,I sao1 ,;i!METERS!, ~.1 figure 6 GeJlogic map of Hors~ Creek Hot Springs study area.Ii36 and 37 for explanation of symbols:iSee pagesI41Ii",:,' ]".~, i1~ :'
1NPcbg r:'Lx 6x 10fI • 3~••xII • j .r~r 13:'''l~.~.-1S3 -. -. ..Pcbg. . . ll5-FRACTUREZONE<strong>HOT</strong> <strong>SPRING</strong>S CREEKFAULTxlU~.II74 y~.o 5 10 15 20I I '....J...JMETERSII ~ENT WITH FLOW > 1 LITER/MINI SAMPLED NUMBERS 1- 16• ~ENT WITH FLOW < I L1TER/MIr4_ ... - MARGIN <strong>OF</strong> FRACTURE ZONEFigure 7 Geologic map of Big Creek Hot Springs thermal vent site. SeeRages 36 and 37 for explanation of symbols.42I'i ·1I!ll:
NII16 x\\\\IFRACTUREZONEPcogIIIIIII/IIIII"1;~.,I 7~·~2 ,'~I174J1r7 ~.\ n\\\\Pcogo 10 20 30 40 50I ,, I , ,METERSII SAMPLED VENT SITE. NUMBERED 1-6• SEEP pH 8.4 TEMP 48.5 0 C.-.-' EDGE <strong>OF</strong> FRACTURE ZONElogic m~p of Owl Creek Hot Springs thermal vent site. Seeges 36 and 37 for explanation of symbols.43
",,;1!ii~ Ii:j:]f!!iiI :li" [1!' ,.-----+----r------------------------...,I ITqmI ~I'~~ FRACTURE ZONE'm1x I~I~ ,;IiI' ",11I(jnI:lJI1>1~.j.I~_ ..................... 14184~'4 /NV/./",/'//",/.,/..,// Tqm",/./",",/'o,I, . 2 5 x / SAMPLED VENTS NUMBERS I <strong>AND</strong> 2~dE~S' , ...... ~ EDGE <strong>OF</strong> FRACTURE. ZONE.".." TREND<strong>OF</strong> FRACTURES ACTING AS VENTS1 9 Ge logic map of Horse Creek thermal vent site, Horse CreekHo~ Springs (HC-I). See pages 36 and 37 for explanation ofsymbols.44
NTqlpfrI ../ ....~(, ,x 6 ,IIIII.!{ 5 IIIIIIII/, ,..( FRACTUREI• IIII Tqm\\\\\X2/U \113 \\\ZONETqm,!I~::i "1:1~,ljII I:1 'j':1 Figure 10ii I~';1Ii::1 ~il11iME TERSGeologic map of Lindgren Creek thermal vent site, Horse CreekHot Springs (HC-2). See pages 36 and 37 for explanation ofsymbol s.45xSAMPLED VENT WITH FLOW> 5 I/MIN-NUMBERED 1-6VENT WITH FLOW < 51/MIN_ - EOGE <strong>OF</strong> FRACTUREO Tqm~
Ilineati~ns• I1S Ilort heast.ltrend north to northwest;the trend south of the faultIi 3) The thi~d event was characterized by boudinage. Maley suggestsl]~JI~ that th~ third event may be a continuation of the second event, or11I!I'may be ~elated to the intrusion of the Idaho batholith.IiI~i'11 DISTRIBUTION <strong>OF</strong> ROCK TYPESr!. t]<strong>HOT</strong> SPIUNGS CREEK:i ;it! At Hot Springs Creek (Figure 4) high grade metamorphic gneisses,I]are in contalct with lower grade quartzites and augen gneiss across theI IHot Springs ~reek fault. South of the fault the ellipsoidal augen~,
GEOMETRICAL ANALYSISField jeasurements were made of the attitudes of foliation,, lineations (crenulations, minor fold axes and minerals), fractures,, joints, dik~S and contacts. The number of measurements of each featurefor each of the areas studied is shown on Table 4. A total of 980measurements of structural features were recorded in the areasstudied.TreSe measurements were plotted on a Schmidt equal area netand then cortoured to show preferred orientation (Figures 16-23,Appendix A) IEach of the areas studied has been treated separately.HotSprings crerlk has been divided into domains north and south across theHot Springs Creek fault.Owl Creek is divided into the northeast,westand southeast with Owl Creek and the east fork of Owl Creek, I 'serving as boundaries.Each area has distinct lithology and minorvariations fn structural style. Horse Creek is divided into north andsouth (the Painted Rocks Lake pluton and augen gneiss, respectively).DEFORMATIONAL HISTORY:DUCTILE <strong>AND</strong>EFFECT <strong>OF</strong> ANISOTROPY ONBRITTLE FIELDSINTRODUCTIONThe qUrrtz-feldspar-biotite gneiss, quartzite member of the YellowJacket Formation, and the quartz biotite schist at Owl Creek mayrepresent different metamorphic grades of the same sedimentary unit.The first deformational event i~printedtectonite fabric withorthorhombic symmetry on the rocks; the extent to which this fabric isdeveloped is directly proportional to the metamorphic grade and amount:r 47~.I~
1iijii!:I:I,i"1Table 4.~111Structural field data, 980 measurements.Number off; Area Feature Sub Area Measurements:1'~Hot Springs Creek Foliation South 25~Hot Springs Creek Foliation North 60'i1 Hot Springs Creek . Crenulation South 9~Hot Springs Creek Crenulation North 21~Hot Springs Creek Minor fold axis South 2lHot Springs Creek Minor fold axis North 12~Hot Springs Creek Minor fold axial South 2I, plane,jHot Springs Creek Minor fold axial North 3plane~Hot Springs Creek Pegmat ites South 1. Ii Hot Springs Creek Pegmat ites North 15II Hot Spr i ngs Creek Contacts Area-wide 3'Ii Hot Springs Creek Joints South 6511'jj H t S .0 prlngs Creek Joints North 119Ii Hot Springs Creek Fracture Cleavage South 26I:Total Measurements 394il'il Owl Foliation Northeast 35I ~~:I~Owl Foliation West 18Owl Cre~k Foliation Sou theast 28~ Owl Crenulation Northeast 41111· Owl CrenulationIIWest 5I Owl Crenulation Southeast 5mi~Owl Minor fold axis Northeast 8: 11Owlt:Cre~k Minor fold axis West 111 Owl ~linor fold axis Sou theast 3Owl ~~:~~ Mineral lineation Northeast 2I1Ii Owl Creek Mineral lineation Sou theast 1ij Owl Creek Minor fold axial Northeast 2I~ plane,I·II Owl creJk Pegmatites Northeast 5~ Owl CreJk Pegmat ites West 1IJ11 Owl Contacts Northeast 2Owlml~11 Contacts West 3l'iOwl Contacts Southeast 2Owl Joi nts Northeast 41Owl Joints West 32Owl CreJk Joints Southeast 40Owl CreJk Fracture Cleavage Northeast 38Owl Cre~k Fracture Cleavage West 2Owl Creek Fracture Cleavage Sou theast 15Total Measurements 29348,~'"IIf
l.ble 4.JtinuedlJ ,• ~!-',__....;.A..:..:.r-=e:...::a-+--IHorse Creeki:~ Horse Cre~kIi Horse Cre~k,.1Horse cre'Lki;1 ~ Horse cre~k:1\" Horse Creek,1 Horse Creek· i,l Horse crelekI~ Horse CreekHorse CreekHors e Creek,1~,1.~Of·!The fabric IS linear/planar with the following characteristics:I:strain. ITheFeatureFoliationFoliationLineationsMinor fold axialplanePegmat itesPegmat itesContactsJointsJointsFracture CleavageFracture CleavageSub AreaNorthSouthSouthSouthNorthSouthNorthNorthSouthNorthSouthTotal MeasurementsNumber ofMeasurements1325212122119822214293augen gneiss, intruded synkinematica11y during themIfirst eventi also has a well-developed orthorhombic fabric.~ 1) Foliation and schistosity defined by platy minerals (muscovite andiI,I 2) Deform~d porphyroblasts in the augen gneiss, producing the· j~ bi otit1).:, dominamllt NW linear element.hil 3) Boudin axes and fold hinges.II:~. Subsequent reformation irrq:>rinted the following additionalithe fabric:1~ 4) crenulf'tions on foliation surfaces.I,.~IiI5)beenLinearelements created by intersecting fo1 iation, fracturelc1eavalJe, and joints.features ontoThe efrect of anisotropy on subsequent deformational style hasdiSCUS'jed in the literature (Cobbold, Cosgrove, and Summers, 1971;49
Ii11I'"I,fiIiCobbold, 19715; Watkinson and Cobbold, 1981).In the area studied, thetell-deVelOp!ld LIS fabric imprinted onto the rocks by Fl is believed torI' ,fl,I, ~dve had a p ofound effect on the deformation produced by subsequentievents.i,I(,In this study the tectonite fabric elements will be referred to~tilizing~rincipala iystem of orthogonal axes, X, Y, and Z Which refer to theaxes of the finite strain ellipsoid for the ductile,I I'f,eformationaJ episode producing the fabric such that X ~ y ~ Z. The~tructures f~rmed by brittle deformation in the area show, like the'~uperposed dJctile structures, preferred orientation and intensitylontrolled bJ the early formed LIS fabric.IThe fOllowing terminology will be used in reference to the'fractures: 1) a-c joints are approximately perpendicular to the, I~ominant linJar element; 2) conjugate or oblique joints tend to occur,In pairs SYm~tricallY inclined to the dominant linear trend to which~heirline oft intersection is normal; 3) b-c joints are orthogonal tofhe ac plane parallel to the dominant linear trend.Oblique joints canbe classified as shear joints, a-c and b-c joints can be classified as!~ension jOin~S (Price, 1966).,UCTILE FIELDl Ifl Oeformat i gn,11 I'rn A strong axial plane foliation (51) is the dominant fabric element. 'eveloped duJing the first deformational event (Fl). 51 is strongly!eveloped in the quartz-feldspar-biotite gneiss at Hot Springs Creek::nd Owl Creek, the quartz biotite schist at Owl Creek and the augen,:gneiss north of the Hot Springs Creek fault at Hot Springs Creek, Owl!~i50, ~.11
i"~' Ii'!j:,.1ii11~reek, and HOrSe Creek. South of the fault at Hot Springs Creek thefoliation is weakly defined by schistosity in the quartzite member ofIhe Yell~ JJcket For~tion; the ellipsoidal gneiss south of the faultnas a poorly developed F1 foliation.'i,,,!Ij; The strong linear element of the LIS fabric produced by F1 occursIe!~in the augen gneiss. The augen gneiss was intruded synkinematiclyIi'~'uring the development of S1 (Maley, 1974). The style of F1 folding~Iitrending~as isoclinal with fold hinges trending NE (Maley, 1974), and with~oliationnorth, dipping 35" to the west (Figure lIA).~loudins that formed in amphibolite, pegmatites, and augen gneiss sills~Ilrave axes that also trend NE indicating a component of NW-SE extension.~ shear component to the ductile deformation is indicated by rotation~lj(a counter-clockwise sense viewed towards the west) of theI~'porphyroblasts in the augen gneiss. Spindle-shaped clusters of~eldsparand quartz were formed, arranged fiber-like, defining the, ~.I~ineation an~ interpreted to be the principal stretching direction, XIJf this event. The linear fabric formed is more penetrative and~. aominant than the Fl lineations formed by boudin axes and fold hingesh,::hat trend NE. These conditions hold true at Horse Creek, Owl Creek,I~Ij~nd Hot Springs Creek north of the fault. South of the Hot Springst,,I~qreek fault the ellipsoidal gneiss has undergone little shearing;II,Jubsequent ly, there is no dominant lineation of this type produced.~.. ~ It is suggested that this early fabric, where strongly developed,I ~':1affected orientations of subsequent strucutres,: both ductile and, i:~For a strongly anisotropic material the linear element is~rittle.[IIf'~mportantJin redirecting the strain produced by the late deformation~ 51
N(a) ( b)N( c ) (d)igure 11Rfgional foliation and lineation trends Fl (lla). F2 (lIb),F~ (lIe), and F2 south of the Hot Springs Creek fault (lId).52
events. A direction of least resistance to flexure exists parallel tothe linear element (Hanmer, 1979). The greater the contrast instrength between the linear element and the matrix, the greater thebending anisotropy. Theoretical calculations and modeling experimentshave shown that in material with LIS fabric, stress is not alwayscoaxial with strain (Cobbold, 1976; Cobbold and Watkinson,1981). Stress inclined 45" to 90· to the linear element usuallyproduces fold hinges within 20· of the linear element.The fabric (both linear and planar) is due to rheological andstructural anisotropic elements (Watkinson and Cobbold, 1981). Pinchand swell pegmatites, folded pegmatites, and quartz-feldspar spindlesintroduce components of structural anisotropy. This form of anisotropywould be present even if the material were rheologically isotropic. Inthe case of the area under study, the rheological contrast is providedby aligned feldspar and quartz spindles in a foliated matrix of biotiteand muscovite, providing the dominant NW linear element.F2 DeformationThe dominant features produced by the second deformational eventare lineations that include crenulations on foliation surfaces, axes ofsmall passive-flow folds, boudin axes, and mineral lineations. F2minor fold hinges trend NW, the foliation trends NNW and dips 35· west(Figure lIB). Recumbant isoclinal minor folds occur locally, whererocks of contrasting competence are contiguous, and rapidly die out.Ptygmatic folds in pegmatitic veins are pervasive. Boudins have axesparallel to minor folds.53
At Hot Springs Creek there is a difference in the deformationalstyle north and south of the Hot Springs Creek fault. South of thefault F2 lineations are poorly developed and exhibit diversity inorientation (Figure 16B). The lineation trend and plunge is NE(47°/40°, Figure 110), almost perpendicular to the NW trend and plungeof F2 lineations north of the fault (323°/29°).North of the Hot Springs Creek fault the quartz-feldspar-biotitegneiss and augen gneiss are deformed in style and oriehtation thatremains relatively uniform throughout the rest of the study area up tothe contact of the augen gneiss with the Painted Rocks Lake pluton. Inthe quartz-feldspar-biotite gneiss lineations ure the dominantfeature. Crenulation of Sl is strongly developed, without formingcrenulation cleavage. On a larger scale, kink folds and mullions areformed. Folded pegmatites, granitic stringers and minor local folds ofSl have hinge axes parallel to the crenulations, as are associatedboudin axes. In the augen gneiss, crenulations have formed in thebiotite-muscovite layers which are parallel to the long axes of thequartz-feldspar spindles of the F1 deformed/rotated augens. Thepreferred orientation of these linear features is NW (323°/29°,Figure lIB).At Owl Creek the quartz biotite schist in the southeast subareahas a strongly developed crenulation. It is similar in intensity tothat developed in the biotite-muscovite layers of the quartz-feldsparbiotitegneiss. The planar element imparted by F1 in the quartzbiotite schist is stronger than that in the quartz-feldspar-biotitegneiss and no further deformation into kink folds or mullions was54
observed. Folded pegmatites, minor folds of 51, end boudins all had NWtrending axes parallel to the F2 crenu1ations. These features,however, are not as abundant as in the quartz-fe1dspar-biotite gneiss.The augen gneiss throughout the Owl Creek study area hascrenu1ations on 51, as do the biotite-muscovite layers in the variousm;gmatite zones and biotite-rich layers in the quartz-fe1dspar-biotitegneiss. As at Hot Springs Creek, there are numerous isoclinalrecumbant minor folds and passive flow folds in the quartz-fe1dsparbiotitegneiss.At Owl Creek the Fl hinge axes have a SW trend and plunge(268·/49·). The Fl fiber-like linear element produced by the deformedporphyrob1asts in the augen gneiss have a N trend and plunge (0·/0·).The majority of F2 lineations are oblique to this trend at 329·/20·.The strain during F2 may have been redirected by the anisotropic natureof the L/S fabric to produce F2 lineations near, but not quite parallelto, the original linear trend (30· dihedral angle), but the Fl L/Sfabric was strong enough to provide very good preferred orientation forthe F2 axis (Figure 21B). There are some F2 crenu1ations and minorfold hinges observed that had trends of O· and plunges of O· to 30·located in the northeast and southeast subareas only. They tend tooccur in small local areas where lithologic variations produce sharpcompetence contrasts and local minor folding.The metamorphic rocks exposed at Horse Creek are augengneisses, which are very uniform and homogeneous in the area;pegmatites and lenses of quartz-fe1dspathic material are rare and wherepresent, are only 1 to 2 m thick. The Fl deformation had less of a55
~otational component than Fl in the augen gneiss to the south. Ratherthan producing a strong fiber-like linear element the porphyroblasts injilill~he augen gneiss at Horse Creek have largely deformed by flatteningJii i~li1nto the X-Y plane. Some rotation of porphyroblasts occurred, with, Ii![~ubsequent linear fabric produced, but the dominant element in tile LISiii'~abric of Horse Creek is planar. Consequently, it appears that the F2,geformational event in this area has not been affected by the weakerIllinear elements of the earlier F1 fabric. Minor folds are rare and no1i~~oudinage of pegmatites was observed. Nevertheless, the pole to theJirdle formed by the deformation of Sl by F2. has a trend and plunge of~,1" 120· (Figure 22A), indicating that the anisotropic LIS fabric may~avebeen strong enough to direct strain produced by F2 into a symmetryJhat is similar to that present to the south.:1 ~ iiF,3 Deformat ion~ In the Panther Creek area, Maley (1974) observed outcrops in which~oth second and what were interpreted to be third event lineations were. jJresent. Maley concluded that the third event lineations (boudins and:~carfolds) may represent a progressive later stage of the second, :ievent, during which folding and boudin axes formed with a NE trend.Jineations (crenulations and minor fold hinges) trending to the NW (F2)rij~nd NE (interpreted to be F3) were also observed in the same outcrop at!i~everal locations in the Owl Creek area. Maley also conjectured that,'I:~f not a progressive extension of the second event, the third event mayiiIbe related to the intrusion of the Idaho batholith. The Idaho11, Ij1 ,~atholith has a northeasterly contact with the Precambrian metamorphic~:1nocks in the area and, if a NE-trending pluton were rising, one would)1':1::1 56;"1:,~: ~ 11: !~i~.I
I'll,:, \~1,1'. '.'1·1,'lxpect transport to the SE.Maley interprets the F3 deformation inW!lthiS light, in which case one would expect to see an increase in!d. ~bserved F3 deformation as the batholith is approached. This is theJ:,j''lease at OHl Creek, but at Horse Creek there was no evi dence of F311:1!:~deformation in the augen gneiss. This indicates that F3 structures are'j'i~either related to later stages of F2 or that the F3 event was ai:;precursor to, but not intrusion of the Idaho bathol ith.! I~I" 'jGreenwood andi:?Horrison 'I(1973) and Reid (1959) working north of the batholith place F3: I'I.j!as pre-bathol itic.lill1,:1:;Jl Regardless of the sequence of events that produced the F3idstructures, the orientation of minor structures was governed by theI,tli:i;presence of an anisotropic LIS fabric previously imprinted onto the1:)~ i~l[Ll:if.rock body. At Hot Springs Creek no F3 structures were observed south,d]!,iJ:;ilof the Hot Springs Creek fault.North of the fault no structures wereIli~ bs erved bu t Mal ey (1974) does descr Ibe 1nstances of the1r 0 ccurrence.::r he 11 near trend and plunge 1s NE (54'/22'). At Owl Creek F3~~lneatlons were observed In the northeast and southeast subareas only.!,:\The trend and plunge was W (283-/36-).i j!.~, li ll:;'[:trend NE and dip 30- NWml!;'I,:BRITTLE FIELDi!il(Figure llC).Axial planes of F3 minor foldsThe stresses that produced new and reactivated old fractures ind!;':the stUdy area may be due to the intrusion of igneous rocks, plate,:11nteract! ons. or rempva1 of overbu rden by thrus t f au 1t 1ng (Rup pe 1 andI:lopez, 1984) and subsequent erosion.Between 100 and 75 H.Y.A. the"1'redicine Lodge Thrust Plate was transported to the east. Theit,'!autochthonous terrain in the area studied has undergone subsequent! '~11. 571\1'1
;1 _ ,.~, 311Ii!.::JJ:::1uplift and denudation due to erosion.:'j\ ; ;I~The removal of overburdenihtrodu ces stresses due to redu ct i on of overburden pressure. up 1ift ofj11 the region and thermal stresses due to cooling. The net nonhydrostatic'>11(1deviatoric) stress developed due to overburden removal is extensionalI'ili'(;Haxby and Turcotte. 1976).:":ji j~'il Joints that form in the tensile stress field generated by thermal:~ooling and contraction (Price. 1966) can be placed in two classes: 1)-Jnloading joints which include vertical joints, indicati~g response toitensile stress in the horizontal plane and joints horizontal or~arallel,J; ,:I~to the topographic surface; and 2) release joints that arefabric controlled in their orientation. a-c and b-c joints (Engelder.jiil:)985).Inl, ~ot Springs Creekii'l Tens i ona1 joi nts in the south su barea show two preferredbrientations (Figure 16C): 1) vertical unloading joints in the a-bin!I('plane striking 25°. normal to foliation; and 2) a-c release jointsILil'~riented 131°/70° 5, striking parallel to Sl and dipping with a 70°I,,!::1ii:idihedral to the foliation and b lineation. Joint sets at 42°/42°5 andI".,!'''I11:177°/70°5 can be classed as oblique (or shear) joints (Price. 1966).:1:]Both show preferred orientation most likely controlled by thei::lan isotrop i crock fabr i c. The 42 °/ 42•S joint strikes parane1 to bandjiithe 77°/70°5 joint is perpendicular to the b-c plane. The two jointsi:; ~!U::intersect along the b-c plane at a 40· angle to the b direction.I .":;.1] Fracture cleavage in shear zones in the south subarea shows one!l,:;dominant orientational feature; three fracture sets all intersect NEif-il ::.,1,:,I(Figure 12). Within these three sets. two near vertical sets strike11::,-11.,;....~ ~! .,1'i1 58jJ , : ~In ."'·'.'.1'"
79/!59$'/-,-- 173/~OEgure 12Fracture orientations south of the Hot Springs Creek fault; equalarea projection, lower hemisphere.N7~/54Sgure 13Fracture orientation north of the Hot Springs Creek fault;equal area projection, lower hemisph~re.59
,1i Ij!;JJiUIj~~~rpendicular to the two foliation maxima in the area. The third set,L~iJj~isects the a-b and b-c planes. A fourth fracture set is oriented! ,;.11iH~!~9·/59·5, which is normdl to ~ formed by the girdle of folded 51.;!! Vertical unloading joints due to tensional stress are well!B~eveloped in the north subarea. These Joints also show control due to:'"'1LI~I~he anistropic fabric. A NE set strikes normal to b containing theli'l,!,jli1lominant X lineation (Figure 17C), another set strikes E almost normal:~othe strike of foliation. Two oblique joint sets are orientedi!~0'/47'S and 76·/50·S.The first strikes perpendicu lar to thei,1:;oliation strike and the second is normal to b.IlLi:l.1,1;jIn the north subarea fracture cleavage shows five maxima~-:In]I '~I~oncentrationsthe orientation of which show control by the anisotropici'~ij~abriC (Figure 13): 1) normal to b; 2) normal to the b-c plane in thei'J-b plane; 3) strike E perpendicular to the foliation; 4) strike NEj:"'11, ".'.'"ii,perpendicular to the b direction with a dihedral angle of 40·; and 5)! ,:~Iltrik;h:a:::l::r::g:h:r:e:i:::::O:~endS 45' and dips 60' to 75' to thei'"i;E (Maley, 1974). The fracture zone of the fault, for most of itsIi '~ji:,Jength, ranges from 60 to 150 m in width and is highly bleached andIHl::a ltered. The fault is an oblique slip fault with left slip and normali ':;,~!11 liP components. Fractures in the fault zone show a relationship to1 ':~k the differently oriented anisotropic fabrics in the northern and:;!I,southern subareas astride the fault.;::1!1~ IIiT,lorthern side is fractured normal to the dominant NWi,,·i 1i:'~Illlj!J!l~:1 ~ iIn the NE trending fault zone thelinear element at90· dihedral angle to the fol iation. The southern side is fracturedIii l1 60I""", Iii!Il, "
:jat an 85" dihedral angle to the foliation t:1jlineation.Owl Creek!jjjilparallel to the dominant NEIn the Owl Creek northeast subarea the dominant joint sets are a-c'release joints which are normal to the b direction..~'111Fracture cleavageshows three orientations controlled by anisotropic rock fabric'.l :1(Figure 14a): 1) normal to b; 2) E-W normal to the F1 hinge axial. !~jdirection; and 3) strike parallel to the foliation and dihedral angler185" tothe f 01 i at ion p1an e.,j11 In the southeast subarea the dominant joint orientation is normal,'1'jto the b direction (a-c joints). Fracture cleavage has four preferredl~orientations controlled by the anisotropic fabric as follows (Figure.ili:~14B): 1) NE normal to b; 2) NE intersecting the foliation strike at,j45" with a dihedral angle between fractures and foliation of 90"; 3), ,:~,"il'Iilfractures strike N parallel to foliation strike with a dihedral anglel~of 30"; and 4) NW containing b along its plane with 30" between theljfracture and foliation strike.FiThe dominant joint orientation in the west subarea is normal to b••j;1 (a-c JOlnts). Fracture cleavage strikes N parallel to the foliationIIi'i1i strike and intersects the foliation at a 60" dihedral angle (Figure,Ip~ 14 C) .j:~ Horse Creek'~:1 In the Horse Creek south subarea the weaker linear element in the] LIS fabric of the augen gneiss has res~lted in greater diversity in the:::j;1 orientation of joints and frdcture cleavage (Figure 22B and C). There"Ia weak trend for the strike of joints to the NE. The dip trends61
(a ) (b)(c )Figure 14Fracture orientations at Owl Creek: NE Subarea (14a),SE Subarea (14b), WSubarea (14c); equal area projection,lower hemisphere.62
vertical (unloading joints) to an orientation that is normal to b,e regional linear trend (a-c release joints).The north subarea at Horse Creek, located in the Painted Rockspluton, is the only sizable portion of the study area that is notPrecambrian rocks with a strongly preferred LIS fabric.oints exhibit great diversity (Figure 23B) vertical unloading jointscommon. 5trike tends to be either parallel (NE) orthe contact of the pluton with the augen gneiss.Fracture cleavage tends to show a preferred orientation of strikethe NE with dips ranging from vertical to steeply dipping to the NW<strong>GEOLOGY</strong> <strong>OF</strong> <strong>HOT</strong> <strong>SPRING</strong>S VENT SITESBIG CREEK <strong>HOT</strong> <strong>SPRING</strong>SThe vents of Big Creek Hot Springs are located in thequartz-feldspar-biotite gneiss adjacent to the Hot Springs Creekfault. The distribution of the vents and related structures is shownin Figure 7. The vents occur in groups that tend to align NW. Thevents with the highest flow rates are at the same elevation; those onthe east side of the discharge area are at the same elevation as HotSprings Creek and those to the west are located on the slope above thecreek (Hot Springs flows east-west through the vent area). VentHSC-17, which is isolated to the west of the general vent area, is alsoat the same elevation as the major vents (Figure 4).The springs flow from near vertical joint sets (tensile unloadingjoints). Vents with high discharge have produced channels (5-10 cm63
Lide) along these joint planes. There is little shearing evident:;:Ii':ilexcept at the low flow vents direct ly adjacent to the Hot Springs Creeklilf au It.:j The NW distribution of the vents is parallel to b, the dominant11,:1i:~element in the fabric of the quartz-feldspar-biotite gneiss. Two sets:Hof near vertical joints are present, one set strikes NWparallel to b[:I!and normal to the foliation, while the second set tends to strike NE!~:ilnormalto b and parallel to the foliation strike.I'i:d These vents are thought to occur along a joint set which taps aI!ll:;:I,convection system that exists in the Hot Springs Creek fault zone. TheI, :;', geothermometry data (Page 80) suggests that the convection system is:!:~ii;i,probably restricted to a limited set of channels. Geothermal water isIlltapped near the surface and directed in a fan-l ike pattern by the~~tenslle joint system that exists in the rocks north of the fault.lhiiniHOWL CREEK1)':1I,;.I;' ~ 1 The vents at Owl Creek are located in the augen gneiss.jj::iFOistribution of vents and associated structures are illustrated inHi!I ~.IIUFigure 8.iLii'"Geothermal water is discharged from: 1) dominant joint setsd-!that are normal to b and strike NE perpendicular to the foliation; andi~ ;~~I'"\;;2) fracture cleavage that is near-vertical and strikes N parallel to!~ "j ~H!'1 lfoliation.HilI,!,iAll vents with measurable flow rates are on the west side of Owl1,;:1InCreek and discharge 1 to 1.5 m above the creek surface. East of Owl:"1I~creek 45 m and 25 m above the elevation of the creek, a seep discharges!tilfrom heavi ly altered and sheared rock adjacent to a small fault. Theireep is from fractures with a stri ke of 6840. E and di ps rang; ng from11 :Ij:;'!i'11
~ ,i. i.jJi ;'~i ,~, .,1"!I!;i~ertical to 70 0 SE. The fault is a conjugate set, one plane orientedin:"i;l52°/35°SW and the second 115°/24°NE. The first fault plane hasfilii"'surfaces up to 20 cm apart which are due to leaching of the rocks inii:ljiithe fracture zone. The walls of the second fracture in the fault setJ)I: }i:have no space between them, but the foliation has been bent so as toIHI])j'indicate reverse faulting. This fault trends NW parallel to b, the lowli:rngle conjugate fault planes intersect the foliation with dihedral:l'rngleS of 90° (152°/35°SW) and 75° (1l5°/24°N).ij :jHORSE CREEKIj~ T~e distribution of vents and relationship to structures at Horseii,:JCreek 1S illustrated in Figure 9 for the HCl vent site and Figure 10Il:~for the HC2 vent site along Lindgren Creek. Both vent systems are[Hii1'!11,.,il'located in the quartz monzonite of the Painted Rocks Lake pluton.:'11 l,Hi: The HCl vent site (Figure 9) consists of two large vents in a NE1;1'111!:itrending shear zone. The highest flow (220 liters/min) is from a~Ifracture with an orientation of 40"/65"N. The second vent with an 110Ilfiters/min flow is in a fracture oriented 85°/65°N.The fractures areI~ located on the east and west sides respectively of a minor faultjr1],1iH0 r i en t ed 176 °/ 86 °E. The fault postdates the fractures and causes the'i.H:'tJH change in orientation of the crosscutting fracture sets acting asli1'Is; vents. A microgranite dike 30 cm in width approaches from the south1;'1j:j:roriented 156°/87° SW) and terminates against the north-south fault111; 5 meters south of the hot spring vents. The relative motion of thisPI1;1'I'iil strike slip fault is left lateral.1:1i:;! The vents of the minor vent site are more widely distributedi~ ;:ill (Fi gure 10). They range from seeps to one of a moderate flow (7.5ililiters/rnin). All are located in sheared quartz monzonite adjacent to aHji1]11ir! 65!"i
large plug of porphyritic quartz latite. The fracture cleavage in theshear zone is oriented 20·/8S"E, parallel to the contact with theporphyritic quartz latite plug.66
J; '1,i!ij :,:~i,~ V. GEOCHEMICAL SURVEY114"INTRODUCTION'J!jii'\I"jGeochemical thermometers can be used to estimate source't~mperatures based on the chemistry of water collected at the vent.I::!:The application of water chemistry to geothermometry is dependent on!11e vera1 as su""t ions (F au rn ier, 1977): 1) the concentrat ions of theiohemical species in aqueous solution are the result ofI'~:'~emperature-dependentreactions at depth; 2) the chemical reactants!:Jhat form the indicator species are in adequate supply; 3) the specifici:,~!jindicator reaction is at equilibrium in the reservoir; 4) no~leeQUilibriation of the indicator species occurs as the water leaves!:i}he reservoir and flows to the surface; 5) either the water containingIj;~;;the indicator species does not mix with shallow surface water, or the1)]!iri n: ::::~~e:h::u::e:f o::~:x c:u ~ i:;::U:::d~ss balance ina nu mberj;;of geothermal systems indicated that the first three assulJl)tions areI!,~enerally va 1id (Reed and Spy cher, 1984).The reaction rates of,hydrothermal fluids with the wall rocks of their flow channels are suchii!l~hat assulI\ltion four is also generally valid (Helgeson, 1970). Ifj',icomplications do arise, such as recent fracturing or chemicalIj~preCiPitdtion,IIin the flow channels, estimation of source temperatures'ilwould be difficult or il11Jossible. By comparing the composition ofInli.ilvarious waters in the area and the use of mixing models (Fournier and,(ij!;i!lTruesdell, 1974; Truesdell and Fournier, 1977), the validity of theii! I last assumption can be tested.,[iii1nl67I!11 ;i Ij
Na/K GEO<strong>THE</strong>RMOMETERThe Na/K ratio in geothermal waters is controlled by a reversibletemperature-dependent mineral/water equilibrium expressed by theexchange reaction K+ + Na-feldspar.= K-feldspar + Na+ (Fournier andTruesdell, 1973). With increasing temperature the reaction equilibriumshifts to the left, producing lower Na/K ratios in the thermal watercompared to water at lower temperatures.Fournier (1981) gives an equation that expresses the temperaturedependence of the Na/K ratio,rc= _--..----_..,...,..,.....1~2;.,:,1,;-7 -,;::--::;:~.,.- 273. 15log (Na/K) + 0.8573 ( 1)where the concentration of Na and K are in ppm (mg/l).In most cases,the equation fits the data well for temperatures greater than 180·C.An equation suggested by Truesdell (1976),855.6Na/KT rc= - 273.15log (Na/K) + 0.8573 (2)is thought to only be adequate at temperatures greater than 200·C dueto its departure from the least squares best fit to the empirical data.The main advantage of the Na/K geothermometer is that it is littleaffected by dilution with shallow local waters,. if there is little Na+or K+ in the diluting water when compared to the thermal water. Also,the Na/K exchange reaction is slower to readjust than silicaequilibrium in geothermal water rising to the surface and cooling(Ellis, 1970).68
Fournier (1981) does not recommend the use of the Na/Kgeothermometer at temperatures less than 180·C.Below this temperaturesimple cation exchange between Na and K-fe1dspars may not be thedominant reaction (Ellis and Mahon, 1977).The Na/K ratio is generallynot applied to reservoirs with temperatures greater than 350·C.hydrothermal alteration clay minerals, such as montmorillonite, arepresent in the upper few hundred meters of the geothermal reservoir,the K+ may be depleted by preferential sorbtion on the.surface of theclays.This is particularly true if the area of discharge is one oflow permeability (Mahon, 1970).The usefulness of the ratio isgenerally limited to the range of Na/K ratios between 20/1 and 8/1 andhas little or no temperature significance for acid thermal waters(White, 1970).Within these limitations, the Na/K ratio gives a goodmeasure of source temperatures in a wide range of rock types.Na/K/Ca GEO<strong>THE</strong>RMOMETERGeothermal waters rich in calcium give anomalously high calculatedtemperatures by the Na/K method. Fournier and Truesdell (1973)proposed an empirically derived equation based on combined Na/K andea/Na ratios:TOC = 1647 - 273.15log (Na/K) + 6[10g (lCa/Na) + 2.06] + 2.47 (3)Ifwhere the concentrations of the cations are in ppm (mg/1). Thetemperature is first calculated using ,a value of 6 = 4/3. If thecalculated temperature is less than 100·C and [log (lCa/Na) + 2.06] ispositive, no further calculations are necessary. However, if thetemperature estimate is greater than 100·C or if [log (lCa/Na) + 2.06]69
is negative, a = 1/3 is use9 to calculate the temperature.This methodis applicable to lower temperature systems that contain significantamounts of calcium.If boiling or mixing with cold dilute water occurs, theconcentrations will change, thus affecting the calculated temperature.Boiling will cause the loss of C02 possibly precipitating CaC03. Theloss of Ca++ from the solution will result in calculated temperaturesthat are too high. If the geothermal water is much more saline thanthe diluting water, the dilution effect of shallow meteoric water onthe Na/K/Ca geothermometer is negligible. However, if the geothermalcomponent is only 20 to 30 percent, the effects of dilution must beconsidered. Neither the Na/K nor the Na/K/Ca geothermometer should beapplied to acid waters, which would not be in equilibrium with thefeldspars. Also, the two geothermometers are not applicable if thegeothermal system is localized in rocks with unusually high or lowconcentrations of a particular alkali.Fournier and Potter (1979) pUblished a correction of the Na/K/Cageothermometer for geothermal waters high in magnesium and withcalculated reservoir temperatures greater than 70·C. A correction ofthe calculated temperature when the temperature of the water is below75·C and the partial pressure of C02 in the aquifer is above 10-4 atmhas been given by Paces (1975). Under these conditions a nonequilibriumsteady-state may be maintained between the geothermal waterand the feldspars.70
Li GEO<strong>THE</strong>RMOMETERThe lithium ion, due to its relatively small ionic radius and lowelectrical charge, is easily driven from mineral structures by smallincreases in temperature (Brondi et al., 1973). This makes it usefulas a pathfinder element in the exploration for geothermal systems.More recent work has also made use of lithium as an indicater ofgeothermal temperature.Fouillac and Michard (1981) have developed two empirically derivedequations that relate temperature to Li+ concentration in thermalwaters. The equations, the selection of which is dependent on chlorideconcentration, are:TOC = -2258 - 273.15log (Li) - 1.44 Cl- 0.3 m (5)where concentrations are in molar units.The Li+ temperature relationship is unlikely to be related to achemical equilibrium between water and a lithium mineral, as lithiumminerals are rare in hydrothermal environments.Lithium isdisseminated in most igneous and sedimentary rocks, where it is presentin the concentration range from 10 to 70 ppm (Heier and Billings,1969). Dilution by shallow waters will have an effect on thecalculated temperature, as there is only one species concentrationinvolved. Mixing models must be used in this case. Lithium in aqueoussolution is also susceptible to sorption by near-surface clays.7111Iii
Na/li GEO<strong>THE</strong>RMOMETERFouillac and Michard (1981) also published two empirically derivedequations that relate the ratio of sodium and lithium to temperature.The chloride content determines which of the equations is applicable:1000 - 273.15log (Na/li) + 0.38 Cl- 0.3 m. (7)The behavior of sodium in geothermal systems is generallycontrolled by feldspars. The behavior of lithium is not determined byspecific lithium-bearing minerals, but by the lithium concentration ofthe rocks in the reservoir. The Na/li relationship results from thedifferent behavior of Na+ and li+ as a function of temperature. Thedependence of li+ concentration on temperature is stronger than that ofNa+ concentration, between 0 and 30QoC concentration varies four ordersof magnitude for li+ and two orders for Na+ (Fouillac and Michard,1981). As a result the influence of some of the kinetic parameters forthe two species are cancelled, giving a more accuratetemperature-concentration relationship than that obtained from thelithium geothermometer and in some cases, the Na/K or Na/K/Cageothermometers (Arnorsson, 1985).The Na/li ratio is not greatly modified by cooling during theascent of the geothermal waters. Since the calculated temperature isdependent on two species, the effect of dilution by surface waters isminimized.72
Si02 GEO<strong>THE</strong>RMOMETERIn geothermal waters the concentration of silica is determined bythe solubility of the various silica species. Equations expressing thetemperature dependence of silica solubility in various forms are listedby Fournier (1981):quartz Toe ~ 1309 - 273.15no steam loss 5.19 - log c(8)quartz Toe ~ 1522 - 273.15maximum steam 10s5 5.75 - log c(9)Toe = 1032 - 273.15chalcedony 4.69 - log c (10)alpha- TOe = 1000 - 273.15cristobalite 4.78 - log c (11)beta- TOe ~ 781 - 273.15cristobalite4.51 - log c(12)amorphous TOe = 731 - 273.15silica 4.52 - log c (13)where c is the concentration of silica in ppm (mg/l).The determination of which chemical species is controlling silicaconcentration is an impediment in the application of the silicageothermometer. Boiling springs with flow rates greater than 120 to130 liters/min can be assumed to have cooled at least partially by the73
Iadiabatic separation of steam (Fournier, 1981); thus the quartz-maximumsteam loss equation (Equation 9) is applicable. In low temperaturegeothermal systems in Iceland, Arnorsson (1975) suggests that theconcentration of silica above 180·C is controlled by quartz and below110·C by chalcedony. In some granitic terrains soluble silica iscontrolled by quartz above 90·C and by chalcedony below 90·C (Fournier,1981).Above 250·C the equations depart from experimentally determinedsolubility curves and are not applicable. Laboratory studies byRimstidt and Barnes (1977) show that the time required for theprecipitation of 10 percent of a 600 ppm silica solution was 8 hours at250·C versus 16.5 years at 25·C. The amorphous silica geothermometerworks because of this drastic decrease in the rate of quartzprecipitation as temperature decreases. At reservoir temperaturesbelow 225·C little quartz will precipitate as the geothermal watersupflow and cool, but quartz is likely to precipitate in reservoirshaving temperatures above 250·C.The solubility of silica can also be affected by pH (Fournier,1981), increasing with pH )7.0. The effect is most pronounced at about175·C where a pH of 7.6 causes a 10 percent increase in quartzsolubility. Thus, a temperature correction, due to pH effects, isnecessary if the geothermal solution becomes alkaline. Waters that arein a high temperature environment at depth are likely to have pH valuesbelow 7.5 due to the buffering of hydrogen ions by silicate hydrolysisreactions (Fournier, 1981). If waters of this type have high pHvalues, it is generally due to the loss of C02 after the water cools74"
leaving the geothermal reservoir, and therefore a pHcorrection is notapplied to the silica concentration. If dilution of the geothermalwaters occurs by mixing with cool shallow waters, a correction of thecalculated temperature is necessary. An appropriate mixing model mustbe used to determine the proper correction factor (Appendix B).The silica geothermometer is useful due to the fact that theconcentration in solution is not significantly influenced by complexformation, ion exchange with near surface clays, or the loss ofvolatile components (Fournier, 1977).O<strong>THE</strong>R CHEMICAL INDICATORS <strong>OF</strong> SUBSURFACE TEMPERATURESMagnesium and iron are abundant in the rocks of most geothermalsystems and manganese is usually present in minor quantities. Theirsolubilities are limited by mineral-water equilibria which, in thesecases, favor the retention of the cations in the mineral phases (Ellisand Mahon, 1977). Concentrations of magnesium, iron and manganese ingeothermal waters are controlled largely by pH. Low pH waters tend toliberate cations by reactions such as MO + 2H+ = M2+ + H20 or MS + 2H+= M2+ + H2S, Moderate to high pH geothermal waters should have verylow concentrations of 11g, Fe and Mn. Magnesium concentrations inlow-salinity, high-temperature geothermal waters are very low(0.001-0.1 ppm). The concentrat"ion i$ controlled by reactions withchlorite or montmorillonite (Ellis, 1971). Low Mg/Ca ratios indicatewaters with low C02 content (Ellis, 1979).75
BIG CREEK <strong>HOT</strong> <strong>SPRING</strong>SANALYTICAL RESULTSThe values of pH, rate of flow, and the concentrations of variouscations are listed in Tables 5 and 6. The results of the calculationsfor the various chemical geothermometers are listed in Table 7. Silicaconcentrations and calculated source temperatures are tabulated inTable 12. The location of the sampled vents is illustrated inFi gure 7.Si02 GeothermometerAt Big Creek Hot Springs high flow and near-surface boiling(Tables 5 and 6) in the largest vents (numbers 5,9,10,13 and 14,Figure 7) indicate that the system has undergone adiabatic cooling. Ifmaximum steam loss is assumed, the appropriate silica geothermometer isthat of quartz-maximum steam loss (equation 9, Page 73), giving acalculated temperature of 165·C (Table 12). If no steam loss hasoccurred, the use of the quartz-no steam loss equation (equation 8,Page 73) yields a temperature of 178·C (Table 12). The other silicageothermometers yield temperature values (156-48·C, Table 12) that arelower than those obtained from the Na/K and Na/K/Ca geothermometers(Table 7) and consequently probably not applicable to this system.Na/K GeothermometerSince Na/K ratios are about 10 and source temperatures are nearl80·C, (Table 7), the Na/K geothermometer should be applicable. Thecalculated temperatures using Fournie"r's equation (Na/KF, equation 1,Page 68) are consistently 20·C higher than those obtained by76
Table 5. Physical/chemical data for Big Cree~ Hot Spr1ngs (SeeFigure 7) on 6/23/81. Cation concentrations in ppm.Vent pH T"c Na K Ca Li Mg Fe Cond LPM*1 8.1 70.5 223 23 18.8 .70 .41 .22 66 14.82 8.4 88 223 23 13.7 .69 .21 .07 42 5.63 8.4 88 220 23 13.7 .67 .22 25 9.34 8.3 89 221 23 14:2 .66 .21 32 37.05 8.3 90 219 23 14.7 .70 .24 34 148.06 8.0 62 218 23 16.2 .72 .38 77 5.27 7.9 39 223 23 15.9 .68 .31 490 1.18 8.2 77 221 23 14.3 .68 .21 165 3.79 8.4 85 222 22 22.2 .68 .28 .09 52 111.09a 8.0 50 216 22 18.1 .69 .43 3.010 8.3 84 222 23 14.0 .69 .21 .05 69 74.011 8.2 68 224 23 17.8 .70 .23 325 8.112 8.4 87 223 23 13 .8 .71 .18 25 9.313 8.2 92 226 23 13.0 .73 .19 17 111.014 8.4 93 223 23 12.9 .72 .18 15 85.115 8.3 87 221 23 13 .2 .66 .23 .13 32 10.716 8.7 22 223 23 12.2 .66 .24 540 0.7Table 6.Total FlowPhysical/chemical data for Big Creek Hot Springs (SeeFi gure 7) on 10/3/81. Cation concentrations in ppm.650.5 LPMVent pH T"c Na K Ca Li Mg Fe Mn LPM*1 8.0 70 217 21 16.9 .74 .29 0.0 11.12 8.1 88 221 22 13 .9 .69 .19 5.63 8.3 87 217 19 13 .9 .68 .17 11.14 8.3 90 221 22 15 .1 .70 .17 37 .05 8.4 87 220 22 15 .1 .70 .23 129.06 8.0 62 220 22 16.7 .68 .30 3.77 7.9 39 229 22 15.4 .69 .26 1.98 8.1 77 224 23 15.5 .69 .23 .07 3.79 8.4 86 223 23 16.0 .68 .24 .05 111.09a 8.0 50 215 22 17.7 .68 .43 2.210 8.3 84 221 23 12.9 .70 .20 92 .011 8.2 67 228 23 19.0 .68 .25 9.312 8.4 87 224 23 13 .8 .69 .20 7.413 8.3 93 217 23 22.5 .73 .26 .02 129.514 8.4 93 217 22 13.3 .72 .21 111 .015 8.5 89 222 22 12.9. .70 .18 11.116 7.9 32 222 23 12.7 .72 .27 .05 1.9* LPM = Liters per minuteTotal Flow679.3 LPM77illl';1,:1
Table 7.Calculated source temperatures (Oe) using the Na/KF(Fournier, equation 1. Page 68), Na/KT, (Truesdell. equation2, Page 68) Na/K/Ca Li and NalLi geothermometers for BigCreek Hot Springs (~ee Figure 7).VentDateNa/KFNa/KTNa/K/CaLiNaiL i1 6123/8110/3/81234567899a10218217219216221208222217223216222217218214220217214218220219219219189188190186192176194188195187194187189184191188186188191190190190187187190188192182192191192188190187188187190189183188188187190191142 149144 157142 149142 150141 148141 147140 146142 150142 151142 151143 154141 148141 147141 146141 148142 148141 148141 148142 152141 151142 150142 15111121314218216218218217220219220189186188188188192190191187186190189190186191191142 149142 147142 151142 148144 152144 155143 153143 15578
':1]:. I!'~!i,'l ,;.1,!ilTable ) (Continued):,,'ijir~ Vent Date Na/KF Na/KT Na/K/Ca Li NaiL i:jji------------------------------I)I",q 15 6123/81 220 191 191 140 146n,:1 10/3/81 217 188 190 142 150IE1~ 'iIjf!'l:!l 16220 191 192 140 146U,I! 219 190 191 143 153mi. !1;1 x ± S. D• 218±2.7 189±3.3 189±5.2 142±1.0 150±2.8ili~----------------------------11'],inI'E Truesdell's equation (Na/KT, equation 2, Page 68). Fournier's equationIJ·',1"1.iH is based on a compromise between high albite-sanidine/water equilibriumWiland low albite-microcline/water equilibrium, while the equation derivedin!IFi by Truesdell (Na/KT) lies very close to the low albite-microcline/waterII J~!:':'i" equi 1i br i um. Since the feldspars in the reservoir rocks are lowInlalbite-microcline, Truesdell's equation probably gives the moreillII:! accurate estimate of the reservoir source temperature (189·C, Table 7).HiiIi, Na/K/Ca GeothermometerinlH~;The calculated Na/K/Ca source temperature (189·C, Table 7) is the1':1'H:I~ same as that obtained by the Na/K geothermometer. Since there areInsurface deposits of travertine at Big Creek Hot Springs, theIHii[ precipitation of Ca+ 2 from solution could lead to anomalously high1 1 .[ l'la/K/Ca temperature estimates. However, the calculated values do notIH'l'"Ii;' suggest such an increase. From the nature and form of the depos its, itI .; ~,1Wil appears that the travertine forms only after the thermal waters reach! :::d-l:!",'j;,'1P):the surface and flow into Hot Springs Creek. Resulting in sheets of1~1 ,II,! travertine formed as a cap to the spring system. The vent water showsif!l
no effervesence, but does generate gas when placed in a closed tube andvigorously shaken.The concentrations of magnesium are so low (0.2 ppm, Table Sand6) that the application of the magnesium correction to the Na/K/Cageothermometer is not necessary. C02 pressure has been neglectedbecause data are not available for C02 and because the temperature ofthe thermal waters are above 7S·C. The low Mg/Ca ratio (~ 0.015)suggests low C02 content (Page 75) and supports the hypothesis thatlittle Ca has been lost in the system before reaching the surface.li and NA/li GeothermometersThe temperature values calculated using the li and Na/ligeothermometers are anomalously low, 142 and 150·C respectively(Table 7). The temperature of the water in the Big Creek Hot Springsgeothermal system is high enough to cause alteration of felsic mineralsin the country rock to hydrothermal clays such as montmorillonite (Roseand Burt, 1979). Due to its charge (+1) and ionic radius (0.74A) thelithium ion is readily incorporated into alteration products. Thepreferential depletion of lithium, compared to sodium, in the analyzedthermal water would account for the observed depression of thecalculated temperatures.Interpretation of ResultsThe temperature calculated using the quartz-maxil~m steam losssilica geothermometer (165·C) (the silica geothermometer most likely tobe applicable to the Big Creek Hot Sp~ings system] is 24·C lower thanthat obtained by the Na/KT and Na/K/Ca methods (189·C). Consequentlythe possibility that cold shallow waters have mixed with the hot waters80
from deep in the reservoir has been evaluated using the graphicalmethod of Truesdell and Fournier (1977) described in Appendix B.The corrected quartz concentration yields a temperature of 160·C(quartz-maximum steam loss equation), an even greater discrepancybetween the cation geothermometers (29·C) than existed before themixing correction. The mixing correction also evaluates the effect ofwater loss due to boiling, which in this case is greater than watergain due to mixing, resulting in a lowered corrected quartzconcentration. Since the silica concentration of a thermal solution at189·C deep in the reservoir should be 286 ppm, silica may beprecipitating. At 189·C the temperature is at the lower end of therange within which quartz precipitates readily (White, et a1., 1971;Rimstidt and Barnes, 1977). Furthermore, it is not uncommon for thetemperatures calculated by the silica geothermometer to be slightlylower than those obtained by the Na/K and Na/K/Ca methods (Kolesar andDegraff, 1978). Additional analysis, including isotope and elementalstudies are needed to resolve this problem. The best estimate of thesource temperature is the average of the values obtained using theHa/K, Na/K/Ca, and silica geothermometers, 181·C.The minor vents that are at the peripheries of the major vents(Figure 7) have water chemistries that are indistinguishable from thoseof the major vents. The surface discharge temperature of these ventstends to be much lower due to conductive cooling by the country rock.Even vent 17, located 300 m from the main vent system (Figure 4), has asimilar pH and Si02 concentration. This suggests that at depth thewater is confined to a localized permeable channel, while near the81
surface, flow is directed by joints to various vents. Vents with highflow rates have high discharge temperatures. Vents having low flowrates and those further from the central conduit appear to undergoconductive cooling.OWL CREEK <strong>HOT</strong> <strong>SPRING</strong>SThe values of pH, rate of flow and the concentrations of variouscations are listed in Table 8. The results of the calculations for thevarious chemical geotherrnometers are listed in Table 9. The value ofsilica concentration and calculated equilibrium temperatures aretabulated in Table 12. The location of the sampled vents isillustrated in Figure 8.The low total flow (-80 liters/min, Table 8) of the Owl Creek HotSprings system makes interpretation of the geochemical data uncertain.The \'/aters may have never been very hot, they may contain an admi xtureof cooler water or the hot water may have cooled entirely bycondu ct i on.Si02 GeothermometerThe temperatures calculated by the various silica geotherrnometersare all well below 180'C (Table 12). Arnorsson (1975) suggests thatwithin this temperature range the chalcedony geothermometer is the mostappropriate; the calculated reservoir temperature for thisgeothermometer is 127"C (Table 12). Since the discharge temperaturesof the vents (50'C, Table 8) are not near boiling, the quartz-no steamloss and quartz-maximum steam loss equilibrium temperatures areprobably invalid. The calculated temperature of the amorphous silica82
i, I,;1,1:i:JIrable 8.Physical/chemical data for Owl Creek Hot Springs (See Figure8) on 6/25/81 and 10/4/81. Cation concentrations in ppm.~J !-----------------------------,]lI 1!1~1Vent pH T·C Na K Ca Li Mg Fe Cond LPM*_i 1;6/25/8148 118 6.4 12.0 .30 .05 162 14.8I:, 11 ~ ~:j 50 114 6.3 11.9 .23 .05 202 7.4I ~ ,!I'i! 3 8.4 51 119 6.2 11.6 .28 .03 190 13.0""1,, :,1 4 8.4 49 119 6.2 11.6 .27 .05 210 16.71:11 5 8 3 47 118 6'.1 11.7 .27 .05 184 14.81']1 6 8: 3 45 119 6.0 11.8 .27 .06 260 7.4fill;:i,10/4/81;!; 1 8.4 48 115 6.1 11.9 .26 .04 16.7ILl 2 8 4: '1:1 • 50 117 6.2 11.9 .23 .05 7.4W' 3 8.4 50 128 6.2 11.5 .24 .03 13 .0Ii! 4 48 115 6.2 11.7 .23 .08 .06 16.7iii 5 8.3HI 8.3 48 117 6.0 11.6 .25 .07 .05 16.71;,1 6 8.3 46 115 6.0 11.9 .24 .08 .05 11.1IIIl't"j ~"i;I,il:'IFP' * LPMl1'j= 1Hers per mi nute6/25/81 Total Flow 74.0 LPM10/4/81 Total Flow 81.4 LPM11', equilibrium is below the discharge temperature and, therefore, it isIiii!i invalid. The alpha and beta cristobalite equilibrium temperaturesIi]lJ"1(101·C and 52·C respectively, Table 12) are plausible, but it is moreIi!!.Inill! likely the chalcedony equilibrium is correct.iF Na/K Geothermometerif i)iii! The Na/KT geothermometer (Truesdell, 1976) is appropriate for OwlI", "J1;)1ii: Creek because the country rock contains albite-microcline feldspars.Hjl)1'The reservoir temperature obtained (127·C, Table 9) is in remarkablein II, agreement with the chalcedony geothermometer (also 127·C) . despite the,:1ii'i fact that the temperature is well below 180·C. Rel iable results haveir[: i '1;,1 occasionally been obtained down to 100·C with waters that are low in1i '1Il:il cal c i um (Fou r n i er, 198 1) . The Na/K ratio of 20/1 is just within theIfllIlllimHs suggested by White (1970).,j,ii,,,I'ii83
Calculated temperatures ("C) using the Na/KF (Fournier.equation 1. Page 68). Na/KT, (Truesdell. equation 2.Page 68) Na/K/Ca. Li and NalLi geothermometers for OwlCreek Hot Springs (See Figure 8).vent Date Nd/KF Na/KT Na/K/Ca Li NalLiB=1I3 B=4/3 B=5/61 6/25/81 169 129 99 147 121 116 13410/5/81 168 128 96 147 121 112 1272 171 131 97 148 121 108 118168 128 97 147 120 108 1193 167 127 98 147 121 113 128168 128 99 147 120 109 1204 166 126 98 146 121 113 127169 129 97 147 121 108 1175 166 126 97 146 120 113 128166 126 96 146 119 110 1236 164 124 96 145 119 109 117167 127 95 146 119 109 120~ ± S.0 . 167 127 97 147 120 111 123±1.8 ±1.8 ±1.2 ±O.S ±0.8 ±2.6 ±5.9Na/K/Ca GeothermometerThe wdters of Owl Creek Hot Springs are at the borderline at whichB is selected to be 4/3 (temperature
calculated using an average value for a of 5/6. The calculatedtemperature of 121°C (Table 9) is in close agreement with thetemperature calculated using the chalcedony and Na/K methods.The low (97°C) temperature calculated could be due to dilutionwith shallow waters which could depress the calculated Na/K/Catemperature, although depression of the chalcedony and lithiumtemperatures would also be expected, but is not observed. Themagnesium concentrations (0.05 ppm) are far too low to apply thecorrection suggested by Fournier and Potter (1979) and the temperatureis too high to apply Pace's (1975) C02 correction.Li and Na/Li GeothermometersThe temperatures estimated using the Li+ and the Na/Ligeothermometers (111·C and 123~C, respectively, Table 9) are inapproximate agreement with the chalcedony, Na/KT and average Na/K/Catemperatures. The equilibrium temperatures for Li and Na/Li areapparently not greatly depressed, as were those at Big Creek HotSprings. Since the temperature conditions in the Owl Creek Hot Springsreservoir are not as extreme, the degree of alteration of felsicminerals to clays is probably not as great. High temperaturehydrothermal clays may be totally absent and as a result the lithiumion concentrations in the water are unaffected.Interpretation of ResultsThe close agreement of calculated temperatures of equilibrium forthe chalcedony, Na/KT, Li and Na/Li geothermometers indicates thatlittle or no mixing with cold shallow waters has occurred. When themixing model of Truesdell and Fournier (1977) was applied (Appendix B),85
an anomalously high source temperatures (171·C), degree of mixing (45%hot water) and water loss to boiling (18%) were obtained. The closecorrelation of the chalcedony and lithium geothermometer temperatureswith the temperatures obtained from geothermometers based on cationratios is strong evidence against mixing. The low (97·C) temperatureobtained from the Na/K/Ca geothermometer is probably due to the factthat the system lies close to the limiting temperature at which thevalue of e changes from 4/3 to 1/3. For use in depth of circulationcalculations, an equilibrium temperature of 127·C (the value obtainedusing the chalcedony and Na/KT geothermometers) w"ill be used.The uniformity of the water chemistry in all of the vents suggests·that the flow system is confined to a localized permedble channel atdepth, similar to Big Creek Hot Springs. It is only near the surfacethat the thermal water flow separates to the individual vents. Thedispersal of the water and relatively low flow of the system causesconductive cooling to the temperatures observed at the surface.HORSE CREEK <strong>HOT</strong> <strong>SPRING</strong>SThe values of pH, rate of flow and the concentrations of variouscations are compiled in Table 10. The results of the calculations forthe various chemical geothermorneters are given in Table 11. The valueof silica concentration and calculated equilibrium temperatures aretabulated in Table 12. The location of the sample vents is illustratedin Figures 9 and 10.The Horse Creek geothermal system has two distinct vent systems(Figure 6). The HC1 area (Figure 9) is small in extent, but has veryhigh flow rates of 289-352 liters/min (Table 10). This is above86
i~Fournier'slower limit of 185 liters/min for the classification of the1Spring as one of high flow. Hot springs with high flow rates areII,~ '1'jgenerally unaffected by conductive cooling and tend to vent at',Il(II> ,temperatures close to those reached in the lower levels of thej:i!geothermal reservoir, except for those that equilibrate at telTlleratures:l'above boiling, which will boil during ascent.The second area, HC2 along Lindgren Creek, (Figure 10) has ventsdistributed over a large area, but the total flow is only 44 liters/min(Table 10) for the whole vent system.distributedthe totalThere are many small seepsbetween the major vents that do not substantially add toflow of the system.GeothermometerThe Na/K ratios of 45/1 at HC1 vents and 35/1 at HC2 vents arewell above the 20/1 limit suggested by White (1970).The reservoirtemperatures (40-60·C) indicated by the Na/K/Ca and a-cristobalitegeothermometers (Tables 11 and 12) are below the 1S0·C suggested foruniformly accurate results (Fournier, 1981) and the 100·C lower limitfor the use of Na/K equilibrium.However, the Na/KT equilibrium values(Table 11) obtained for HC1 (73·C) and HC2 (SO·C) are not greatly outof agreement with other indicators of reservoir telTllerature.I~a/ K/Ca GeothermometerThe Na/K/Ca equilibria is suggested to be the most accurate forsystems of relatively low temperature (Fournier, 1981).rate of the HC1The high flowsystem would allow little conductive cooling of thethermal waters as they rise in the reservoir, therefore, in a spring ofthis type it would be expected that the temperature of the Na/K/Ca87
, iJ!..II~ IjiilIlilTable 10. Physical/chemical data for Horse Creek Hot Springs (Seeiii Figure 9 and 10) on 6/21/81. 9/19/81 and 9/18/81. Cation)ficoncentrations in ppm.!1.:!!j---------------------------39 39 1.24 5.9 0.03 0.05 0.08 210 20039 40 0.97 6.0 0.03 0.02 200 8940 40 0.87 6.3 0.06 0.02 22240 43 0.84 6.2 0.02 0.02 13051 54 1.5 3.9 0.05 0.03 7.441 54 1.4 3.9 0.05 0.02 11.117 50 1.3 5.3 0.03 0.20 0.35 9.322 55 1.7 4.1 0.06 0.07 0.12 5.616 41 0.9 5.9 0.0 0.17 0.10 4.413 52 1.6 4.5 0.07 0.14 7 .4HC1 6/21/81 Total Flow 289 LPMHC1 9/19/81 Total Flow 352 LPMHC2 9/18/81 Total Flow 45.1 LPMCalculated source temperatures ("C) using the Na/KF.(Fournier. equation 1. Page 68) Na/KT. (Truesdell.equation 2. Page 68) Na/K/Ca. Li and Na/Li geothermometersfor Horse Creek Hot Springs (See Figure 9 and 10).Na/ K/Ca Li Na/Li120 73 49 60 65136 91 43 58 62108 60 39 53 45114 66 39 76 104120±12.0 73±13.4 104±7 .4 43±4.7 62±9 .9 69±2.5129 83 66 69 71124 77 64 68 69125 79 55 60 56133 87 69 73 78115 68 41134 88 65 76 89127±] .0 80±7.4 113±6.9 60±10.4 69±6.0 73±12.188
II '~"1.'.1Silica concentration (ppm) and calculated sourcetemperatures (·C) for Big Creek Hot Springs, Owl CreekHot Springs and Horse Creek Hot Springs (See Figures7,8, 9 and 10). T1-T6 are the results of the varioussilica geothermometer equations (8-13) listed on Page 73.V~nt Date Siil']1,Equation' 8T1BCHS2BCHS23/24/8210/3/8117418817117616116514815412112671764852""IiECHS14 3/24/82 193 178 166 156 128 78 54~CHS14 1013/81 190 176 165 155 127 77 53II:![BCHS17n>~l,iillOC 2tlOC 2~:ii 1HC1-1'HCl-2t.l'~iHC2-2'II~C2-33/24/82 157 164 155 141 114 64 413/25/8210/4/819119/819119/819118/819/18/81129129861071121531521521291411441629T214514512613613815410T312712710111511813911T41011017890931122)"1p,:'Ii';;geothermometer should be close (± 25·C) to the measured surface1},sCharge temperature. The two temperatures (Table 10 and 11) are~~lmost identical, particularly for the sample set taken on 9/19/81;H~l40·C surface temperature vs. 40·C calculated subsurface temperature).~p~~his concordance is a strong indication that there is little or no~I;!I,ixing of the thermal waters with cold shallow waters.tfl.~trThe calculated Na/K/Ca equilibria temperature (Table 11) for theIt]HC2 vents is 65·C. All of the discharge temperatures are lower thanlj'iil:ithis value. but the low flows observed would allow some conductiveIcooling to occur before the water reaches the surface.i'it; and NaIL; Geotherrnometers~ i~'~I, !1 The concentrations of Li+ are very low in all of the Horse Creekhll~waters. The calculated Li+ equilibrium temperatures (Table 11) for HC1\1. '1~ 89tIlr'!:j12T552523042446313T6303010202240u'!'I
(67'C) and HC2 (69"C) are similar to the temperatures obtained usingother geothermometers. The Na/li temperatures (Table 11) are slightlyhigher, 69'C for HC1 and 77'C for HC2.The lithium concentration (Table 10) is 0 for vent HC2-5 anddepleted for HC2-3 (Figure 10). Both of these vents are in soilcontaining clays which may be adsorbing the lithium ions.5i02 GeothermometerFor the HC1 vents all of the silica geothermometers except Scristobalite and amorphous silica give temperatures (Table 12) that areequal to or greater than the observed discharge temperature (40'C,Table 10). The quartz-no steam loss and quartz-maximum steam loss arenot applicable, since cation geothermometers indicate temperatures farbelow the 180'C limit for the use of these geothermometers (Arnorsson,1975). White (1973) suggests that, below temperatures of 140'C,amorphous silica and S-cristobalite are the characteristic form ofsilica present. The average calculated S-cristobalite equilibriatemperature (36·C, Table 12) for HC1 is in close agreement with boththe discharge temperature (Table 10) and Na/K/Ca source temperature(40'C, Table 11).The same conditions govern the choice of which silicageothermometer to use for the waters of the HC2 vents. TheS-cristobalite equilibrium temperature (53'C, Table 12) is close to themaximum observed discharge temperature (51'C, Table 10) and the Na/K/Catemperature (65'C, Table 11).90
Interpretation of ResultsThe temperatures obtained for the various geothermometers are inagreement. The close correlation of the equilibrium temperaturesthe surface discharge temperatures indicates little or no mixingcold shallow waters. The high pH values also support a no mixing1985).The high flow rate of the HCl system, from only two vents, isunique in the study area. White (1973) observed that low temperaturesprings often discharge in large single vents. Flow may increase withtime in these systems, due to the increase in porosity caused by theleaching of silica from rocks in the reservoir.Despite the low flow rates, which allow conductive cooling of theHC2 vents, the surface discharge temperature of the HC2-1 vent is 10·Chigher than the discharge of the HC1 vents (50·C and 40·Crespectively). This, in conjunction with higher source temperatures(-70·C and 40·C respectively), suggests that the two vent systemsoriginate from different levels within the geothermal reservoir, theHCl vents tapping the reservoir at a shallower level. Most of thewater in the system is discharged at the HC1 vents, but a small portionof the water is retained and migrates to a deeper level before risingto the surface at the HC2 vents.ASSESSMENT <strong>OF</strong> RESERVOIR TEMPERATURESThe calculated source temperatures, for the variousgeothermometers, are in reasonable agreement in all three of the hotspring systems studied.91,I
:,ftIillif:~i, , Big Creek Hot Springs and Owl Creek Hot Springs have source~f:lI~:temperatures of 181·C and 12rC respectively. The Horse Creek Hotre,;I 'j::ij~pringsIsystem has vents that indicate two temperatures ofcr·1U~~qUilibration, thermal water discharging from vents on Horse Creek andI''I:~l~ents on Lindgren Creek apparent ly equ i 1i brated at 40·C and 70·e'I~ I iit,I~:respectively.I :1:!{'I ~UNON<strong>THE</strong>RMAL <strong>SPRING</strong>S IN <strong>THE</strong> AREA:1 During the course of the field investigations for this report'.i.: ..·ll'.,ii~ ;1:1 ilhumerous springs, not recognized as being thermal "in origin, wereiI:1II~nvestigated.Springs in the general region (Figure 1) and in the!l:local areas of the thermal springs were investigated.H:The temperature,i'i;1 ::'pH and conductivity of regional springs are tabulated in Table 13.HIiI ~IMore detailed chemical analysis was carried out on springs located in'-"j'!:1 ftiiJ1~he local area of the hot spring systems. These data are given in~,!' :II'II(hable 14. No local springs were found in the Owl Creek area.III'iThe springs in the Hot Springs Creek headwaters and general regionIriOf Hot Springs Creek (German Gulch, Big Lead Mine, Dry Gulch, and SageIlilBrush, Figure 1) have pH values that are nearly neutral at 6.7 to 7.4.~UTheir temperatures range from 6 to 12·C (Table 13). These waters are~, II~ ;'1'Hlow in sodium, potassium, and magnesium, but high in calcium (TableIi'~.;'! '1 14) .f ! lIIiThe springs within the Horse Creek study area are weak ly acid to;j:neutral in pH (6.1-6.9), and very low in sodium, potassium, magnesium,iiii:}'ifland calcium (4,1, and 10 ppm, respectively, Table 14).~:None of the springs investigated outside of the vent areas haveI:in!), any of the characteristics that suggest the presence of geothermalilijH~ 92ii"iIi':: ,
1,tl~i: 'components. All of the geothermal springs have high pH values:1{~.2-9.0) that distinguish them from nonthermal springs which areii',I'slightly acid to neutral in pH. In nonthermal springs calcium is+!;typically the dominant cation and sodium is much lower than in hot,IH[$'pri ng waters.i1:,1~ndiii'ji~1:The discharge areas of the thermal systems are discretevery limited in their extent.~)fable 13. pH t temperature t and conductivity of nonthermal~L springs in the Shoup Geothermal Area (see Figure 1).ill!liS i tei'Number Location Spring NamepH 'Cil!!'!II,;!IiiiSlS21:)1;:11S3;.1'1~l,:'I'~, :1:(11S4~j : S5f."~l i!',:i ~tS6~li;11 S7tj~j"
VI. DEPTH <strong>OF</strong> EQUILIBRATIO"INTRODUCTIONIn order to use the geothermometry data to determine depth ofcirculation and fracturing, the geothermal gradient for the area mustbe known. There ha ve been no di rect measurements of the geotherma 1gradient in the southern margin of the Bitterroot Lobe of the Idahobatholith nor in the Precambrian rocks exposed in the Salmon RiverArch. Consequently, an estimate must be made using other currentlyavailable information. Thus the geothermal gradient assumed in thisstudy is tenative.SOURCES <strong>OF</strong> HEATGeothermal systems can be subdivided according to their heattransfer regimes into convective or conductive. The three systemsstudied are all in fracture zones within low permeability crystallinecountry rocks and are convective in nature, the water is heated atdepth by conduction then h~at is carried to the surface by thecirculating fluid. The temperature of the upper portion of the systemtends to increase and in the lower decrease.There are two domi nant sou rces of heat in the lower port ions ofconvection systems: 1) residual heat from the cooling of young shallowigneous intrusions; and 2) radioactive decay of unstable isotopes,predominantly the U238 , U235, and Th232 decay series and K40 (Rybach,1981). Furthermore, since all three systems are located in fault andfracture zones any mechanical heat generated by displacements(Patalakia et al., 1979) will be transferred to the fluid circulatingthrough the fault zone.94
Interaction of circulating fluids with young igneous intrusions isa heat source for high temperature geothermal systems that haverecognized potential for development of electrical generation capacity(Muffler &Cataldi, 1978). There are only small outcrops of Tertiaryigneous rocks at Hot Springs Creek and Owl Creek. At Horse Creek anabundance of Tertiary igneous rocks are present in the form of thePainted Rocks Lake pluton.Estimates for the duration of cooling of igneous intrusions varyfrom 2 x 10⁴ years (Cathles, 1977), 105 years (Norton and Knight,1977), and 2 x 10⁶ years (Rybach, 1981). The age of the Tertiaryigneous activity (50 M.Y; Daniel and Berg, 1981) in the study areasuggests that any residual heat associated with the intrusive event haslong been dissipated. Heat sources of this type are usually from muchyounger intrusions such as the 1.1 to 1.4 M.Y. Valles Calderaundergoing development as a hot dry rock geothermal reservoir in theJemez Mountains of New Mexico (Laughlin. 1981).In crustal rocks away from major tectonic belts the major sourceof heat is from radioactive decay. The geochemical behavior of U. Th.and K determines their distribution in various rock types; radioactiveelements are concentrated in silicic rocks (Rybach. 1976). Inmetamorphic rock. regardless of bulk chemistry. the content ofradioactive elements is typically depleted by the upward-moving fluidphase during metamorphism (Hamza and Verma. 1969).Swanberg and Blackwell (1973), Larsen and Gottfried (1961),Bennett (1980). and Motzer (1981) have all pUblished reports concerningthe content and concentration of radioactive elements in Tertiary95
ntrusions in the region surrounding the area studied (Figure 15).of information from the four sources is presented in Table 15.n addition, Swanberg and Blackwell (1973) divided the Idaho batholithnto four parts and assigned heat generation capacities, due tooactive decay, measured in heat generation units (1 HGU = 10- 13l/cm3 sec; A,Table 15) as follows:western border group - 0.8main group - 2.6intermediate group - 3.6epizonal Tertiary group.- 6.1.igneous rocks of the Painted Rocks Lake pluton at Horse Creek areof the epizonal Tertiary group.rovides approximately 13 HGURadioactive decay in this unit(Bennett, 1980) making it almost fourmore radioactive than the main group in the batholith. This highof radiodctive decay probably accounts for most of the heatsupplied to the Horse Creek geothermal system.The other two geothermal systems, however, are located inmetamorphic terrain. This terrain is within the triangular regionbounded by the Painted Rocks Lake pluton to the north, the Leesburgstock to the east, and the Bighorn Crags pluton to the west(Figure 15).All three intrusive bodies are three to four times moreradioactive (resulting in 10-15 HGU) than the rest of the Idahobatholith (Table 15).Little data is available on the metamorphicrocks themselves. A sample of the augen gneiss near Shoup contains 3.6ppm uranium (Larsen and Gottfried, 1961).AThis value is close to thatpresent in the Lolo batholith (4.3 ppm, resulting in 6.5 HGU), in whichradioactivity is twice as high as the rest of the Idaho batholith96
+----:r-::;;~--r_-.L----r_L_----....L--------_ _+46° 0"NPAINTEDROCKSLAKEPLUTONSALMONBIGHORNCRAGSPLUTONCASTOBATHOLITHCHALLISo, ' , , ' ,o 10 20 30 40 50KILOMETERSFigure 15Location of epizonal Tertiary plutons in and around thestudy area (adapted from Bennett, 1980).97
~,~ 0 _~ - - ~ ~_~-"~~_"'~_~"'=_~~=_~~_~__Table 15." Evidence of radioactivity inepizonalTertiaryplutons bordering the';~;::;;'~c;2=·'"":;~·;;:-=-'-:L',;~;~,_"o;::::~;f(jah'o":':b'athcrfifh::':'-","COmpcfTe:(j,,-:fr orii~l:"d-rs-en'2"ancd" Got'fffi e
(Swanberg and Blackwell, 1973). It appears that the decay ofradioactive isotopes may also be the dominant source of heat in themetamorphic rocks of the area under study.Circulatory systems tend to be established in and around plutonsduring intrusion (Cathles, 1977; Norton and Knight, 1977). Usingoxygen isotope and D/H data, Criss and Taylor (1983) demonstrated theexistence of such convection systems during the emplacement of Eoceneplutons in the southern half of the Idaho batholith. The northernmostcirculation system studied was about the Bighorn Crags pluton west ofHot Springs Creek (Figure 15). The convection cells extended from 1 to15 km from the edge of the intrusions into the country rock. Similarconvection systems may have been generated around each of the epizonalTertiary plutons. It is common for convection systems to extend up to30 km from such intrusions (Fehn et al., 1978). The fluids containedin these hydrothermal convection systems typically leach uranium fromthe plutons. and deposit it forming uranium-rich regions in rocksadjacent to the plutons (ibid).The metamorphic terrain in the study area contains fracture zonesthat trend in preferential directions due to anisotropic fabric in therocks. Some of these fracture zones, such as those at Hot Springs andOwl Creeks, may date to Precambrian time and have been intermittantly. active since. The convection systems generated around the plutons(Bighorn Crags pluton, Leesburg stock, and Painted Rocks Lake pluton)may have flowed through these preexisting fracture zones enriching themwith uranium, resulting in anomalously high heat-generating capacity.99'1'~'
1:liii ~hf;l,iflHEAT FLOW <strong>AND</strong> GEO<strong>THE</strong>RMAL GRADIENTq'j:L~1 Heat is transferred to the earth's surface by three methods:r:~bnduction,convection in hydrothermal fluids and mass transfer inmkgmas (White, 1973).~liIII The dominant mode of heat flow in most areas is conduction. In!I!these areas the observed surface heat flow (Qs) is consistant over wideiii"I~reas and varies little with time. The geothermal gradient (r) may~l'~ary"I"both horizontally and vertically as the thermal conductivity (K),~ineralOgy,porosity and pore fluid content of rocks varies. The~jlI~ : i~elationshiP between surface heat flow, geothermal gradient, andthermal conductivity is expressed by Fournier's Law,H,tJi~here",r = Qs/K X 100r is expressed in "Clkm; Qs in terms of heat florl units (HFU) or~cal/cm2sec; and K in mcal/cmsec "C (White, 1973). The relationship is~otvalid in subsurface areas that have heat transfer from convectionil,!'"l,:',S,·,(stems or mass move~ent of magma.,~ In some areas, ln near-surface rocks of the crust, heat is"'I'l~enerated by radi oact i ve decay. A linear relationship exists betweenI,!::fo"ipbserved heat flow and observed heat generation in near-surface rocks~Lachenbruch, 1970). The relationship istill:,!,i!~herei!i'~,J~~antleQs = Qm + DAQs is the surface heat flow in HFU; Qm is the heat flow from thein HFU; A is the radioactive heat production of the surface rock111~n heat generation units (HGU); and D is the depth or thickness of the!I:fueat-generating rocks expressed in centimeters.!j••,r,1IJ.h Il'i,~jlfi~,,·~,l', t :} " 100;1'Combining the linearil:,',I'l
heat flow relation and Fournier's Law gives an expression for thegeothermal gradient in terms of A, 0, K, and Qm:r = Om + AD X 100KThe value of A chosen for each of the study areas without specificdata is somewhat arbitrary. The Painted Rocks Lake pluton has a levelof radioactivity similar to that found in the Twin Springs plutonin which A has been found to be 13 HGU. The Hot Springsfault is located near the Leesburg stock (Figure 15) which has aray spectroscopy count higher than either the Twin Springs or thePainted Rocks Lake pluton (Table 15). If a convection system existedaround the Leesburg stock, the Hot Springs Creek fault may have beenenriched with radioactive elements to a level at least equal to that inthe originating pluton. Owl Creek is the farthest from any of theTertiary plutons, but still well within the 30 km thatcirculation systems can extend from such intrusions. Fracture zonesoriented NW and NE in the Owl Creek area are oriented towards thePainted Rocks Lake and Bighorn Crags pluton, respectively (Figure 15).the surrounding Tertiary intrusions and fractured Precambrianthe values of A (in HGU) have been estimated to be: 13 forHot Springs, 10 for Owl Creek Hot Springs, and 13 for HorseHot Springs.Clark (1966) lists the range of the value of K for granite fromto 8.6. An average value of 7.7 will be assumed for the studyThe northern Rocky Mountains are considered by Roy et al. (1972)101
and Sass et ale (1981) to be an extension of the Basin and RangeProvince. Qm for this area is listed by Sass et ale (1981) as 1.4HFU. Seismic refraction studies indicate that the silicic crustalthickness in the region is 20 km (Hill and Pakiser, 1966).The use of these values in the thermal gradient equation (Page101) gives a thermal gradient of 51°C/km for Big Creek Hot Springs,44·C/km for Owl Creek Hot Springs, and 51·C/km for Horse Creek HotSprings. The calculated surface heat flows (Qs) of 4~0 HFU, 3.4 HFU,and 4.0 HFU respectively, are high but in agreement with the projectedvalues for the area of >2.5 given by Lachenbruch and Sass (1977) andSwanberg and Morgan (1977).The corresponding depths of circulation are 3.4 km for Big CreekHot Springs, 2.4 km for Owl Creek Hot Springs, 0.5 km for the shallowhigh-flow portion of Horse Creek Hot Springs, and 1 km for the deepportion of Horse Creek Hot Springs at Lindgren Creek.102
'!1U:(i!;l'4,t((I:iJilri..iq~ri~\; !~l:~J~j::1'VII.FRACTURE PERMEABILITY, MECHANISMS,STRUCTURE <strong>OF</strong> <strong>THE</strong> HYDRO<strong>THE</strong>RMAL SYSTEMSINTRODUCTIONThe flow of fluids in low permeability rocks, such as theHi'~frystalline igneous and metamorphic rocks in the area of this study,':j~~equires;!~I ithe presence of fissures and fractures to act as conduits forbadvective fluid flow.H:;fl:iJ~an<strong>AND</strong>The conditions required to support fluid flowbe regarded as a "percolation problem", in which a rock body is~r:'I'~~ermeable if there is a channel of connected cracks extending through,Wj[Ii t . This resolves the problem of water flow in crystalline rocks toFl'a!ICho:sg::::::n: ;:::i::a: o:~ . ~f 1::::~dY nami cs. as in porou srocktIiI~ Since individual fractures in nature are not infinite in extent, a'li~fracture density must exist that is high enough to insure an adequate~I :I~egree of connectivity in the system. The fracture density required to"l?ustain advective fluid flow is termed the "percolation threshold":')'~jMarSilY, 1985; Chelidze, 1982). Below the threshold finite fractures~TayIlfone.be connected, but only in small localized regions within a fractureAbove the percolation threshold localized regions become~}nterconnected within the fracture zone and flow can take place. WithJ!~~ontinued increase in fracture density the zone becomes increasinglytimore per vi ou s.it]11: The parameter that determines the percolation in cracks isl I!~xpressed asiIi~l~(~j'!'~ ii!!+f: ,~f,ill' 103i,,'r!I' ~,
,11,~r:H,:.jIiI':I'where N is fracture density (number of fractures per unit volume) and~I'tlll1 is equal to fracture length times TT/2.~l:'l~!j(RivierI\!j!',i:l~i:iII:!~1:iDuringtl ;et a1., 1985) has been found to beThe percolation thresholdthe course of field work in the area the density of fractureIl::::::~:a::l:h:::re:o::sl:::t:o:::·ha::P:c::::I:;d:;i:U:: :::::ur;:I:lr'giVeS values of Nl12 of 30 to 120, well above the percolationIUJlthreshold In addition, anisotropic rocks which have preferrede11::: ::::::i:: :~a;::~:r:::~:::: ::::a~ :::r (:::~: :::: 0:9:::~ShO 1 ds in'IJ'consequentlY, all fracture zones in the study area have potential toHserve as conduits for fluid flow.In contrast, typical fractures In!!:the surrounding country rock have Nl12 values of approximately o.o!.Ii,!BIG CREEK <strong>HOT</strong> <strong>SPRING</strong>S'fIIIn~ ,,,IThe Hot Springs Creek fault provides conduits for the Big Creekil'Hot Springs hydrotherma 1 system.LiThe NE-trending fault system that'11!dips 70 to 80· to the SE extends from Panther Creek, through the study~ '111: 1ljllarea, to the Pine Creek fault 4.8 km to the NE (Figure 3) (Maley,!1:(1974 ) ._The width of the Hot Springs Creek fault zone varies with theIli,!1Ithol09y and fabric of the rocks within which It is locatedi~(Figure 4). At the upper reaches of the drainage basin the fault is in!fj.I..::]' 104~. :1I Iii!Jj'i;~::t ~:: i:: ::et:: ;:I:::et:e a::a::~ it;h:e::::no:n:::sV::: 0: ~:::~:
',.,:,:,1n:t(t~1. ih,!'IjnLji;;;i'anisotropic fabric.:'t~ 1~~lthOU9hThe quartzite also has an anisotropic fabric,not as strongly developed as that in the augen gneiss. The~Hll!excellent to moderately developed anisotropic fabrics in the two rockHi!lunits have their dominant linear trends either parallel or normal toillGthe fault. With high preferred fracture orientation the fault zone is'j~1 .;~tRnarrow and has high fracture density. This region is the source for,iji:1ll~ost of the water in the Hot Springs Creek drainage basin. The area of~J:11 [irecharge for the geothermal system may be located where, two tributary','I '!I;;1~breeksTflow from the SE across the fault zone into Hot Springs Creek"H~il{Fi gU~:e 3 ~ ~t1'1lt~uartziteSpri ngs Creek fau It extends in the augen gne iss andto a point 1,070 meters above the vent site, at which theil!naugen gneiss contacts the quartz-feldspar-biotite gneiss on the northsri'Iiii:J~j IiI~ni de of the f au lt (Fi gure 4). The quartz-fe 1dspar-bi ot ite gnei ss hasanisotropic fabric possibly stronger than that in the augen gneiss.ItonseqUentlY, the geometry of the fracture system in the Hot SpringsrCreek fault undergoes little change.'i,11On the south side of the fault the ellipsoidal gneiss contacts theI,jIL~uartz ite 700 meters above the vent system (Fi gure 4), where a majorIl:phange in fault zone geometry begins.~bOOrlYThe ellipsoidal gneiss hasdeveloped anisotropic fabric, characterized by a faintIii!Itoliation, that offers no preferred fracture orientation. The faultltone begins to widen south into the ellipsoidal gneiss and fracturesIi!iibecome more widely spaced, while fracture density and intersectionsi!i1ecrease.~ II,i IAdjacent to the quartz-feldspar-biotite gneiss the fractureIzone is still narrow with high fracture density.Iil'~)~il 105'1'North of the fault
quartz-feldspar-biotite gneiss again contacts the augen gneiss 370s SW of the vent system (60 meters SW of the isolated HSC-17 vent,Beyond this point the Hot Springs Creek fault achieves itsgreatest width (up to 1 km); almost all of the fracture cleavage isconfined to the ellipsoidal augen gneiss and .fracture density fallsdramatically. The dominant orientation of fractures in the anisotropicaugen gneiss north of the fault also changes when the isotropic.ellipsoidal gneiss is contacted across the fault. Rather thanfracturing parallel to the fault (NE normal to the dominant lineation)the augen gneiss fractures normal to the fault (NW parallel to thedominant lineation). The resulting fracture sets are joints normal tothe foliation that are very uniformly spaced 60 to 90 cm apart andextend for distances up to 90 m from the fault zone. Further northfrom the fault zone this dominant joint pattern subsides.Maley (1974) indicated that there was some evidence for thecontinuation of t~e Hot Springs Creek fault SW past Panther Creek upClear Creek (Figure 1). Specifically, Cater et ale (1973) placed afault along Clear Creek 13 km SW of Panther Creek. However, neitherMaley nor this author found evidence (fracture zones) of this directlyadjacent to Panther Creek. lopez (1981) believes that the Hot SpringsCreek fault continues to the SW, but mentions a fracture zone up to0.5 km wide. The presence of nonthermal springs (S-4 and S-5,Figure 1) suggests that there may be some type of tectonic activityalong this trend, as other springs (M-i, M-2, S-I, S-2 and 5-3,Figure 1) exist to the NE along the known fault zone to its terminationat Pine Creek.106
The pattern exhibited by the Hot Springs Creek fault, as it entersthe ellipsoidal gneiss and imbricates, is that of a splay fault.Typically splay faulting occurs near the ends of the original fault; (Anderson, 1951); the accommodation of strain at the end of the faultis spread over a large volume of rock. The reason that the Hot SpringsCreek fault splays or imbricates as it approaches Panther Creek may bedue to the loss of preferred fracture orientations in the highly. anisotropic augen gneiss, quartz-feldspar-biotite gneiss, and themoderately anisotropic Yellow Jacket quartzite. The ellipsoidal gneissis massive and offers no preferential fracture directions.Consequently, the strain along the fault is dissipated into a largevolume of rock, resulting in dispersed (if any) fractures SW of PantherCreek.The disappearance of a single narrow fault zone with high fracturedensity forces the water in the hydrothermal system to the surface.The vent site at Big Creek Hot Springs is the result of the loss ofpermeability within its convection system. The fractured anisotropicquartz-feldspar-biotite gneiss acts as a permeable conduit at the edgeof comparatively impermeable fracture zones and country rock.OWL CREEK <strong>HOT</strong> <strong>SPRING</strong>SThere are three directions of fracture evident in the area studiedat Owl Creek (Figure 5) NW, N, and NE. All three fracture sets maydate to structural trends that developed during or shortly after thefirst deformational event during the Precambrian. Ruppel (1982)suggests that the NE-trending fractures have remained inactive sincethe Miocene, whereas the Nand NW fractures have had recurrent107
iil:r::'imovement, possibly recently..;~Springs Creek fault.'n iHowever, the existence of an active Hotindicates some current activity along NE-trending;)fraetures in the study area and Kii lsguard and Lewis (1986) bel ieve
;i!N':;.':t=;,,:Ii,:~j :if;!Isouth). There are also extensional fracture fillings on cross joint;: ~ i:isets oriented normal to the b lineation (45·/70·SE).-'I:if,:f1: The recharge area could be along Owl Creek or its east fork. Near,I"~h&Ithe southern tip of the northeast block, fractures may possiblyW;:j:traverse across from Owl Creek to the east fork and its associated~r~r.Jtj'fault zone (Figure 5). Also, there is a NW-trending fracture zone thatrj!ll ..begins in the northern margin of the southeast block and whose trendII::1L'wou ld intersect at the hot springs vent site (Fi gure 5).. Recharge fromili.:lthe north cou ld come from where the N then NW-trending, fracture zone1\\',crosses Owl Creek.!1ii-JIn general, the vent site is controlled by its location in theIIi!liicorner of a faulted block (Figure 5). Specifically, the vent site is'1'Ijl,:,rrobabl Y controlled by the reverse fault exposed on the east side off'Owl Creek (Figure 8). The fault has been eroded exposing an openil!1lfracture up to 20 cm in width. The fault plane, when projected, is!III'I!,approximately 25 m below the vents on the west side of Owl Creek.'Il"li , ,I·i,IHORSE CREEK <strong>HOT</strong> <strong>SPRING</strong>Sf:1'H The convection system at Horse Creek is in the border zone of the~ 'iI"/:J:contact of the Painted Rocks Lake pluton and augen gneiss (Figure 6).I~orse Creek flows NW across the augen gneiss in a course that is normallj!to the fol iation strike trend (30·).H:1l:ifracture patterns generated during Precambrian time.l!::,!iJIts course may be affected byNortheast of theil1stream the augen gneiss shows diverse foliation orientations, numerousI~racture~l:zones, and injection of relatively massive porphyritic quartz!1'1latite dikes. To the southwest foliation in the augen gneiss shows1;1~, d'1:1,'~llr~!IiiI ::i 109~' !,1:';:
lhf~onsistent orientation and quartz latite dikes are rare and, when1:1.:Jl,:it!present, small (Figure 6).::1'1'I! Along the contact of the augen gneiss and the Painted Rocks LakeIIIi iRluton microgranite has been intruded and undergone ductile and brittle~l:jf~atac1astic deformation.(:1;hr.lt~hei\'!~hase~hThis contact zone is roughly conformable withfoliation of the augen gneiss, dipping approximately 35- to the NW.;~recambrian'l,~lil(1973) observed a similar contact relationship betweenmetamorphics and the Idaho batholith to the northeast of~he Horse Creek study area.~r;:11.:~xistThe microgranite border group does notalong the entire contact between the augen gneiss and the quartzill~onzonite, and the catac1astic zone is not well developed throughout~1' ;\h ~the microgranite border (Figure 6). Horse Creek flows across theil:1'hortheast margin of the highly fractured zone in the micrograniteI" ~I'i'; I ~!1~Fi gure 6).I The main and minor vent sites are along a N 60- Wtrend that can~e extended to the SE to Horse Creek as it crosses the fractured border~;crOgranite.!li'l~.!I:t~C2)!li!~~undWhen the vertical trend is calculated, using the depthsequilibration for the two vent sites (0.5 km at HCl and 1.0 km atand the horizontal distance between the vent sites (1.1 km), it isto be along a 35- incline parallel to the dip of the augen gneiss'!t:01iation. The SE projection of the trend to the surface, indicatesll!iIthat the recharge area is where Horse Creek crosses the fractured,11:1"1'1border microgranite.HilI~ The driving force for the upwelling of water at the HC2 (Lindgren't!;'reek) site is c1 edr. The thermal water intersects amassi ve plug ofliiII:quartz latite porphyry (Figure 6 and 10), the youngest rock in the~l ,r:pji 110r,n··
,area. Near-vertical shears in the quartz monzonite, parallel to thequartz latite porphyry plug, act as conduits for fluids as they flow upalong the plug (Figure 10). The great width of the minor vent site(335 m) is a reflection of the lack of horizontal constraint in apermeable channel system that is restricted vertically (once under thequartz monzonite it is a confined system), but is relativelyunrestricted horizontally. The fact that recharge occurs on thenortheast margin of the permeable zone probably accounts for thesomewhat limited dispersion of the geothermal waters.Contrary to the Lindgren Creek (HC2) vent site, the HC1 vent sitelhas the highest flow rate (350 liters/min) from the fewest vents (2) ofany of the three systems studied in this report. There are structuralas well as geochemical (see Page 112) reasons for this flow regime.The quartz monzonite exhibits ductile deformation adjacent to themost recent intrusions in the area, the quartz latite porphyry dikes.When the microgranite was intruded, almost contemporaneously with thequartz monzonite (see Page 31), the quartz monzonite was probablysusceptible to ductile shear, partciularly at the HC1 vent site locatedequidistant from the microgranite border unit and the largestmicrogranite dike in the study area (Figure 6). The observed shearfractures at the vent site (Figure 9) trend parallel (NE) to both ofthe microgranite units. If the shear fractures, from which the thermalwaters vent (Figure 9), are projected downward they intersect themicrogranite dike located to the NW (Figure 6) at a depth of 500 m (thedepth of calculated equilibration, see Page 102).111
The shear fractures at the vent site have been displaced aboutmeter by a N trending strike slip minor fault (Figure 9).~not large, the simple shear motion may have served to dilate thet Wtrosscut shear fractures adjacent to the fault (Ramsay, 1967),;\~brovidingAlthoughprimary control for the location of vents in the shear zone.t1,!~li11,1 The presence of a massive microgranite dike and smaller quartz~latite porphyry dikes (Figure 9) crosscutting the convection systemi!itrend (NW connecting the HCl and HC2 sites) may act as a barrier tohi]~tost of the water in the Horse Creek geothermal system. These barriers~~re~:!:adjdcent to permeable shear fractures that serve to conduct the"j,1~iverted fluids to the surface.I~OUldThe remaining water in the systemIt::::be dispersed working its way around the dikes. producing the~.1: jflow and wide dispersion of vents observed at the Lindgren Creek~H~~ PERMEABILITY~llIi!~ater/rockihij~onditionsThe transfer of mass within a geothermal system occurs due tointeractions and changes in pressure and temperatureas the water travels from low to high to low pressures andfitemperatures during circu lation through the system. The phenomenon ist!1~~ell recognized (Garg and Kassoy, 1981; Norton and Knight, 1977; and~r;:lwtherS) and results in the removal or deposition of material within the!I';r~ermeable channels of the geothermal system. Precipitates of calcitel~rsilica may also form as sinter deposits on the surface adjacent toW >',1\1hermal vents.~ In the three systems studied the net mass transport effect is one~f removal of material. Using the flow rates (pages 77, 83 and 88) at~{ :1"II112iIi!Iii'I
,;i"[j:Ii"each site and the concentration of K, Na, Ca, Li, and Si02 (Tables 2,~jij~3, 5, 7 and 9) dissolved in the thermal waters an estimate of the rate"I,iI:Iof mass removal can be made for each of the three systems (Table 16).~!,:rlTable 16. Rate of Mass Removal from the Big Creek, Owl Creek,",I,and Horse Creek geothermal systems.tBig Creek Hot Springs 157 x 10 3 kg/yr,'," Owl Creek Hot Springs 11 x 10 3 kg/yrI..1,'j,1~I IHorse Creek Main Vents 24 x 10 3 kg/yr~l: Horse Creek Minor Vents 4.5 x 10 3 kg/yr[j"i:iil~hiSdoes not account for chloride, carbonate or other dissolvedn:,;rpomponents for which analyses are not available. The solvation of wall"~, iitoCk may be enhancing fracture permeability in some parts of the!,'l;,system.;uIl:.~lSii"Once a small flow is initiated in a fracture set the tendencyfor that fracture to increase in permeability as solvation occurs.il!bUnless disturbed, the system will tend to increase in flow capacity.Iii~,~~henconsidered on a geologic time scale of several thousand years theil,:~~ffect can be dramatic (i.e. 58,000 m3 per thousand years at Big Creek!I!:~ 111;j~otSprings).~ Most material is probably removed at depth where the hot waterr!;i(becomes equilibrated with the wall rock.I!:As the solute-ladened waterll'rises pressure and temperature decrease. Calcite increases inIii01Ubility as temperature drops, but may precipitate if a significant'I:,)1 os S of C02 occurs due to pressure loss or boiling (Ellis and Mahon,>Jfl.;1 1977) . Conversely, calcium may be leached from near-surface rocks if;J;d~~eothermal fluids become undersaturated with calcite by cooling throughf~onduction or dilution without loss of C02. Quartz decreases in,I"~l;'ij~OlUbility with decreasing temperature. In reservoirs with~j; 113;1 11:r ,!
temperatures above 250·C quartz may precipitate rapidly at the onset ofcooling (Fournier, 1981). Even at lower reservoir temperatures quartzand other components may precipitate to some extent as solutions arecooled nearing the surface. As a result, the near surface permeablechannels in geothermal systems typically become sealed withprecipitated minerals (Marsily, 1985) and once sealed, the surfacedischarge of hydrothermal waters will cease. In order for flow tocontinue for long periods of time the permeable channels of the systemmust undergo repeated fracturing. In the systems studied this seems tobe the case. Petrologic analysis of rocks from the convective portionsof other hydrothermal systems has shown evidence of repeatedfracturing/sealing episodes (Batzle and Simmons, 1977; Shirey et al.,1978) .The high flow rates that are evident at Big Creek Hot Springs andthe main vents at Horse Creek Hot Springs may be due to recent tectonicmovement in the fracture zones containing the geothermal convectionsystems at these two areas. At Big Creek Hot Springs there is directevidence of recent activity. At the vent site there is a small erosionremnant, 1.5 m thick, of highly altered country rock on the existingvent surface. West of Hot Springs Creek, along Panther Creek, is abench composed of aluvium from Panther Creek valley fill. The benchhas undergone little lateral incision and appears to be the result ofrecent uplift in the Panther Creek/Hot Springs Creek area.At Owl Creek the presence of large fissures with uneven walls dueto solvation indicates that in the past the flow rate in the observedportion of the Owl Creek system may have been much higher. The present114
,)\\:~j::fiU11:lfloW (80 liters/min) ;s low when compared to the drainage area of Owl~lfJ'Creek and resultant availability of ~recharge.IIItilIt may be there is more~lipotentia1 at Owl Creek, but there has been no recent activity along theII!fl:fau 1ts and fracture zones that make up the permeable reservoir of thed;t>l!syst em. As aresu1t the syst em i s be i ng sea1edand flow 0 ver time i s;1:l!·!declining. If a new fracture event were to occur the Owl Creek systeml I,:may have a flow potential exceeding any of the other systems studied inIflthiS report.~iii JHHi~ ':DRIVING FORCEThe dri ving force present in every spring, be it thermal or!1:'nontherma1, is gravity. Hydraulic head is one manifestation of gravityWi~nWproduced by having areas of recharge higher than areas of discharge,11'1~~heIl~owever,difference in elevation creates hydraulic pressure or head.there is some energy loss due to friction as water movesll{f,:il;through permeable channels of the reservoir. The theoretical head orlliidifference in elevation between the infered recharge and discharge'~;tes can be estimated using topographic maps and the known geometryJknd outcrop of the permeable fracture systems.The values of head are~listed in Table 17.il,!\: The fact that mi nor vents along Lindgren Creek at Horse CreekIdiSCharge at an altitude 15 m higher than the recharge illustrates the~~ffectiveness of the force of heat convection present only in thermalii,l.:If,~IFprings.i"t iThe difference in density caused by expansion on heating isJthe principle driving force for convection in geothermal systems.~li1!lpensity of water at the maximum temperature is listed for each of therH~~ystems studied in Table 17. The percent decrease in density is for~I)~!'1Il i l:fWitj:.!,115The
Table 17.Hydraulic Head. maxirrxJm temperature. density. andpercent density decrease (from 10 0 C) for thermal watersin the Big Creek, Owl Creek, and Horse Creek geothermalsystems.Hydraulic (1) Maxi mum % Dens ityHot Springs Head Temperature roc (2) Dens i ty Decrease*Bi g Creek 244 M 189°C 179°C 0.8970 gm/cm3 10.3%Owl Creek 73 M 12rC 1UoC 0.9459 gm/cm3 5.4%HC1 Hors e Creek 30 M 40°C 30°C 0.9922 gm/cm3 0.75%~HC2 Lindgren Creek -15 M** 70°C 60°C 0.9778 gm/cm3 2.2%(1) Maximum temperature from geothermometry data( 2) Perry and Chilton, 1973* Relative to 0.9997 gm/cm3 at 10°C** (Discharge above recharge)!,II:1IIIwater at the deepest (hottest) portion of the reservoir. The densitydifference causes hot water to rise while cold recharge water sinks.However, gravity acting on the less dense water is still the ultimatedriving force. The force acting on the buoyant hot water is greatenough to overcome small differences in head (plus frictional losses)and allow venting at levels higher than recharge.I::1~'·'1Ii:"II"I'"IiiifII116
[":',,1Hi,:ti11'q.;,IiHil'il.; VIII. <strong>THE</strong> ENERGY <strong>AND</strong> ECONOMIC POTENTIAL <strong>OF</strong> <strong>THE</strong>~Ii[\: SHOUP GEO<strong>THE</strong>RMAL AREA~IJ;~I'ENERGY POTENTI ALiii!11'1 . Methodologies used for assessment of geothermal resources arelirevlewed by Muffler and Cataldi (1978) and divided into four main:1 1:t:1',I ~ncategories: 1) surface thermal flux; 2) volume; 3) planar fracture;I Ii:.1 ij;and 4) magmatic heat budget. The surface thermal flux method uses'I'Immeasurements of the rate of thermal energy loss at the ground surface:1~ti:1 ;j;by conduction, steaming ground, hot springs, fumaroles, and discharge,I,:1Ii:·:,1'II"I,IiI;It'.··'.1~"iljof thermal fluids into streams. The volume method involves estimation;.r]'I.of the thermal energy contained in a given volume of rock and water andU;IIjithe proportion of this energy that may be recoverable. The planar,j:jiT'fracture method uses modeling techniques to simulate energy extraction1:1!i:lfrom water flowing in a hot planar fracture. The magmatic heat methodiilinvolves calculating the available thermal energy in young igneous!I!intrusions and surrounding country rock.!!J~irrThe volume method is the most useful because: 1) it is applicablelll.:,ito almost any geologic environment; 2) the parameters needed can, in:1,I!" ~Jprinciple, be measured or estimated; 3) errors that arise tend to be,fldil[l in part, compensating; and 4) uncertainties in the estimation scheme;1;ij,(the recovery factor and resupply of heat) are resolvable in the nearij(uture (Muffler, 1981).lidThe recovery factor is defined by Muffler and Cataldi (1978) as"J"the ratio of extracted thermal energy' (measured at the well head) toli,the total geotherma 1 energy conta; ned or;gi nally ; n a gi ven su bsurface~1:1: " 111,lvolume of rock and water. III:!r :l.. i1 ~ ..1'.1.' ::It also must be extractable in an117
ndustrial time frame (10-100 hr) rather than in a geological timeili~iJrame (>10 3 yr). The resupply of heat is significant only for high"I'~lidiSCharge hot water systems (Muffler, 1981). The value of the recovery!d:~IJactornsubjectively.(Rg) is difficult to assess and is usually estimatedIts value is dependent on 1) the type of geothermalil:1fl:system (convection, conduction, geopressured, magma); 2) porosity; 3)~p~(nature of fluid in pores; 4) reservoir temperature; and 5) extractiontU~.l'tech no logy.\/, ~:1,jJII:! For hot water systems the amount of total porosity and effective!1''(porosity is the dominant factor in the value of Rg. Total porosity is!\:~ "~::a measure of total pore volume in a rock body, while effective porosityII~ ':I'lis pore volume in which fluid flow occurs (permeable channels) (NortonI':111and Knapp, 1977). Ideally the total porosity of the rock also serves~\'as effective porosity (allowing fluid flow). Typical total porosity is1:1- 20 percent, wh; ch g; ves a Rg val ue of 30 percent. In practice Rg~H~~robably never exceeds 25 percent (Muffler and Cataldi, 1978).,~ ,;i~ ·1lt!~'Ii~tequati on:kIIi!Ji,·II'iiIi'J~hereThe value of total thermal energy, HT, can be evaluated by the'l"k: 3Cv is the volumetric specific heat of the rock and pore water (Cv~= 0.6 cal/cm ·C in the water/rock systems considered), V is the volume!liof rock under consideration, TO is the averag~ umbient surface!!!EI:::'l'temperature, and Tl is the temperature at depth in the reservoir~~:1,J"lli(MUffler and Cataldi, 1978). It is assumed that the discharge wateriii·Sf:)tliIii 11811'1l'
~IJgeothermoll)etryi\~if:Hot Springs, respectively.;1'\(Page 92}s 181·C and 127·C for Big Creek and Owl CreekFor Horse Creek Hot Springs an average of~~he two thermal sites (55·C) was used. The reservoir volume wasi:1'!!!calculated from the area of the known fracture systems between inferredi'1r\ :.IJrecharge and discharge locations (Figures 3s 4, 5 and 6).j IiIt wasf'assumed that the length and breadth of the fracture zones remains the~!~~ameIi". at depth and that the entire length and breadth of the fracturerjiIr ones are available for heat exchange. The estimated areas ar,If· 37 km 2 (3700 m x 100 m) for Big Creek Hot Springs (Figure 3 and 4),11,0. 15 km 2 (1500 m x 100 m) at Owl Creek (Figure 5) sand 0.28 km 2 (1000 mII'!l/iix 250 m) at Horse Creek (Figure 6). It is' assumed that the thicknessflilIliff the fracture zone is 1000 m at Big Creek and 500 m at Owl Creek andj .1'~Horsel~fCreek Hot Springs. These estimates are based on the total depthcirculation for the systems and guidelines outlined by Muffler~H,~(1979). The resulting reservoir volumes are listed in Table 19. TheI~alculatedvolume values are approximate, but do serve to provide akIf OU9h estimate of reservoir thermal energy.~" The recoverable heat (HR) is equal to the total thermal energy;; I ~I~I".,.t~imes~lthe recovery factors':j'Ii ',:,'~, ~ HR = (HT) (Rg).1,,'1,:,"Hltjhi"'I!119'\
I'II,IIII1'1j~ "I~1~I1i,illII:1l:1~~~Using the equation for HT (page 118) and a value of Rg of 15percent, the reservoir thermal energys (in megawatts) were calculatedfor the study areas (Table 18).Table 18.Reservoir volume and reservoir thermal energy for the BigCreek, Owl Creek, and Horse Creek geothermal systems.Reservoir ReservoirLocation Volume Thermal EnergyBig Creek Hot Springs 0.37 km3 7.9 MwOwl Creek Hot Springs 0.075 km3 0.94MwHorse Creek Hot Springs 0.14 km3 0.91 MwECONOMIC POTENTIALThere have been several definitions of the requirements of aneconomic geothermal resource.White and Williams (1975) discountgeothermal energy at depths greater than 3 km or with reservoirtemperatures less than 90·C.Cataldi et al. (1978) disqualify anyreservoir below 60·C and restrict resources for electrical generationto temperatures greater than 130·C. Nathenson and Muffler (1975)conclude that reservoirs with temperatures greater than 200·C were themost likely to contain exploitable geothermal energy reserves.main factor bearing on the cost of extraction of geothermal resourcesis depth.Due to drilling costs reservoirs at depths greater than 3 kmare uneconomic to tap, regardless of the reservoir temperature.The Big Creek Hot Springs geothermal system is the only systemstudied in this report that has the potential for electricalThegeneration. The presence of the Blackbird cobalt mine (Bennett, 1977)south of the study area offers a nearby consumer, but population~ centers are too distant to offer reasonable transmission costs.~:1r120
Unfortunately, operation of the Blackbird mine appears to be unlikelythe near future.The Owl Creek and Horse Creek geothermal reservoirs have. temperatures too low (120·C and 40-70·C respectively) to be of use inelectrical generation. The flow rate at Owl Creek is too low to be offor space heating purposes. Horse Creek has a high flow rate but,to its geographical isolation (Owl Creek also), no practical usebe made of this low temperature resource. Since all three areaslocated on National Forest land adjacent to a roadless primitivearea, environmental concerns would also require consideration in thedevelopment of these systems.One alternative that may be exploited in the future, with furtherdevelopment of technology, would be the use of hot dry rock thermalFurther work in the area to better define the fracturezones present and use of hydrofracturing techniques would allow thevelopment of the anomalously high heat flow present in the ShoupArea. This could be done without disturbing the existingnp/~~hermal systems in the area, an environmental concern. Theisotropic nature of the country rock would allow excellent control ofnjection sites, extraction sites, and nature of the generated fractureones (Haimson, 1977). The electrical generating capacity of such aenough potential to warrant the transmission of thenerated power to consuming centers.121
pIIX.CONCLUSIONS"!,::This study has examined the structural and petrologic setting ofthree thermal systems in the Shoup Geothermal Area located on Hot"1::~:prings Creek, Owl Creek, and Horse Creek. In addition to structural'Ii,~nd petrologic analysis, physical and chemical conditions wereI>l:determined for waters from the thermal vent systems and for local and,I,"r>,r:·jregional nonthermal spring sites. The data obtained from the thermal,i;~'~aters'tiwere used to calculate temperature of equilibration using~~rious geothermometers.:'j'l;! The history of the Shoup Geothermal Area is long and complex. Atleast three deformational events, the earliest of which dates toil,&recambrian time, have imprinted a strong anisotropic LIS fabric onto!ifjthe\,jrocks in the region. During the Tertiary, epizonal plutons were, ,;Iiiintruded into the northern edge of the study area at Horse Creek, the~1:;aighorn Crags pluton and Leesburg stock were also intruded, at this"i'~imet to the west and east of the study area.fil''I; The geothermal convection systems are contained in permeableIiittacture zones within irrpermeable crystalline country rocks. The'tV~~acturei:q~ring'T' ,~ig,jlsystems in the Precambrian terrain may have been initiatedthe Precambrian and show signs of geologically recent activity.Creek Hot Springs and Owl Creek Hot Springs are located inPtrecambrian rocks.'q IiT!ertiary Painted Rocks Lake pluton.I,l,;~i!Horse Creek Hot Springs is located in the epizonalAt Big Creek Hot Springs the location of the thermal vent site isIIC:ontrolled by the anisotropic fabric of the country rock. Thetii:~,:,,:_~J :;Ii~I I12251,
IiIicirculatory system is contained within a fracture zone located ini ,,'hlghly anisotropic rock, resulting in a relatively narrow, highly't::I:!permeable channel. When the fabric of the country rock on one side of·1:,'Ithe fracture zone changes to massive and isotropic, rather than,r;anisotropic, the fracture zone imbricates, grows rapidly in width, andIi'tAe fracture density dramatically decreases, with a resultant loss ofi'i' l ;p'ermeability. The thermal waters in the fracture zone are then forced'Ii£0 the surface at the vent site. At Owl Creek the thermal system is, I:iiocated in the corner of a faulted block of the autochonous metamorphic~f'rterrain. The circulatory system has been tapped by a minor reverse::1:i:'I,inault that serves as a conduit to the surface. At Horse Creek the vent1:sites are located in Tertiary rocks adjacent to the Precambrian,,\11,f';I Jterrain. The circulatory system is in the border zone into which:li~iCrOgranitehas been intruded and undergone cataclasis. The intrusion'I'I:may have been controlled by an ancient fracture zone in the Precambrian"1:1,;rocks.,j:The thermal waters are forced to the surface by intrusions offiCrOgranite and quartz latite porphyry that cross cut the cataclastic'IUb'order zone.1,1'[~i: !~greement;Ii,·f1i;~ystems,I:,'IThe use of various chemical geothermometers gave reasonableand indicate temperatures of equilibration for the threestudied as follows: Big Creek Hot Springs 181·C; Owl Creek Hot~prings 127·C; and at Horse Creek, 40·C for the vents on Horse Creekvii)nd 70·C for the vents on Lindgren Creek.I{ 1~i('il!' ,The source of heat at Horse Creek ,is the relatively high levels of"I:fadioactivity in the Painted Rocks Lake pluton.;;lij:::1 11~ocks:h,.~j,iNormally metamorphicare depleted in radioactive isotopes, but in the case of Hot::11' 123',,1
I'i'~li1. 1+1'i'JSprings Creek and Owl Creek the fracture zones in which they are::I'ij;i',[ocated may have been preferentially enriched in uranium from regionalIIiittirculatory systems that were generated around the uranium-rich PaintedI.Rocks Lake pluton, Bighorn Crags pluton, and Leesburg stock.:.I!"1'~l'iThe est imated geothermal gradients at Hot Springs Creek, OwlI:!,:~1:!;lCreek, and Hors e Creek of 51 0 Clkm, 44°Clkm, and 51 ·C/km gi ve depths of:,1):Mill~I~irculation:~reekfor the thermal waters of 3.4 km and 2.4 km at Hot Springsand Owl Creek, respectively. The shallow high flow portion ofhiiporse Creek descends to 0.5 km and the low flow portion along Lindgren~reek extends to a depth of 1 km.~lri~~ Due to the isolation of the area and the location in National!l!j;]~orest adjacent to primitive areas, economic development of theili~xisting hot spring systems does not appear to be practical. However,nd;j~he~Lreause of hot dry rock techniques in other fracture systems in themay have economic potential.ri
:r i',·1I':~ j,:+I~f: ;m~yd.id deposit radioactive isotopes in the fracture systems.If so, itbe possible to find other fracture systems, in the anisotropic~recambrian terrain, that have had radioactive isotopes deposited inIit~em to such an extent that higher heat generating capacity at'I~hallower depths (than the three systems in this study) would offerJ~bssible economic exploitation by hot dry rock methods. At the veryiii'l,east, proof of the hypothesised mechanisms in the Shoup GeothermalI;,1A~ea may aid in the exploration for geothermal resources in other areas.125
'f'.j;!H'I'"'.'REFERENCES CITED"Anderson, E.M., 1951, The Dynamics of Faulting and Dike Formation WithApplications to Britain: Hafner Publishing Company, New York,"1n 206 p."1;1~rmstrong, R.L., 1975, Precambrian (1500 M.Y. old) rocks of central) Idaho--the Salmon River Arch and its role in CordilleranI sedimentation and tectonics: American Journal of Science,!. v. 275-A, p. 437-467.
!,I':.1B~rke, K., and Dewey, J.F., 1973, Plume generated triple junctions: key~'. indicators in applying plate tectonics to old rocks: Journal ofIi Geology, v. 81, p. 406-433.I'!:Burnham, W.C., 1979, Magmas and hydrothermal fluids, in H.L. Barnes,ed., The Geochemistry of Hydrothermal Ore Deposits, 2nd ed., JohnI,i Wiley & Sons, New York, 798 p.I''IICataldi, R., Lazzarooto, A., Muffler, P., Snarci, P., and Stefani, G.,,i: T1978 , AssGessm~nt ~f geoth ermal 9Poltle3ntlial of central and southern'b uscany: eotnermlcs, v. 7,p. - .1:[':'I'Cater, F.W., Pinckney, D.M., Hamilton, W.B., Parker, R.L., Weldin,J R.D., Close, T.J., and Ziku, N.T., 1973, Mineral resources of the~; Idaho Primitive Area and vicinity: U.S. Geological Survey Bulletin! 1304, 430 p.J.;d!athles, L., 1977, An analysis of the cooling of intrusives by ground., water convection which includes boiling: Economic Geology, v. 72,;1 p. 804-826.j'Ar'IOhase, R.B., 1973, Petrology of the northeastern border zone of thetl' Idaho Batholith. Bitterroot Range. Montana: State of Montanai:' Bureau of Mines and Geology Memoir 43. 27 p."Iq:)'1Chelidze. T.L .• 1982, Percolation and fracture, in Physics of the EarthJand P1anetaryInt erior s. v. 28. p. 93- 101. it:Qlark. S.P .• 1966, Handbook of Physical Constants: Geological Societyiil:l: of America Memoir 97. p. 459-482.I,:IiCobbold. P.R .• 1976. Mechanical effects of anisotropy during large, finite deformations: Bulletin of the Geological Society of France,v. 7. p. 1497-1510.bold, P.R .• Cosgrove. J.W .• and Summers. J.M .• 1971. Development ofinternal structures in deformed anisotropic rocks: Tectonophysics.v. 12. p. 23-53.ld. P.R .• and Watkinson. A.J., 1981. Bending anisotropy: Amechanical constraint on the orientation of fold axes in ananisotropic medium: Tectonophysics. v. 72, p. TI-TIO.sman. E.R .• 1984, Paleogeography and paleotectonic setting of thePrichard Formation - A preliminary interpretation. in S. WarrenHobbs. ed .• The Belt. Abstract With Summaries. Belt-Symposium II,1983: Montana Bureau of Mines and Geology Special Publication 90.p.117.127
C ss, R.E., and Taylor, H.P. Jr., 1983, An 180/ 16 0 and D/H study ofTertiary hydrothermal systems in the southern half of the IdahoBatholith: Geological Society of America Bulletin, v. 94,p. 640-663.I-+u~;~~1979,CDley, F.A., 1960, Columbium-rare-earth deposits, southern RavalliCounty, Montana: Montana Bureau of Mines and Geology Bulletin 18,47 p.Faith, and Berg, Richard B., 1981, Radiometric dates of rocksin Montana: Montana Bureau of Mines and Geology Bulletin 114,p. 136.E is, A.J., 1970, Quantitative interpretation of chemicalcharacteristics of hydrothermal systems, in Proceedings of theUnited Nations Symposium on the Development and Utilization of;1' Geothermal Energy, Pisa, 1970, v. 2, pt. I, Geothermics Special!) Issue 2, p. 516-528.'I';'!~;'i __~1971, Magnesium concentrations in the presence of magnesium:: chlorite, calcite, carbon dioxide quartz: American Journal of,I; Science, v. 271, p. 481-489."I1\1'1Explored geothermal systems, in H.L. Barnes, ed.,;i'1 Geochemistry of Hydrothermal Ore Deposits, 2nd ed., John Wiley &;1 ii Sons, New York, 798 p.V'i";1Ellis, A.J., and Mahon, W.A.J., 1977, Chemistry and Geothermal Systems:;! Academic Press, New York, 392 p.:1:E~gelder, T., 1985, Loading paths to joint propagation during arj) tectonic cycle: An example from the Appalachian Plateau, U.S.A.:;h i, Journal of Structural Geology, v.7, p. 495-496.JiE~ans, Karl V., Lund, Karen, 1981, The Salmon River "Arch"?: Geologicaltil Society of America Abstracts With Programs, v. 13, no. 7, p. 448.:1,F~hn,Jii,'j,;U., Cathles, L.M., and Holland, H.D., 1978, Hydrothermal~~~~~~~ ~ o~ e~~ ~g~ ~a~ ~ u~3~e~~s i~~ 6~ ~5 ~~~orma 11 y rad ioacti ve plu tons:F6uillac, L., and Michard, G., 1981, Sodium/lithium ratio in water'I. applied to geothermometry of geothermal reservoirs: Geothermics,Ii v. 10, p. 55- 7a.;1I,"l:JF'6urnier, R.O., 1977, Chemical geothermometers and mlxlng models for'! geothermal systems: Geothermics, v.5, p. 41-50 ..tli;i':i'i1981, App 1i cat i on of water geochemi stry to geothermal~jl!! exploration and reservoir engineering, in L. Ryback and L.J.P.)1 Muffler, eds., Geothermal Systems: Principles and Case Histories,Ii: John Wiley & Sons, New York, p. 109-144.1'1' 128~I
iii:il!q:!:{J,fil!l:[,ij:':!Fburnier, R.O., and Potter, R.W., II, 1979, Magnesium correction to theWi Na-K-Ca chemical geothermometer: Geochim. Cosmochim. Acta, v. 43,I' p. 1543-1550.;iq:lFpurnier, R.O., and Truesdell, A.H., 1973, An emperical Na-K-Ca-r; geothermometer for natural waters: Geochim. Cosmochim. Acta, v.;'" 37, p. 125 5- 127 5 ."1'1'I:F~urnier,R.O., White, D.E., Truesdell, A.H., 1974, Geochemical': indicators of subsurface temperature, pta 1, Basic assumptions:::li U.S. Geological Survey Journal of Research, v. 2, no. 3,'I"iH::' p. 259-262.~hll:~yfe, W.S., 1973, The generation of batholiths: Tectonophysics, v. 17,11' p.273-283.Ii'~arg,S.K., and Kassoy, D.R., 1981, Convective heat and mass transferIi in hydrothermal systems, in L. Rybach and L.J.P. Muffler, eds.,~j:.••.ii Geothermal Systems: PrincTPles and Case Histories: John Wiley &il!J: Sons, Nei~ York, p. 37-76.Greenwood, W.R., and Morrison, D.A., 1973, Reconnaissance geology of~jii the Selway-Bitterroot Wilderness area: Idaho Bureau of Mines andWi, Geology, Pamphlet 154, 30 p.~hhn, G.A., and Hughes, G.J., Jr., 1984, Sedimentaion, tectonism and~~ associated magmat~sm of the Yellow.Jacket Formation in ~he Idaho'I' Cobalt Belt, Lemh1 County, Idaho, 1n S.W. Hobbs, ed., Tne Belt,Slj, Abstracts and Summaries, Belt Symposium II, 1983: Montana BureauM of Mines and Geology Special Publication 91, 117 p.:-[I1~ :Maimson, B.C., 1977, Crustal stress in the continental United States asJ! derived from hydrofracturing tests, in J.G. Heacock, ed., TheM1 Earth's Crust, Its Nature and Physical Properties: Americani'!:i Geophysical Union, Geophysical ~lonograph 20, 765 p.IIi!!{Hi]:H~mza,V.M., and Verma, R.K., 1969, The relationship of heat flow withrJ,I! age of basement rocks: Bulletin Volcanology, v. 33, p. 123-152.1:'1Hanmer, S.K., 1979, The role of discrete heterogeneities and lineari ,. fabrics in the formation of crenulations: Journal of Structurall Geology, v. 1, no. 1, p. 81-90.rH~rrison,J.E., 1972, Precambrian Belt Basin of northwestern United::j1 States: Its geometry, sedimentation, and copper occurrences:.,. Geological Society of America Bulletin, v. 83, p. 1215-1240.;i:8arrison, J.E., Griggs, A.B., Wells, J.D., 1974, Tectonic features ofI: the Precambrian Belt Basin and their influence on Post-BeltIi; structures: U.S. Geological Survey Professional Paper 866,15 p."!'i~ili:;1::, 129!il'i,.!
xby, W.F., and Turcotte, D.L., 1976, stress induc~d by the additionor removal of overburden and the associated thermal effects:Geology, v. 4, p. 181-184.ie,", K.S., and Billings, G.K., 1969, Lithiulil, in Handbook ofGeochemistry, v. II-I, Springer Verlag, Berlin.einrich, E.W., 1966, The Geology of Carbonatites: Rand McNally Co.,Chi cago, 555 p.elgeson, H.C., 1970, Reaction rates in hydrothermal flow systems:Economic Geology, v. 65, p. 299-303.ggins, M.W., 1971, Cataclastic rocks: U.S. Geological SurveyProfessional Paper 687,97 p.11, D.P., and Pakiser, L.C., 1966, Crustal structure between theNevada test site and Boise, Idaho, from seismic refractionmeasurements, in J.S. Steinhart and T.J. Smith, eds., The EarthBeneath the Continents: Geophysical Monograph Service, v. 10,American Geophysical Union, Washington D.C., p. 391-419.ghes, C.J., 1982, Developments in Petrology 7: Igneous Petrology:Elsevier Scientific Publishing Co., New York, 551 p.ndman, D.W., 1980, Bitterroot Dome--Sapphire Tectonic Block, anexample of a plutonic-core, gneiss-dome complex with its detachedsuperstructure, in M.P. Crittenden, Jr., P.J. Coney, and G.H.Davis, eds., Cordilleran Metamorphic Core Complexes: GeologicalSociety of America Memoir 153, 490 p.1981, Controls on source and depth of emplacement of granitic:.+':"--magma: Geology, v. 9, p. 244-249 ..~__1983, The Idaho Batholith and associated plutons, Idaho andwestern Montana, in J.A. Roddik, ed., Circum-Pacific PlutonicTerranes: Geological Society of America Memoir 159, 316 p.iilsgaard, T.H., and Lewis, R.S., 1986, Plutonic rocks of Cretaceousage and faults, Atlanta Lobe, Idaho Batholith, in McIntire, D.H.,ed., Symposium on the geology and mineral deposits of the Challis1 by 2 degree quadrangle, Idaho: U.S. Geological Society Bulletin1658, p. 29-42.olesar, P.T., and DeGraff, J.V., 1978, A comparison of the silica andNA-K-Ca geothermometers for thermal springs in Utah: Geothermics,v. 6, p. 221-226.lp, L.J., 1969, Potassium-argon dating of the Idaho Batholith:Geological Society of America Bulletin, v. 80, p. 2379-2382.130
enbruch, A.H., 1970, Crustal temperature and heat production:Implications of the linear heat-flow relation: Journal ofGeophysical Research, v. 75, no. 17, p. 3291-3300.chenbruckh. A.H., and Sass, J.H., 1977, Heatflow in the United Statesand the thermal regime of the crust, in J.G. Heacock, ed., TheEarth's Crust: Geophysical Monograph 20, p. 626-675.sen, E.S., and Gottfried, D., 1961, Distribution of uranium in rocksand minerals of Mesozoic Batholiths in western United States: U.S.Geological Survey Bulletin 1070-C, 19 p.ghlin, W.A., 1981, The geothermal system of the Jemez Mountains, NewMexico and its exploration, in L. Rybach and L.J.P. Muffler, eds.,Geothermal Systems: Principles and Case Histories: John Wiley &Sons, New York, 359 p.ndgren, W., 1904, Geological reconnaissance across the BitterrootRange and Clearwater Mountains in Montana and Idaho: U.S.Geological Survey Professional Paper 27,123 p.,-v",-,-, David A., 1981, Stratigraphy of the Yellow Jacket Formation ofeast-central Idaho: Ph.D. Disseration, Colorado School of Mines,252 p.nd, K., and Benham, J.R., 1984, Blue Joint Wilderness study area,Montana, and Blue Joint rOod1ess area, Idaho, in S.P. Marsh, S.J.Kropschot, and R.G. Dickinson, eds., WildernesS-Mineral PotentialAssessment of Mineral-Resource Potential in U.S. Forest ServiceLand Studied 1964-1984: U.S. Geological Survey Professional Paper1300, v. 2, p. 672-675.on, W.A.J., 1970, Chemistry in the exploration and exploitation ofhydrothermal systems, in Proceedings United Nations Symposium onthe Development and Utilization of Geothermal Energy, Pisa, 1970,v. 2, pt. 2, Geothermics Special Issue 2, p. 1310-1322.aley, T.J., 1974, Structure and petrology of the lower Panther Creekarea, Lemhi County, Idaho: Ph.D. Disseration, University of Idaho,130 p.i1y, G.de, 1985, Flow and transport in fractured rocks:Connectivity and scale effect, in Hydrogeology of Rocks of LowPermeability: International Association of Hydrogeologists11emoirs, v. 1, pt. 1, p. 267-277.otzer, W.E., 1981, Tertiary epizonal plutonic rocks of the Se1wayBitterroot Wilderness, Idaho: Geological Society of AmericaAbstracts With Programs, v. 13, no. 4, p. 220.131
:!,::];;!i:,1+~',1M~ffler, L.J.P., 1979, Assessment of geothermal resources of the United,I,i,States--1978: U.S. Geological Survey Circular 790,163 p.ii',.1: 1981, Geotherma 1 resource assessment, in L. Rybach and L.J.P., Muffler, eds., Geothermal Systems: Principles and Case Histories:Ii! John Wiley & Sons, New York, p. 181-198.JIM~ffler, L.J., and Cataldi, R., 1978, Methods for regional assessmentI}i of geothermal res ou rces: Geothermi cs, v. 7, p. 53-89.N~thenson, M., and Muffler, L.J.P., 1975, Geothermal resources inl:, hydrothermal convection systems and conduction-dominated areas, inJ, D.E. White and D.L. Williams, eds., Assessment of Geothermalfi; Resources of the United States--1975: U.S.Geological Circular 726,:1' p. 10 4-12l.'i;~ i :~'N'6rton, D., and Knapp, R., 1977, Transport phenomena in hydrotherma 1i systems: the nature of porosity: American Journal of Science,:1; v. 277, p. 9 13 -936.I,~,()rton, D., and Kn i ght, J., 1977, Transport phenomena in hydrotherma 1~~ systems: cooling plutons: American Journal of Science, v. 277,in p.937-98l.Ji'Obradovich, J.P., Zartman, R.E., and Peterman, A.E., 1984, Update of:11 the geochronology of the Belt Supergroup, -in S.W. Hobbs, ed., The:;Belt, Abstracts With Summaries, Belt Symposium II, 1983: Montanaj Bureau of Mines and Geology Special Publication 90, 117 p.ih~aces,T., 1975, A systematic deviation from Na-K-Ca geothermometerii' below 75°C and above 10- 4 atm PC02: Geochim. Cosmochim. Acta 34,, p. 541-544.~h;Fj'i'~'atalaklta, Y.I., Polyakov, A.I., and Servyugin, N.N., 1979, Role ofI' the mechan i ca 1 factor in the thermal regime of zones of large'I faults: Geotectonics, v. 12, no. 4, p. 301-307.t!iIiPerry, R.H., and Chilton, C.H., 1973, Chemical Engineers Handbook,, Fifth Edition, Density and Volume of Water -10°C to 250°C, Section~I' 3: McGraw-Hill Book Company, New York, p. 7l.pitcher, W., and Berger, A., 1972, The Geology of Donegal: A Study of" Granite Emplacement and Unroofing: Wiley-Interscience, New York,435 p.itz, C.H., and Thiessen, R.L., 1986, Lineament analysis and structuralmapping of the Trans-Idaho Discontlnuity and their implicationsfor regional tectonic models: Proceedings of the 6thInternational Conference on Basement Tectonics, in press.rice, N.J., 1966, Fault and Joint Development in Brittle and SemiBrittle Rock: Pergammon Press, New York, 176 p.132
,,[:ij'Ramsay. John G.• 1967. Folding and Fracturing of Rocks:McGraw-Hill Book Company, p. 83-91.New York.Reed. M., and Spycher, N., 1984. Calculation of pH and mineral, equilibria in hydrothermal waters with application toi:' geothermomet ry and stu di es of boi 1i ng and di lu t ion: Geoch i m.I Cosmochim. Acta 48, p. 1479-1492.·'1Republic Geothermal, 1981, personal communication.!'I~eid, R.R., 1959, Reconnaissance geology of the Elk City region, Idaho:Idaho Bureau of Mines and Geology Pamphlet 120, 74 p.i~eynolds,t1itchell W., 1984, Tectonic setting and development of the: Belt Basin, northwestern United states, in S. Warren Hobbs, ed.,'i, The Belt, Abstract With Summaries, Belt Symposium II, 1983:I' Montana Bureau of Mines and Geology Special Publication 90,117 p..j.",'Rimstidt, J.D., and Barnes. H.L .• 1977, Kinetic evaluation of the+ quartz geothermometer: Geological Society of America Abstracts::l! With Programs. v. 9, p. 1142-1143.'Rivier, N., Guyon, E., and Charlaix, E., 1985, A geometrical approachi to percolation through random fractured rocks: Geological'[I Magazine, v. 122, no. 2, p. 157-162.:t·;,);':1,RI,Obertso~,.E.C:, Fournier, R.O., and Strong, C.p:, 1976,.Hydrotherm~1.1 actlvlty ln southwestern Montana, Second Unlted Natlons Symposlum,II"!, on the Development and Use of Geothermal Resources, San Francisco,,.'1' v. 2, sec. 2, p. 553-561.JiR:ose, A.W., and Burt, D.M., 1979, Hydrothermal alteration, in H.L.i:l'i' Barnes, ed., Geochemistry of Hydrothermal Ore Deposits-:-2nd ed.,~l,j: Jotln Wiley & Sons, New York, 798 p.~~ss, S.H., 1971, Geothermal potential of Idaho: Idaho Bureau of Mineswand Geology Pamphlet 150, 72 p.~py, R.F., ~lackwell, D.P., and Decker, E.R., 1972, Continental heat;1 1 , flow, ln Robertson, E.C., ed., The Nature of the Solid Earth::I~! McGraw-Hill Book Company, New York, p. 506-543.f ~: I!f i,~l; 1R~ppel,E.T., 1975, Precambrian Y sedimentary rocks in east-central,,(',j: Idaho: U.S. Geological Survey Professional Paper 889 A, 23 p.;;i::;:1:1' 1982, Cenozoi c block up 1ifts in east-central I daho andI' southwest Montana: U.S. Geological Survey Professional Paper~l:i' 1224, 24 p.~uppel, E.T., and Lopez, D.A., 1984, The thrust belt in southwest1~ Montana.and east-central Idaho, U.S. Geological SurveyXi Professlonal Paper 1278, 41 p.I:~l,,I'133
!.i!'}.:Rybach, L., 1976, Radioactive heat production: A physical property:1 determined by the chemistry of rocks, in R.G.J. Strens, ed., Theii Physics and Chemistry of Minerals and Rocks: Wiley & Sons, London,1,1;:H p. 309-318.:[i;: 1981, Geothermal systems, conductive heat flow, geothermal~'I~i---a-nomalies, in L. Ryback and L.J.P. Muffler, eds., GeothermalWi Systems: Principals and Case Histories: John Wiley & Sons, New~ York, p. 3-36.S~ss, J.H., Blackwell, D.O., Chapman, D.S., Costdin, J.K., Decker,Ji E.R., Lawver, L.A., and Swanberg, C.A., 1981, Heat flow from the)j: crust of the United States, in Y.S. Touloukian and C.Y. Ho, eds.,j:, Physical Properties of Rocksand Minerals: McGraw-Hill Book~tJ Company, New York, p. 503- 552.~ears, J.W., and Price, R.A., 1978, The Siberian connection: a case for~! Precambrian separation of the North American and Siberian cratons:!!i Geology, v. 6, p. 267-270.J!~hirey, S.B., Batzle, M.L., and Simmons, G., 1978, Microfracturei: characteristics of geothermal systems: Geological Society ofij!i ' American Abstracts With Programs, v. 10, no. 7, p. 491-492.:'j,.,~tearns, N.P., Stearns, H.T., and Waring, G.A., 1937, Thermal springs" in the United States: U.S. Department of Interior Water Supply:J: Paper 679-B, 150 p.;;!i,;1"Streckeisen, A., 1976, To each plutonic rock its proper name: Earth".J: Science Review, v. 12, p. 1-33.:11Struhsacker, D.W., 1981, An Analysis of Geothermal Electric Power:'.•jl,'. Generation at Big Creek Hot Springs, Lemhi County, Idaho::~ OOE/IO/12079-37.I; ,'I:Il:i~ I':i~wanberg,C.A., and Blackwell, D.O., 1973, Areal distribution and~~ geophysical significance of heat generation in the Idaho Batholith~! ..'I'.i ..•'F'and ad~acent i~trusions in.eastern O~egon and western Montana:Geologlcal Soclety of Amerlca Bulletln, v. 84, p. 1261-1282.!:;;~wanberg,~i':ipi'C.A., and Morgan, P., 1977, The linear relation betweentemperatures based on the silica content of groundwater andregional heat flow: a new heat flow map of the United States: Pureilii! and Applied Geophysics, v. 117, p. 227-241.~rr~ifarils, M.J., Greenberg, A.E., Hoak, R.D., and Rand, M.C., 1971,11~.~.· Standard Methods for the Examination of Water and Wastewater,~" Thirteenth edition: American Public Health Association,~j;!' Washington, D.C. ,po 300-309.~lrJll~ :1I'PI:li,;:r:tir~I I,fl;:'Iif,Ji 134't" r J ;
uesdell, A.H., 1976, Summary of section III-geochemical techniques inexploration, second United Nations Symposium on the Developmentand Use of Geothermal Resources: v. I, San Francisco.ruesdell, A.H., and Fournier, R.O., 1977, Procedure for estimating thetemperature of d hot-water component in a mixed-water by using aplot of dissolved silica versus enthalpy: U.S. Geological SurveyJournal of Research, v. 5, no. I, p. 49-52.leby, J.B., 1913, Geology and ore deposits of Lemhi County, Idaho:U.S. Geological Survey Bulletin 528, 182 p.ing, G.A., 1965, Thermal springs of the United States and othercountries of the world--a summary: U.S. Geological SurveyProfessional Paper 492, 203 p. .inson, A.J., and Cobbold, P.R., 1981, Axial directions of folds inrocks with linear/planar fabrics: Journal of Structural Geology,v. 3. no. 3, p. 211-217.is. P.L. Schmidt. L.J .• and Tuchek. E.T .• 1972. Mineral resources ofthe Salmon River Breaks Primitive area. Idaho: U.S. GeologicalSurvey Bulletin 1353-C. 91 p.hite. D.E .• 1970. Geochemistry applied to the discovery. evaluation.and exploration of geothermal energy resources: GeothermicsSpecial Issue 2. v. 1. p. 58-60.____~1973. Characteristics of geothermal resources. in P. Kruger andC. Otte. eds .• Geothermal Energy. Stanford University Press.p. 69-94.ite. D.E, Muffler. L.J.P .• and Truesdell. A.H., 1971. Vapordominatedhydrothermal systems compared with hot-water systems:Economic Geology. v. 66. p. 75-97.White. D.E .• and Williams, D.L .• 1975. Assessment of geothermalresources of the United States-1975: U.S. Geological SurveyCircular 726. 155 p.Whitney. J.A. t 1975. Vapor generation in a quartz monzonite magma: asynthetic model with application to porphyry copper deposits:Economic Geology. v. 70. p. 346-358.Yates. R.G .• 1968. The Trans-Idaho-Discontinuity: 23rd InternationalGeological Congress Proceedings. Prague. Czech., v.I. p. 117-123.Young. H.W .• and Mitchell. J.C .• 1973. Geothermal investigations inIdaho. pt. 1. Geochemistry and geologic setting of selectedthermal waters: Department of Water Administration. WaterInformation Bulletin 30. 43 p.135
'I'j[Young. H.W .• 1985, Geochemistry and hydrology of thermal springs in the, Idaho Batholith and adjacent areas, central Idaho: U.S.Geological Survey Water Resoruces Investigations Report 85-4172,44 p.artman, R.E., 1980, Age of the Yellow Jacket Formation, in GeologicalSurvey Research 1980: U.S. Geological Survey Professional Paper1175,81 p.136
APPENDIX AContoured Structural Diagrams for Hot Springs Creek,Owl Creek, and Horse Creek Study Areas
N-+x(0) (b)NN(d )igure 16Structural trends in the south subarea, Hot Springs Creek; equalarea projection, lower hemisphere.a) Poles to foliation planes, 25 points; contours at 8, 12, and20 percent.b) Trend and plunge of crenulations (.) and minor fold axes (x),11 points.c) Pole to joint planes, 65 points; contours at 4 and 7 percent.d) Pole to fracture cleavage planes, 26 points; contours at4 and 8 percent.138
NN( a )( b)NN!J+( c)( d)gure 17Structural trends in the north subarea, Hot Springs Creek;equal area projection, lower hemisphere.a) Pole to foliation planes, 60 points; contours at 5, 10, and15 percent.b) Trend and plunge of lineation, 32 points, contours at 6,18, and 28 percent.c) Pole to joint planes, 119 points; contours at 2, 4, and6 percent.d) Pole to fracture cleavage planes, 31 points; contours at6, 9, and 12 percent.139
NN(a)(b)NN+(c) ( d)gure 18Strur.tural trends in the northeast subarea, Owl Creek; equalarea projection, lower hemisphere.a) Pole to foliation planes, 35 points, contours at 6, 11,and 17 percent.b) Trend and plunge of crenulations (.) and minor fold axes (x),14 points.c) Pole to joint planes, 4·1 ,points; contours at 7, 15, and20 percent.d) Pole to fracture cleavage, 38 points; contours at 5, 8,and 13 percent.140
NN, ,, , ,+ ,1)J--"_0"'"(0 ) ( b )NN+( c )( d)igure 19Structural trends in the southeast subarea, Owl Creek, equalarea projection, lower hemisphere.a) . Pole to foliation planes, 28 points, contours at 14 and32 percent.b) Trend and plunge of crenulations (.) and minor foldaxes (x), 9 points.c) Pole to joint planes, 40 points, contours at 5 and7 percent.d) Pole to fracture cleavage, 15 points; contours at 13and 26 percent.141
NNX 7riIIIII+~+IIIIIII" " ..- " ..( 0) (b)N( c)igure 20Structural trends in the west subarea, Owl Creek; equal areaprojection, lower hemisphere.a) Pole to foliation planes, 18 points; contours at 11 and22 percent.b) Trend and plunge of crenulations (. ) and minor fold axes (x),6 points.c) Pole to joint planes, 32 points, contours at 6 and9 percent.142
NNI~•. T.""':'ii','",, .+ ~~""IIII(0 ) ( b)NN( c ) (d)gure 21Composite structural trends at Owl Creek, composite equal areaprojection, lower hemisphere.a) Pole to foliation planes, 81 points; contours at 5, 13,and 20 percent.b) Trend and plunge of lineations, 29 points; contours at 3,10, and 20 percent.c) Pole to joint planes, 113 points; contours at 2, 5, and10 percent.d) Pole to fracture cleavage, 55 points; contours at 4 and6 percent.143
NNxTr- .....+- -~.",., .... ,;:/!. -~"' ...... _ ~ ................(0 ) ( b)N+( c)igure 22Structural trends in the south subarea. Horse Creek; equalarea projection. lower hemisphere.a) Pole to foliation planes. 25 points; contours at 8, 12,and 16 percent.b) Pole to joint planes, 82 points; contours at 2, 3. and5 percent.c) Pole to fracture cleavage, 14 points.144
.,INN(a)( b)N'II:1:1'I,[II+II:1(c)I 1.11:1'IIIStructural trends in the north subarea, Horse Creek; equalII ar~a projection, lower hemisphere.a) Pole to foliation planes, 13 points; contours at 15 and:130 percent.ii:1iI b) Pole to joint planes, 119 points; contours at 2, 4, and:16 percent.IIIIc) Pole to fracture cleavage planes, 22 points; contours at[9 and 13 percent.;1IiililqII 145II"i_ > , -"' ...... M s; ..
APPENDIX BDetermination of the Temperature of a Hot WaterComponent in a Mixed Geothermal WaterA.i4, 41
APPENDIX 8Determination of the Temperature of a Hot WaterComponent in a Mixed Geothermal Water!,Truesdell and Fournier (1977) published a graphical method for,idetermining the temperature and proportion of a hot water component!,;:1:,!:mixed with cold water. The method makes use of dissolved silica-versus:YenthalPY of liquid water in equilibrium with steam.I:)ll::1~ When using the procedure it may be assumed either that no steam or\i heat has been lost from the hot water component before mi xing or that~~steam has separated from the hot-water component at an intermediate,hi:~~temperature before mixing. In either case three assumptions must be;/"made: 1) no loss of heat occurs after mixing; 2) the initial silicaI,!,Ii;,icontent of the deep hot water is controlled by the solubility oft'Jit.I:!:j,quartz, and 3) that no further solution of deposition of si lica occursllimibefore or after mixing.,'Ii:;i:!:i~ The procedure to use when assuming no loss of steam or heat before( )f."iGmixing is as follows:;;,:1:~J 1. Take an estimate or determination of the temperature and~~silicacontent of the nonthermal water in the area and plot as point A,~ :'11"":in Figure 24. Temperature can be converted to enthalpy usingFi gure 25.2. Plot the temperatures (as enthalpy) and silica content of thethermal waters as, point B on the graph in Figure 24.147
, ,iI1I;1",.,j!,I.3. Uraw a straight line through the two points and extend the1·1,'~line to intersect the quartz solubility curve, point C in Figure 24.;:1·:1;:1,point C is the enthalpy and silica content of the deep hot-waterI'!component.i'l~; 4. Use Figure 25 to convert enthalpy in calories to:Jj•lrtemperature C.I',[,q:~'5. The fraction of thermal water in the hot spring is determined~t·1'~byfl'dividing the distance AB by AC.,~[, .I; If point B lies at such a high silica value that the extension of,I'J~}heline AB does not intersect the quartz solubility curve, there are')'JfwO means of obtaining reasonable results:~r 1. The value for the silica content of the nontherma1 water was:J::j'assumed to be too low. If reasonable, this value may be increased.J}, 2. The hot water component may have lost heat, but not silica,:'L~ibeforej!''I,IIImi xing with the nontherma1 water.If heat was lost by the separation of steam an evaluation can'j,i;,U1j,148
3. Extend a line parallel to the abscissa horizonally until theximum steam-loss curve is intersected (Figure 26, point F).thalpy of the hot-water component before the onset of boiling isven by point F.TheTo obtain the original silica content before loss ofearn extend a line from point F parallel to the ordinate until theuartz solubility is intersected (point G).4. The fraction of hot water (after steam loss) in the hotspring is determined by dividing the distance AD by AE. The fractionoriginal hot water lost as steam before mixing, W.L., is given byW.L.=lsilica value at point Gsilica value at point FValues for Hot Springs Creek and Owl Creek are shown in Figure 27,suming that heat was lost as steam before mixing with cold water.For Hot Springs Creek the original silica content before boilingis 172 ppm.The frdction of hot water (AD/AE) is 91 percentd water lost as steam (1 - silica at G ) is 17%.silica at FFor Owl Creek the original silica content before boiling (point G)s 212 ppm.The fraction of hot water (AD/AE) is 45% and water lost asteam (1 - silica at G )is 18%.silica at F149!
800::!Eexa::C>0 700-.J~0::Wa.(f)~-.J-.J600500//I~z
,-400 .------~----r----.----___,---....,....--- ...--__,r__--_.___,en::Jin-I!oJUen!oJ!oJa::C)!oJ0z!oJa::;:)I- elffiQ.:2!oJI300200100o o 100 200 300 400ENTHALPY <strong>OF</strong> SATURATED LIQUID, I N INTERNATIONAL TABLE CALORIES PER GRAMFi gure 25Temperature - enthalpy relations for liquid water inequilibrium with steam. See text for explanation.151
900 r--------,----.--------r-------r---....---------,-------,....-----.800:E
c,f;T.Ii";~«{9 0 0 r----'"""T'---"T"""----r-----r-----,.-----r----,.~800a::(!)o 700-.J~a::~ 600(f)~~a:: 500 (!)-J-J-~400z~u-J-(f)300o~ 200-Jo(f)(f)o 100~/~~/~////0--------0 F.I/I9/:/ifG OWL CREEKG <strong>HOT</strong> <strong>SPRING</strong>S CREEK100200ENTHALPY, IN INTERNATIONAL TABLE CALORI ESGRAMDissolved silica-enthalpy diagram for Big Creek and Owl CreekSprings assuming that steam separated at 100°C from the hot-watercomponent before mixing (modified after Fournier, 1977).IIA and D - Enthalpy and silica content of cold and hotwater, respectively.E - Enthalpy equivalent of temperature of boiling.F - Enthalpy of hot water component before onsetof boiling.G - Silica content before loss of steam.153