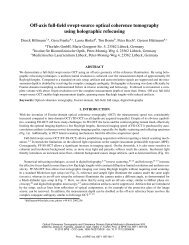
1024 Applied Physics B – Lasers and OpticsFIGURE 5 Maximum free-electron density as a function <strong>of</strong> irradiance,ϱ max (I/I rate ), for 100-fs pulses at 1064-nm, 532-nm, and 355-nm wavelengths.The normalized threshold (I/I rate = 1) and the corresponding value<strong>of</strong> ϱ max are marked by dotted lines‘tuning range’ <strong>of</strong> the irradiance for each effect. Figure 5 showsthat the tuning range increases for shorter <strong>laser</strong> wavelengths.3 Irradiance and free-electron distributionswithin the focal volume3.1 Shape <strong>of</strong> the focal volumeThe temperature and stress distribution in the focalregion depend on the distribution <strong>of</strong> quasi-free electronsproduced during <strong>femtosecond</strong> optical breakdown. Therefore,we must first explore the shape <strong>of</strong> the irradiance and freeelectrondensity distributions within the focal volume beforewe can investigate the resulting temperature and stress effects.Because <strong>of</strong> the nonlinearity <strong>of</strong> the breakdown process, thefree-electron distribution is narrower than the irradiance distributionin the focal volume. A description <strong>of</strong> their relationwill thus also allow us to estimate the possible increase <strong>of</strong> thespatial precision <strong>of</strong> the <strong>laser</strong> effects beyond the level achievablewith techniques that are based on linear absorption.The irradiance distribution in the focal volume <strong>of</strong> a diffraction-limitedoptical system for a focusing angle <strong>of</strong> α = 45 ◦ isreproduced in Fig. 6 from the textbook <strong>of</strong> Born and Wolf [140](α is the half-angle <strong>of</strong> the light cone such as used in thedefinition <strong>of</strong> the numerical <strong>aper</strong>ture NA = n 0 sin α). Theisophotes (contour lines for equal irradiance) reveal that thefocal volume in the center <strong>of</strong> the focal region has an approximatelyellipsoidal shape. A similar structure was obtainedexperimentally when the irradiance distribution ina confocal <strong>laser</strong> scanning microscope (CLSM) was measuredby scanning the tip <strong>of</strong> a scanning near field opticalmicroscope (SNOM) through the focal region (Fig. 7), andby a surface-plasmon-based beam-pr<strong>of</strong>iling technique [141].For our numerical simulations, the focal volume will thereforebe approximated by an ellipsoid with short axis d and longaxis l.The short axis d <strong>of</strong> the ellipsoid is identified with the diameter<strong>of</strong> the central maximum <strong>of</strong> the Airy pattern in the focalplane that is given byd = 1.22 λNA . (14)The symbol λ refers to the vacuum wavelength <strong>of</strong> light. Therefractive index <strong>of</strong> the medium is contained in the value <strong>of</strong>the numerical <strong>aper</strong>ture (NA) <strong>of</strong> the microscope objective. Theratio l/d <strong>of</strong> the long and short axes can be obtained from theFIGURE 6 Isophotes (contour lines for equal irradiance) in the focal region <strong>of</strong> a diffraction-limited microscope objective used to focus a plane wave. Thedashed lines represent the boundary <strong>of</strong> the geometrical focus. The focusing angle <strong>of</strong> α = 45 ◦ corresponds to a numerical <strong>aper</strong>ture <strong>of</strong> NA = 0.94 in water.When the figure is rotated around the u axis, the minima on the v axis generate the Airy dark rings. The figure is taken from Ref. [140], p. 440
VOGEL et al. <strong>Mechanisms</strong> <strong>of</strong> <strong>femtosecond</strong> <strong>laser</strong> <strong>nanosurgery</strong> <strong>of</strong> cells and tissues 1025<strong>laser</strong> pulse is approximately proportional to I k ,wherek is thenumber <strong>of</strong> photons required for multiphoton ionization. Thissimplifying assumption corresponds to the low-intensity approximation<strong>of</strong> the Keldysh theory and neglects the weakerirradiance dependence <strong>of</strong> avalanche ionization that usuallydominates plasma formation during the second half <strong>of</strong> a <strong>laser</strong>pulse (Fig. 3b). For ϱ max ≤ 5 × 10 20 cm −3 , the proportionalityϱ max ∝ I k has been confirmed by the experimental results<strong>of</strong> Mao et al. [18]. The spatial distribution <strong>of</strong> the free-electrondensity can thus be expressed as[ ( r2)]ϱ max (r, z) = ϱ max [I(0, 0)] exp −2ka 2 + z2b 2 . (17)FIGURE 7 Irradiance distribution in a confocal <strong>laser</strong> scanning microscopemeasured by scanning the tip <strong>of</strong> a scanning near field optical microscopethrough the focal region <strong>of</strong> a Zeiss axiovert 100/C-Apo ×40 NA = 1.2water-immersion microscope objective. The measurement was performed fora <strong>laser</strong> wavelength <strong>of</strong> λ = 488 nm; the isocontour lines refer to 46% <strong>of</strong> themaximum irradiance (courtesy <strong>of</strong> Volker Jüngel and Tilo Jankowski, CarlZeiss Jena)relationdl=1 − cos α, (15)(3 − 2cosα − cos 2α)1/2which was derived by Grill and Stelzer for optical setups withvery large solid angles [142]. For NA = 1.3, whichinwatercorresponds to an angle <strong>of</strong> α = 77.8 ◦ ,wefindl/d = 2.4.A similar value is also obtained from the experimental datain Fig. 7. For λ = 800 nm, the above considerations yield focaldimensions <strong>of</strong> d = 750 nm and l = 1800 nm.3.2 Irradiance and electron-density distributionswithin the focal volumeThe mathematical form <strong>of</strong> the diffraction-limitedirradiance distribution in the Fraunh<strong>of</strong>er diffraction pattern <strong>of</strong>a microscope objective (Fig. 6) is too complex for convenientcomputation <strong>of</strong> the temperature and stress evolution inducedby optical breakdown. We approximate the ellipsoidal region<strong>of</strong> high irradiance in the focus by a Gaussian function( r2I(r, z) = I(0, 0) exp[−2a 2 + z2b 2 )], (16)where r and z are the coordinates in radial and axial directions,respectively, and a = d/2 and b = l/2 denote the shortand long axes <strong>of</strong> the ellipsoid. The boundaries <strong>of</strong> the ellipsoidcorrespond to the 1/e 2 values <strong>of</strong> the Gaussian irradiancedistribution.To derive the free-electron distribution ϱ max (r, z) fromthe irradiance distribution I(r, z), we assume that for <strong>femtosecond</strong>pulses the free-electron density at the end <strong>of</strong> theFigure 8 shows the irradiance and electron-density distributionsin the focal region according to (16) and (17) forNA = 1.3 and λ = 800 nm, forwhichk = 5. Due to the nonlinearabsorption process underlying optical breakdown, thefree-electron distribution is much narrower than the irradiancedistribution. For λ = 800 nm and breakdown in water, itis narrower by a factor <strong>of</strong> √ 5 = 2.24, which corresponds toa reduction <strong>of</strong> the affected volume by a factor <strong>of</strong> 11.2. Thediameter <strong>of</strong> the free-electron distribution at the 1/e 2 valuesamounts to 336 nm and the length to 806 nm.It is interesting to note that the influence <strong>of</strong> the nonlinearity<strong>of</strong> the absorption process in plasma-mediated surgeryconsiderably reduces the gain in spatial resolution that can beachieved by using a shorter wavelength. For example, whena wavelength <strong>of</strong> 355 nm is used instead <strong>of</strong> 800 nm, the width<strong>of</strong> the diffraction-limited irradiance distribution decreases bya factor <strong>of</strong> 2.25 but the plasma diameter decreases by a factor<strong>of</strong> only 1.42 because the order <strong>of</strong> the multiphoton processis reduced from 5 to 2 and the irradiance distributionis less strongly narrowed in the process <strong>of</strong> plasma formation.However, the irradiance range leading to low-densityplasma formation is much broader for the shorter wavelengths(Fig. 5) thus making it easier to “tune” chemical and physicaleffects.When the <strong>laser</strong> pulse energy is raised above the opticalbreakdown threshold, the spatial distribution <strong>of</strong> the freeelectrondensity broadens because nonlinear absorption <strong>of</strong><strong>laser</strong> light occurs upstream <strong>of</strong> the <strong>laser</strong> focus and limits theFIGURE 8 Normalized irradiance distribution (a) and electron-density distribution(b) in the focal region for NA = 1.3 andλ = 800 nm that areassumed for the numerical calculations <strong>of</strong> the temperature and stress evolutioninduced by <strong>femtosecond</strong> optical breakdown