Innovation Canada: A Call to Action
Innovation Canada: A Call to Action Innovation Canada: A Call to Action
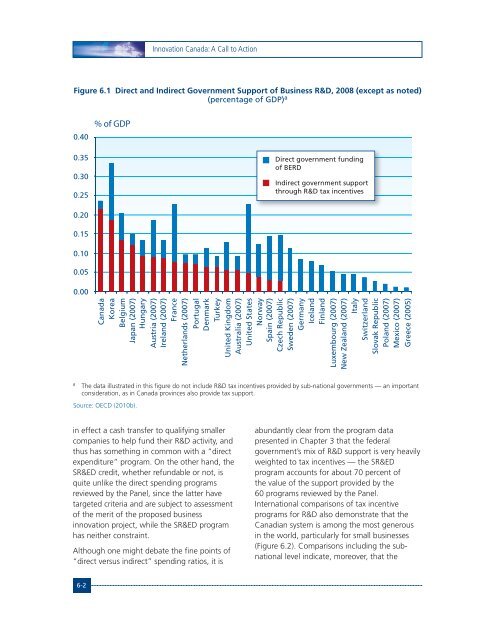
Innovation Canada: A Call to ActionFigure 6.1 Direct and Indirect Government Support of Business R&D, 2008 (except as noted)(percentage of GDP) a0.40% of GDP0.350.300.25Direct government fundingof BERDIndirect government supportthrough R&D tax incentives0.200.150.100.050.00CanadaKoreaBelgiumJapan (2007)HungaryAustria (2007)Ireland (2007)FranceNetherlands (2007)PortugalDenmarkTurkeyUnited KingdomAustralia (2007)United StatesNorwaySpain (2007)Czech RepublicSweden (2007)GermanyIcelandFinlandLuxembourg (2007)New Zealand (2007)ItalySwitzerlandSlovak RepublicPoland (2007)Mexico (2007)Greece (2005)aThe data illustrated in this figure do not include R&D tax incentives provided by sub-national governments — an importantconsideration, as in Canada provinces also provide tax support.Source: OECD (2010b).in effect a cash transfer to qualifying smallercompanies to help fund their R&D activity, andthus has something in common with a “directexpenditure” program. On the other hand, theSR&ED credit, whether refundable or not, isquite unlike the direct spending programsreviewed by the Panel, since the latter havetargeted criteria and are subject to assessmentof the merit of the proposed businessinnovation project, while the SR&ED programhas neither constraint.Although one might debate the fine points of“direct versus indirect” spending ratios, it isabundantly clear from the program datapresented in Chapter 3 that the federalgovernment’s mix of R&D support is very heavilyweighted to tax incentives — the SR&EDprogram accounts for about 70 percent ofthe value of the support provided by the60 programs reviewed by the Panel.International comparisons of tax incentiveprograms for R&D also demonstrate that theCanadian system is among the most generousin the world, particularly for small businesses(Figure 6.2). Comparisons including the subnationallevel indicate, moreover, that the6-2
Program Mix and DesignBox 6.1 Direct Support Versus Indirect SupportThe OECD (2010a, p. 76) defines direct and indirect funding as follows: “Government directR&D funding includes grants, loans and procurement. Government indirect R&D fundingincludes tax incentives such as R&D tax credits.” In practical terms, the main distinctionbetween direct and indirect support is that the latter is open ended and is available to allfirms, whereas the former is limited in overall funding and is allocated by programadministrators to specific projects, industries or regions. Direct support can therefore betargeted to specific areas, contrary to more neutral indirect measures.It follows that the principal advantage of direct instruments lies in the ability to focussupport on actors or activities considered more likely to achieve high social returns or toadvance specific policy goals. Notwithstanding the benefits associated with this ability tostrategically target resources, there are also some drawbacks to direct support measures. Inparticular, they generally involve more rigorous selection and evaluation processes, whichcan translate into higher administration costs for government and compliance costs forbeneficiaries. Moreover, they can raise some concerns around the desirability of governments“picking winners” in the marketplace.Conversely, indirect measures are advantageous for the opposite reason. Since they arenon-discriminatory and widely available across firms, sectors, fields and activities, theymore closely conform to market rationality. Indirect measures are also generally easier andcheaper to implement. The flip side, however, is that they are less amenable to being steeredtoward specific policy objectives.combination of federal and provincial tax creditsin Canada provides much higher subsidy ratesfor R&D than are available, for example, in USstates.The question therefore is whether Canada isrelying too heavily on “indirect” tax expenditurein its overall mix of business innovation/R&Dsupport. The great advantage of a tax-basedapproach is that, once basic eligibility criteria aremet, it does not discriminate on the basis ofsector, region or specific opportunity. Since theSR&ED program is based on the tax system, itoperates “automatically.” The tax incentivestimulates R&D generally, but leaves projectselection decisions to individual firms. Thegovernment does not try to pick the winners —the companies do. The strength of the programis also potentially its weakness. The tax credit isa blunt instrument. Not every R&D project willgenerate the same rate of social return; notevery R&D performer is equally in need ofstimulus or equally likely to be successful; andgovernments will often be well justified inseeking to promote, through targeted support,certain domains of innovation and R&D forstrategic purposes.Changing the Mix:More Direct SupportThe SR&ED program plays a fundamental role inlowering the costs of industrial R&D for firms,enhancing investment in R&D, and makingCanada a more attractive place to locate R&Dactivity. However, a key implication of this heavyreliance on the program is that federal supportfor innovation may be overweighted towardsubsidizing the cost of business R&D rather thanother important aspects of innovation. Inparticular, the Panel believes the federal6-3
- Page 41 and 42: The Context of the ReviewIn absolut
- Page 43 and 44: The Context of the ReviewInnovation
- Page 45 and 46: The Context of the Reviewdevelopmen
- Page 47 and 48: The Context of the ReviewBox 2.4 Wh
- Page 49 and 50: The Context of the ReviewProsperity
- Page 51 and 52: The Context of the ReviewFigure 2.6
- Page 53: The Context of the Review%115110105
- Page 56 and 57: Innovation Canada: A Call to Action
- Page 58 and 59: Innovation Canada: A Call to Action
- Page 60 and 61: Innovation Canada: A Call to Action
- Page 62 and 63: Innovation Canada: A Call to Action
- Page 64 and 65: Innovation Canada: A Call to Action
- Page 66 and 67: Innovation Canada: A Call to Action
- Page 69 and 70: Vision and PrinciplesChapterVision
- Page 71 and 72: Vision and Principlesout in Chapter
- Page 73 and 74: Program EffectivenessChapterProgram
- Page 75 and 76: Program Effectivenessand processes.
- Page 77 and 78: Program Effectivenessfull spectrum
- Page 79 and 80: Program EffectivenessFigure 5.2 Rea
- Page 81 and 82: Program EffectivenessFigure 5.4 Sat
- Page 83 and 84: Program EffectivenessBox 5.1 Operat
- Page 85 and 86: Program Effectivenessassessment of
- Page 87 and 88: Program EffectivenessFigure 5.5 Dir
- Page 89 and 90: Program EffectivenessFigure 5.6 Per
- Page 91: Program Mix and DesignChapterProgra
- Page 95 and 96: Program Mix and Designthe needs of
- Page 97 and 98: Program Mix and DesignFigure 6.3 Ta
- Page 99 and 100: Program Mix and DesignBox 6.3 Stack
- Page 101 and 102: Program Mix and Designcapital costs
- Page 103 and 104: Program Mix and Designportion of th
- Page 105 and 106: Filling the GapsChapterFilling the
- Page 107 and 108: Filling the GapsBox 7.1 Use of Proc
- Page 109 and 110: Filling the GapsBox 7.2 Canadian In
- Page 111 and 112: Filling the Gapscompetitive levels,
- Page 113 and 114: Filling the GapsBox 7.4 Institutes
- Page 115 and 116: Filling the GapsThe budgetary impli
- Page 117 and 118: Filling the GapsSuch concerns are i
- Page 119 and 120: Filling the GapsAngel InvestmentAt
- Page 121 and 122: Filling the GapsWith the foregoing
- Page 123 and 124: Filling the GapsBearing this in min
- Page 125 and 126: Leadership for InnovationChapterLea
- Page 127 and 128: Leadership for InnovationThe approp
- Page 129 and 130: Leadership for Innovationinnovation
- Page 131 and 132: ConclusionChapterConclusion9We are
- Page 133 and 134: Programs in the ReviewAnnexPrograms
- Page 135: Programs in the ReviewDepartment or
- Page 138 and 139: Innovation Canada: A Call to Action
- Page 140 and 141: Innovation Canada: A Call to Action
<strong>Innovation</strong> <strong>Canada</strong>: A <strong>Call</strong> <strong>to</strong> <strong>Action</strong>Figure 6.1 Direct and Indirect Government Support of Business R&D, 2008 (except as noted)(percentage of GDP) a0.40% of GDP0.350.300.25Direct government fundingof BERDIndirect government supportthrough R&D tax incentives0.200.150.100.050.00<strong>Canada</strong>KoreaBelgiumJapan (2007)HungaryAustria (2007)Ireland (2007)FranceNetherlands (2007)PortugalDenmarkTurkeyUnited KingdomAustralia (2007)United StatesNorwaySpain (2007)Czech RepublicSweden (2007)GermanyIcelandFinlandLuxembourg (2007)New Zealand (2007)ItalySwitzerlandSlovak RepublicPoland (2007)Mexico (2007)Greece (2005)aThe data illustrated in this figure do not include R&D tax incentives provided by sub-national governments — an importantconsideration, as in <strong>Canada</strong> provinces also provide tax support.Source: OECD (2010b).in effect a cash transfer <strong>to</strong> qualifying smallercompanies <strong>to</strong> help fund their R&D activity, andthus has something in common with a “directexpenditure” program. On the other hand, theSR&ED credit, whether refundable or not, isquite unlike the direct spending programsreviewed by the Panel, since the latter havetargeted criteria and are subject <strong>to</strong> assessmen<strong>to</strong>f the merit of the proposed businessinnovation project, while the SR&ED programhas neither constraint.Although one might debate the fine points of“direct versus indirect” spending ratios, it isabundantly clear from the program datapresented in Chapter 3 that the federalgovernment’s mix of R&D support is very heavilyweighted <strong>to</strong> tax incentives — the SR&EDprogram accounts for about 70 percent ofthe value of the support provided by the60 programs reviewed by the Panel.International comparisons of tax incentiveprograms for R&D also demonstrate that theCanadian system is among the most generousin the world, particularly for small businesses(Figure 6.2). Comparisons including the subnationallevel indicate, moreover, that the6-2


