Innovation Canada: A Call to Action
Innovation Canada: A Call to Action Innovation Canada: A Call to Action
Innovation Canada: A Call to ActionIn SummaryThe picture conveyed by the envelope of businessR&D support programs is one of dramaticallycontrasting scales. The great majority of supportis delivered by one program, the SR&ED taxcredit, which accounts for about 70 percent ofthe envelope, is not sectorally targeted andsupports business R&D spending explicitly. The 59programs in the direct expenditure envelope areextremely heterogeneous as to target, deliveryvehicle and administering agent. IRAP is by farthe largest and in 2010–11 accounted for about16 percent of direct expenditure, although thisreflects an extraordinarily increased allocation aspart of the government’s economic stimulusexpenditure. The great majority of the otherdirect spending programs each account for lessthan 2 percent of the direct total, and may insome cases be too small to have significantimpact. Moreover, the combination of small sizeand sheer number virtually ensures that there willbe little awareness among potential businesssector beneficiaries of many of the programs.This challenge is exacerbated by the largeadditional number of business innovationsupport programs delivered by provincialgovernments.The Panel believes, for reasons presented inChapter 5, that rationalization of programs isrequired to increase scale, reduce duplication,improve delivery efficiency and create muchgreater awareness among potential businesssector clients.3-12
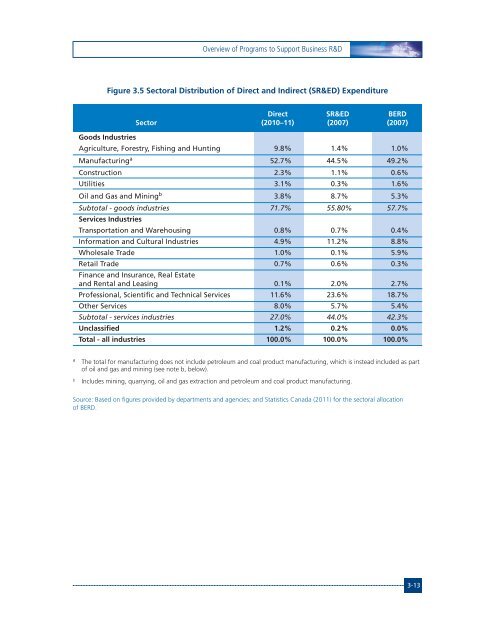
Overview of Programs to Support Business R&DFigure 3.5 Sectoral Distribution of Direct and Indirect (SR&ED) ExpenditureDirect SR&ED BERDSector (2010–11) (2007) (2007)Goods IndustriesAgriculture, Forestry, Fishing and Hunting 9.8% 1.4% 1.0%Manufacturing a 52.7% 44.5% 49.2%Construction 2.3% 1.1% 0.6%Utilities 3.1% 0.3% 1.6%Oil and Gas and Mining b 3.8% 8.7% 5.3%Subtotal - goods industries 71.7% 55.80% 57.7%Services IndustriesTransportation and Warehousing 0.8% 0.7% 0.4%Information and Cultural Industries 4.9% 11.2% 8.8%Wholesale Trade 1.0% 0.1% 5.9%Retail Trade 0.7% 0.6% 0.3%Finance and Insurance, Real Estateand Rental and Leasing 0.1% 2.0% 2.7%Professional, Scientific and Technical Services 11.6% 23.6% 18.7%Other Services 8.0% 5.7% 5.4%Subtotal - services industries 27.0% 44.0% 42.3%Unclassified 1.2% 0.2% 0.0%Total - all industries 100.0% 100.0% 100.0%abThe total for manufacturing does not include petroleum and coal product manufacturing, which is instead included as partof oil and gas and mining (see note b, below).Includes mining, quarrying, oil and gas extraction and petroleum and coal product manufacturing.Source: Based on figures provided by departments and agencies; and Statistics Canada (2011) for the sectoral allocationof BERD.3-13
- Page 16 and 17: Innovation Canada: A Call to Action
- Page 18 and 19: Innovation Canada: A Call to Action
- Page 20 and 21: Innovation Canada: A Call to Action
- Page 22 and 23: Innovation Canada: A Call to Action
- Page 24 and 25: Innovation Canada: A Call to Action
- Page 26 and 27: Innovation Canada: A Call to Action
- Page 28 and 29: Innovation Canada: A Call to Action
- Page 30 and 31: Innovation Canada: A Call to Action
- Page 32 and 33: Innovation Canada: A Call to Action
- Page 35 and 36: The Context of the ReviewChapterThe
- Page 37 and 38: The Context of the Reviewspreads wi
- Page 39 and 40: The Context of the ReviewBox 2.2 De
- Page 41 and 42: The Context of the ReviewIn absolut
- Page 43 and 44: The Context of the ReviewInnovation
- Page 45 and 46: The Context of the Reviewdevelopmen
- Page 47 and 48: The Context of the ReviewBox 2.4 Wh
- Page 49 and 50: The Context of the ReviewProsperity
- Page 51 and 52: The Context of the ReviewFigure 2.6
- Page 53: The Context of the Review%115110105
- Page 56 and 57: Innovation Canada: A Call to Action
- Page 58 and 59: Innovation Canada: A Call to Action
- Page 60 and 61: Innovation Canada: A Call to Action
- Page 62 and 63: Innovation Canada: A Call to Action
- Page 64 and 65: Innovation Canada: A Call to Action
- Page 69 and 70: Vision and PrinciplesChapterVision
- Page 71 and 72: Vision and Principlesout in Chapter
- Page 73 and 74: Program EffectivenessChapterProgram
- Page 75 and 76: Program Effectivenessand processes.
- Page 77 and 78: Program Effectivenessfull spectrum
- Page 79 and 80: Program EffectivenessFigure 5.2 Rea
- Page 81 and 82: Program EffectivenessFigure 5.4 Sat
- Page 83 and 84: Program EffectivenessBox 5.1 Operat
- Page 85 and 86: Program Effectivenessassessment of
- Page 87 and 88: Program EffectivenessFigure 5.5 Dir
- Page 89 and 90: Program EffectivenessFigure 5.6 Per
- Page 91 and 92: Program Mix and DesignChapterProgra
- Page 93 and 94: Program Mix and DesignBox 6.1 Direc
- Page 95 and 96: Program Mix and Designthe needs of
- Page 97 and 98: Program Mix and DesignFigure 6.3 Ta
- Page 99 and 100: Program Mix and DesignBox 6.3 Stack
- Page 101 and 102: Program Mix and Designcapital costs
- Page 103 and 104: Program Mix and Designportion of th
- Page 105 and 106: Filling the GapsChapterFilling the
- Page 107 and 108: Filling the GapsBox 7.1 Use of Proc
- Page 109 and 110: Filling the GapsBox 7.2 Canadian In
- Page 111 and 112: Filling the Gapscompetitive levels,
- Page 113 and 114: Filling the GapsBox 7.4 Institutes
- Page 115 and 116: Filling the GapsThe budgetary impli
Overview of Programs <strong>to</strong> Support Business R&DFigure 3.5 Sec<strong>to</strong>ral Distribution of Direct and Indirect (SR&ED) ExpenditureDirect SR&ED BERDSec<strong>to</strong>r (2010–11) (2007) (2007)Goods IndustriesAgriculture, Forestry, Fishing and Hunting 9.8% 1.4% 1.0%Manufacturing a 52.7% 44.5% 49.2%Construction 2.3% 1.1% 0.6%Utilities 3.1% 0.3% 1.6%Oil and Gas and Mining b 3.8% 8.7% 5.3%Sub<strong>to</strong>tal - goods industries 71.7% 55.80% 57.7%Services IndustriesTransportation and Warehousing 0.8% 0.7% 0.4%Information and Cultural Industries 4.9% 11.2% 8.8%Wholesale Trade 1.0% 0.1% 5.9%Retail Trade 0.7% 0.6% 0.3%Finance and Insurance, Real Estateand Rental and Leasing 0.1% 2.0% 2.7%Professional, Scientific and Technical Services 11.6% 23.6% 18.7%Other Services 8.0% 5.7% 5.4%Sub<strong>to</strong>tal - services industries 27.0% 44.0% 42.3%Unclassified 1.2% 0.2% 0.0%Total - all industries 100.0% 100.0% 100.0%abThe <strong>to</strong>tal for manufacturing does not include petroleum and coal product manufacturing, which is instead included as par<strong>to</strong>f oil and gas and mining (see note b, below).Includes mining, quarrying, oil and gas extraction and petroleum and coal product manufacturing.Source: Based on figures provided by departments and agencies; and Statistics <strong>Canada</strong> (2011) for the sec<strong>to</strong>ral allocationof BERD.3-13


