Innovation Canada: A Call to Action
Innovation Canada: A Call to Action
Innovation Canada: A Call to Action

Create successful ePaper yourself
Turn your PDF publications into a flip-book with our unique Google optimized e-Paper software.
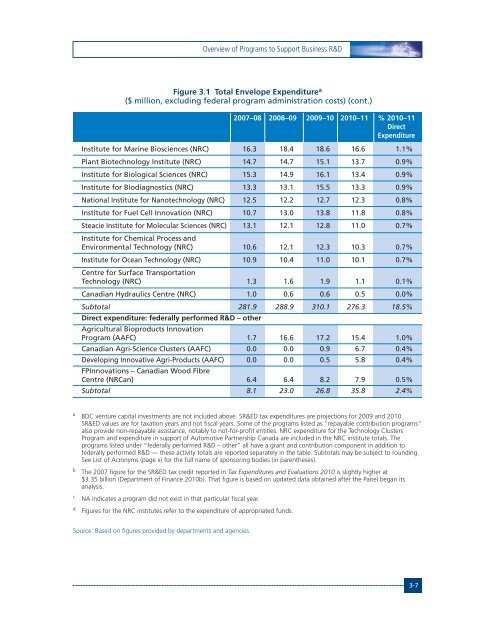
Overview of Programs <strong>to</strong> Support Business R&DFigure 3.1 Total Envelope Expenditure a($ million, excluding federal program administration costs) (cont.)2007–08 2008–09 2009–10 2010–11 % 2010–11DirectExpenditureInstitute for Marine Biosciences (NRC) 16.3 18.4 18.6 16.6 1.1%Plant Biotechnology Institute (NRC) 14.7 14.7 15.1 13.7 0.9%Institute for Biological Sciences (NRC) 15.3 14.9 16.1 13.4 0.9%Institute for Biodiagnostics (NRC) 13.3 13.1 15.5 13.3 0.9%National Institute for Nanotechnology (NRC) 12.5 12.2 12.7 12.3 0.8%Institute for Fuel Cell <strong>Innovation</strong> (NRC) 10.7 13.0 13.8 11.8 0.8%Steacie Institute for Molecular Sciences (NRC) 13.1 12.1 12.8 11.0 0.7%Institute for Chemical Process andEnvironmental Technology (NRC) 10.6 12.1 12.3 10.3 0.7%Institute for Ocean Technology (NRC) 10.9 10.4 11.0 10.1 0.7%Centre for Surface TransportationTechnology (NRC) 1.3 1.6 1.9 1.1 0.1%Canadian Hydraulics Centre (NRC) 1.0 0.6 0.6 0.5 0.0%Sub<strong>to</strong>tal 281.9 288.9 310.1 276.3 18.5%Direct expenditure: federally performed R&D – otherAgricultural Bioproducts <strong>Innovation</strong>Program (AAFC) 1.7 16.6 17.2 15.4 1.0%Canadian Agri-Science Clusters (AAFC) 0.0 0.0 0.9 6.7 0.4%Developing Innovative Agri-Products (AAFC) 0.0 0.0 0.5 5.8 0.4%FP<strong>Innovation</strong>s – Canadian Wood FibreCentre (NRCan) 6.4 6.4 8.2 7.9 0.5%Sub<strong>to</strong>tal 8.1 23.0 26.8 35.8 2.4%a BDC venture capital investments are not included above. SR&ED tax expenditures are projections for 2009 and 2010.SR&ED values are for taxation years and not fiscal years. Some of the programs listed as “repayable contribution programs”also provide non-repayable assistance, notably <strong>to</strong> not-for-profit entities. NRC expenditure for the Technology ClustersProgram and expenditure in support of Au<strong>to</strong>motive Partnership <strong>Canada</strong> are included in the NRC institute <strong>to</strong>tals. Theprograms listed under “federally performed R&D – other” all have a grant and contribution component in addition <strong>to</strong>federally performed R&D — these activity <strong>to</strong>tals are reported separately in the table. Sub<strong>to</strong>tals may be subject <strong>to</strong> rounding.See List of Acronyms (page x) for the full name of sponsoring bodies (in parentheses).bcdThe 2007 figure for the SR&ED tax credit reported in Tax Expenditures and Evaluations 2010 is slightly higher at$3.35 billion (Department of Finance 2010b). That figure is based on updated data obtained after the Panel began itsanalysis.NA indicates a program did not exist in that particular fiscal year.Figures for the NRC institutes refer <strong>to</strong> the expenditure of appropriated funds.Source: Based on figures provided by departments and agencies.3-7