Diffusion Through Membranes - Westminster College
Diffusion Through Membranes - Westminster College
Diffusion Through Membranes - Westminster College

You also want an ePaper? Increase the reach of your titles
YUMPU automatically turns print PDFs into web optimized ePapers that Google loves.
DIFFUSION THROUGH MEMBRANESSTANDARDS• 3.2.12.B.1• 3.2.12.C.4INTRODUCTION<strong>Westminster</strong> <strong>College</strong>Many aspects of the life of a cell depend on the fact that atoms and molecules havekinetic energy and are constantly in motion. This kinetic energy causes molecules tobump into each other and move in new directions. One result of this molecular motion isthe process of diffusion.<strong>Diffusion</strong> is the random movement of molecules from an area of higher concentration ofthose molecules to an area of lower concentration. For example, if one were to open abottle of hydrogen sulfide (H 2 S has the odor of rotten eggs) in one corner of a room, itwould not be long before someone in the opposite corner would perceive the smell ofrotten eggs. The bottle contains a higher concentration of H 2 S molecules than the roomdoes and therefore the H 2 S gas diffuses from the area of higher concentration to the areaof lower concentration. As long as there is a concentration gradient, where there is anarea of higher concentration of H 2 S molecules in the room, there will be net movement ofthe molecules. Eventually, dynamic equilibrium will reached; the concentration of H 2 Swill be approximately equal throughout the room and no net movement of H 2 S will occurfrom one area to the other.It is important to consider how the rate of diffusion of particles might be affected oraltered. <strong>Diffusion</strong> may be affected by the steepness of the concentration gradient (thedifference between the number of ions or molecules in one region of a substance and thatin an adjoining region). The direction that a diffusing molecule or ion might travel in anyparticular direction is random. While the particles are diffusing, is there a net movementfrom where they are concentrated to where they are less concentrated? <strong>Diffusion</strong> mightbe affected by other different, neighboring particles. For instance, if oxygen diffusestowards a single-celled pond organism at a certain rate, will that rate be altered if someother molecule suddenly surrounded the organism? Would the presence of othermolecules block or enhance the diffusion of a molecule, or would the molecule’s rate beindependent of particles that do not alter the concentration gradient?In this lab, you will directly measure the movement of salt ions through a dialysismembrane into distilled water. The use of three concentrations of salt will allow forexamination of how different concentration gradients affect the rate of diffusion. Youwill also determine if the presence of a second molecule affects the rate of salt diffusionthrough the dialysis membrane.<strong>Westminster</strong> <strong>College</strong> SIM Page 1
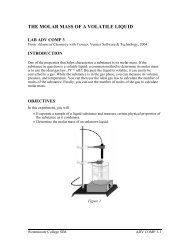
<strong>Diffusion</strong> <strong>Through</strong> <strong>Membranes</strong>GUIDING QUESTIONS• Are there ways to directly detect diffusion through a membrane?• What is the effect of different concentration gradients on the rate of diffusion?• Is the diffusion rate for a molecule affected by the presence of a second molecule?MATERIALSLabQuestdialysis tubing, 2.5 cm × 20 cmLabQuest App10 mL pipet & pipet pumpVernier Conductivity Probeplastic wrap1%, 5%, and 10% salt water plastic spoon400 mL beaker 5% sucrose (table sugar) solutionring stand and utility clamptape & permanent markerdistilled water & water bottledisposable transfer pipetPROCEDURE1. Set up the utility clamp, and ring standas shown in Figure 1.Figure 1. Set-up of <strong>Diffusion</strong> Equipment2. Set the selector switch on the side ofthe Conductivity Probe to the 0–2000µS/cm range. Connect the ConductivityProbe to LabQuest and choose New fromthe File menu. If you have an older sensorthat does not auto-ID, manually set up thesensor.a. To manually identify the sensor,stay in the Meter mode and selectSensors → Sensor Setup…..b. A sensor set-up screen will appearshowing all the available probe ports.Select the channel that the sensor isplugged into (ex. CH1 for channel 1), and tap the arrow to the side of the channelbox.c. A list of compatible probes will appear in alphabetical order. Scroll down the listand select “Conductivity” and “Conductivity 2000MICS”. Select to return tothe Meter mode screen.Figure 2. LabQuest Meter Screend. A red box will now be in this windowdisplaying a real time conductivity. Tap on thered box and select “Change Units” from the graydrop down menu. Select “mg/L” as the units forthe experiment.3. On the Meter screen , tap Rate. Change thedata-collection rate to 0.2 samples/second and thedata-collection length to 120 seconds. Select. The screen should now look like the screen shown in Fig. 2.<strong>Westminster</strong> <strong>College</strong> SIM Page 2
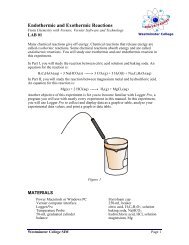
<strong>Diffusion</strong> <strong>Through</strong> <strong>Membranes</strong>Part I. Concentration Gradients4. Test whether different concentration gradientsaffect the rate of diffusion. To do this, three solutionsof differing salt concentrations (1%, 5%, and 10%)will be placed in distilled water. Each salt solutionwill be placed in a dialysis tube and allowed todiffuse into the surrounding water. When saltdiffuses, the conductivity of the water in the beakerwill increase.5. In Table 1, predict what you believe will happen inthis set of experiments. How will the rate of diffusionchange when a 10% salt solution is placed in contactwith pure water compared to when a 1% salt solutionis placed in contact with pure water?Figure 3. Dialysis tubing set-upDialysis tubingSalt solutionKnot indialysistubing6. Prepare the dialysis tubing. Obtain a wet dialysis tube. Make a knot in one end of thetube about 1 cm from the end, as in Figure 3.7. Place a 1% salt solution into a section of dialysis tubing (Fig. 3). To do this:a. Use the 10 mL pipet and pipet pump to obtain about 10 mL of the 1% salt solution.b. Use the pipet to transfer the 10 mL of the 1% salt water directly into the dialysistube, as in Figure 2. Note: To open the tube, you may need to rub the tubingbetween your fingers.c. Tie off the top of the dialysis tube with a second knot. Try to keep any air bubblesto a minimum. The tube should be full, but not too tight, after it is tied.8. Rinse the outside of the tubing with distilled water thoroughly, so that there is no saltwater adhering to the tubing. Rest the filled tubing on a piece of plastic wrap until youare ready to start the experiment. On the bench below the tubing, use tape and a markerto indicate that this tube contains the 1% salt solution.9. Repeat Step 7-8 for the 5% and 10% salt solutions. You will need to prepare 2 piecesof dialysis tubing with 5% salt solution, one for Part I and one for Part II of the lab. Donot forget to label which piece of tubing contains which percent salt solution.10. Place 300 mL of distilled or deionized water into a 400 mL beaker. Perform thefollowing steps in the order described.a. Secure the Conductivity Probe with the utility clamp in the water filled beakeras shown in Figure 1.b. Start the data collection by tapping the Start button .c. Place the 1% salt dialysis tube into the water. Be sure the tubing is completelysubmerged under the water. Important: Position the Conductivity Probe anddialysis tubing the same distance apart in each trial.d. Begin stirring the distilled water in the beaker with the plastic spoon. Stir thesolution slowly and continuously throughout the two-minute data collection<strong>Westminster</strong> <strong>College</strong> SIM Page 3
<strong>Diffusion</strong> <strong>Through</strong> <strong>Membranes</strong>period. Data collection will stop automatically after 120 seconds. A graph of the2 minute run will appear on the LabQuest screen.11. Perform a linear regression to calculate the rate of reaction. If the graph is notcompletely linear, tap and drag the stylus across a linear portion of the data. Gray shadingon the graph will indicate the section of data that will be analyzed using the followingsteps.a. While still in the Graph mode , chooseCurve Fit from the Analyze menu.b. Select Linear for the Fit Equation. Thelinear-regression statistics for these twodata columns are displayed for theequation in the formy = mx + bc. Enter the absolute value of the slope, m,as the diffusion rate in mg/L/s for 1% saltsolution in Table 2.d. Select .12. Store the data from the first run by tapping the File Cabinet icon to the right of thescreen. Remove the first dialysis tube from the beaker and dispose of it. Empty thewater from the beaker.13. Repeat Steps 10-12 for one of the 5% salt solution tubes and for the 10% saltsolution tube. Do not forget to store each run by tapping the File Cabinet icon to theright of the screen. Record the rate of diffusion for each run in Table 2.14. To view all three runs on the same graph, tap the gray Run 4 box at the right of thescreen, and select All Runs from the drop down menu.Part II. Effect of other MoleculesFigure 4. Highlight linear portion ofcurveIn this set of experiments you will measure the rate of diffusion of salt while it is in thepresence of a non-conducting molecule. Since sugar does not form ions in solution, itshould not conduct electricity. Therefore, sugar will be added to the water to determinewhether it interferes with the diffusion of salt.15. In Table 1, predict what you believe will happen in this set of experiments. Will thenon-conducting sugar in the water block or reduce the rate of diffusion of salt? Explainyour prediction.II A. Test to determine if water or a sugar solution conducts electricity.16. Go to the Meter mode by tapping the icon at the top left of the screen.<strong>Westminster</strong> <strong>College</strong> SIM Page 4
<strong>Diffusion</strong> <strong>Through</strong> <strong>Membranes</strong>17. Place about 100 mL of water in a clean 400 mL beaker. Test the conductivity of thewater by placing a clean Conductivity Probe. Let the reading in mg/L settle.18. Record the conductivity value of the water in Table 3. Empty the water from thebeaker.19. Obtain 300 mL of a 5% sugar solution and place it in the clean 400 mL beaker.20. While still in the Meter mode, test the conductivity of the 5% sugar solution byplacing a clean Conductivity Probe into it. Record the conductivity value in mg/L inTable 3. Keep the 5% sugar solution in the beaker for the next part of the lab.II B. Test if 5% sugar interferes with the diffusion of a 5% salt solution.21. Return to the Graph mode by tapping the icon at the top of the screen. Repeat theprocedure used in Part I (Steps 10-12), with the following changes:a. Use 300 mL of 5% sugar water in the beaker instead of distilled water.b. Use the second dialysis tube of 5% salt solution.c. Record the slope, m, as the rate of diffusion in (mg/L/s) in Table 4.22. To view all four runs on the same graph, tap the gray Run 5 box at the right of thescreen, and select All Runs from the drop down menu.REFERENCESThe <strong>College</strong> Board Advanced Placement Program. Biology Lab Manual for Students.Lab Two: Enzyme Catalysis. © 2001 by the <strong>College</strong> Examination Board. Pp. 1-4.The <strong>College</strong> Board Advanced Placement Program. Biology Lab Manual for Teachers.Lab Two: Enzyme Catalysis. © 2001 by the <strong>College</strong> Examination Board. Pp. 1-4.Kelly Redding and David Masterman. Advanced Biology with Vernier. (2008) <strong>Diffusion</strong>through <strong>Membranes</strong>. Vernier Software & Technology; 13979 S.W. Millikan Way,Beaverton, OR pp. 1A-1to 1A-6(O 2 ), 1A-1T to 1A-3T.CREDITSSpecial thanks John Thompson and the AP Biology class (2009-10) of Neshannock HighSchool, Neshannock Township, PA for testing, editing and reviewing this protocol. Thelab was revised and adapted from the above references by Dr. Stephanie Corrette-Bennett.<strong>Westminster</strong> <strong>College</strong> SIM Page 5
<strong>Diffusion</strong> <strong>Through</strong> <strong>Membranes</strong>DATA SHEETName: _______________________Group: _______________________Date: _______________________DATA ANALYSISTable 1: PredictionsPart IPart IIPart I:Table 2: Rate of Salt <strong>Diffusion</strong>Salt Concentration (%) Rate of <strong>Diffusion</strong> (mg/L/s)1510Part II:Table 3: Conductivity ReadingsSolution Conductivity (mg/L)Distilled water5% sugarTable 4: Comparison of <strong>Diffusion</strong>Solution Rate of <strong>Diffusion</strong> (mg/L/s)5% salt/water5% salt/5% sugarQUESTIONS1. Which substance is leaving the dialysis bag? Which is entering the bag? Draw apicture of the movement of the solution molecules.<strong>Westminster</strong> <strong>College</strong> SIM Page 6
<strong>Diffusion</strong> <strong>Through</strong> <strong>Membranes</strong>2. What quantitative data indicates that there is material leaving the dialysis bag? Doesthe concentration of the solution inside the bag affect the rate of diffusion of molecules?3. In Part II of the lab, does the presence of a sugar molecule in solution outside thedialysis bag affect the rate of diffusion by the molecules inside the bag? Why is this?4. Design an experiment that would quantitatively show that material is entering thedialysis bag.5. In a different experiment, a solution of lactose (a double ring sugar) is place inside thedialysis bag. How do you think the rate of diffusion of lactose will compare with the rateof sodium chloride diffusion?<strong>Westminster</strong> <strong>College</strong> SIM Page 7