

aNDF, NDFd, iNDF, ADL and kd: What have we learned?
aNDF, NDFd, iNDF, ADL and kd: What have we learned?
aNDF, NDFd, iNDF, ADL and kd: What have we learned?

Create successful ePaper yourself
Turn your PDF publications into a flip-book with our unique Google optimized e-Paper software.
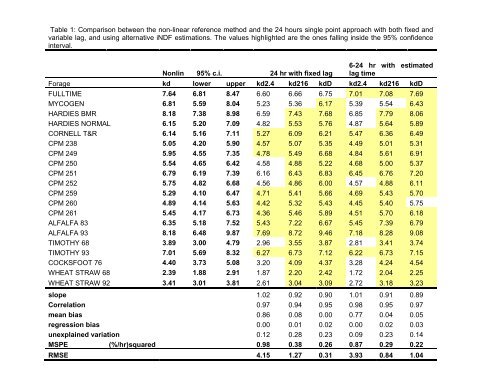
Table 1: Comparison bet<strong>we</strong>en the non-linear reference method <strong>and</strong> the 24 hours single point approach with both fixed <strong>and</strong><br />
variable lag, <strong>and</strong> using alternative <strong>iNDF</strong> estimations. The values highlighted are the ones falling inside the 95% confidence<br />
interval.<br />
Nonlin 95% c.i.<br />
24 hr with fixed lag<br />
6-24 hr with estimated<br />
lag time<br />
Forage <strong>kd</strong> lo<strong>we</strong>r upper <strong>kd</strong>2.4 <strong>kd</strong>216 <strong>kd</strong>D <strong>kd</strong>2.4 <strong>kd</strong>216 <strong>kd</strong>D<br />
FULLTIME<br />
7.64 6.81 8.47 6.60 6.66 6.75 7.01 7.08 7.69<br />
MYCOGEN<br />
6.81 5.59 8.04 5.23 5.36 6.17 5.39 5.54 6.43<br />
HARDIES BMR<br />
8.18 7.38 8.98 6.59 7.43 7.68 6.85 7.79 8.06<br />
HARDIES NORMAL 6.15 5.20 7.09 4.82 5.53 5.76 4.87 5.64 5.89<br />
CORNELL T&R<br />
6.14 5.16 7.11 5.27 6.09 6.21 5.47 6.36 6.49<br />
CPM 238<br />
5.05 4.20 5.90 4.57 5.07 5.35 4.49 5.01 5.31<br />
CPM 249<br />
5.95 4.55 7.35 4.78 5.49 6.68 4.84 5.61 6.91<br />
CPM 250<br />
5.54 4.65 6.42 4.58 4.88 5.22 4.68 5.00 5.37<br />
CPM 251<br />
6.79 6.19 7.39 6.16 6.43 6.83 6.45 6.76 7.20<br />
CPM 252<br />
5.75 4.82 6.68 4.56 4.86 6.00 4.57 4.88 6.11<br />
CPM 259<br />
5.29 4.10 6.47 4.71 5.41 5.66 4.69 5.43 5.70<br />
CPM 260<br />
4.89 4.14 5.63 4.42 5.32 5.43 4.45 5.40 5.75<br />
CPM 261<br />
5.45 4.17 6.73 4.36 5.46 5.89 4.51 5.70 6.18<br />
ALFALFA 83<br />
6.35 5.18 7.52 5.43 7.22 6.67 5.45 7.39 6.79<br />
ALFALFA 93<br />
8.18 6.48 9.87 7.69 8.72 9.46 7.18 8.28 9.08<br />
TIMOTHY 68<br />
3.89 3.00 4.79 2.96 3.55 3.87 2.81 3.41 3.74<br />
TIMOTHY 93<br />
7.01 5.69 8.32 6.27 6.73 7.12 6.22 6.73 7.15<br />
COCKSFOOT 76 4.40 3.73 5.08 3.20 4.09 4.37 3.28 4.24 4.54<br />
WHEAT STRAW 68 2.39 1.88 2.91 1.87 2.20 2.42 1.72 2.04 2.25<br />
WHEAT STRAW 92 3.41 3.01 3.81 2.61 3.04 3.09 2.72 3.18 3.23<br />
slope<br />
1.02 0.92 0.90 1.01 0.91 0.89<br />
Correlation<br />
0.97 0.94 0.95 0.98 0.95 0.97<br />
mean bias<br />
0.86 0.08 0.00 0.77 0.04 0.05<br />
regression bias<br />
0.00 0.01 0.02 0.00 0.02 0.03<br />
unexplained variation<br />
0.12 0.28 0.23 0.09 0.23 0.14<br />
MSPE (%/hr)squared 0.98 0.38 0.26 0.87 0.29 0.22<br />
RMSE 4.15 1.27 0.31 3.93 0.84 1.04