Fracture Toughness and Crack Growth Rates of Irradiated Austenitic ...
Fracture Toughness and Crack Growth Rates of Irradiated Austenitic ...
Fracture Toughness and Crack Growth Rates of Irradiated Austenitic ...

You also want an ePaper? Increase the reach of your titles
YUMPU automatically turns print PDFs into web optimized ePapers that Google loves.
NUREG/CR–6826ANL–03/22<strong>Fracture</strong> <strong>Toughness</strong> <strong>and</strong><strong>Crack</strong> <strong>Growth</strong> <strong>Rates</strong> <strong>of</strong><strong>Irradiated</strong> <strong>Austenitic</strong> Stainless SteelsManuscript Completed: March 2003Date Published: August 2003Prepared byO. K. Chopra, E. E. Gruber, <strong>and</strong> W. J. ShackArgonne National Laboratory9700 South Cass AvenueArgonne, IL 60439W. H. Cullen, Jr., <strong>and</strong> C. E. Moyer, NRC Project ManagersPrepared forDivision <strong>of</strong> Engineering TechnologyOffice <strong>of</strong> Nuclear Regulatory ResearchU.S. Nuclear Regulatory CommissionWashington, DC 20555–0001NRC Job Code Y6388
<strong>Fracture</strong> <strong>Toughness</strong> <strong>and</strong> <strong>Crack</strong> <strong>Growth</strong> <strong>Rates</strong><strong>of</strong> <strong>Irradiated</strong> <strong>Austenitic</strong> Stainless SteelsbyO. K. Chopra, E. E. Gruber, <strong>and</strong> W. J. ShackAbstract<strong>Austenitic</strong> stainless steels (SSs) are used extensively as structural alloys in the internalcomponents <strong>of</strong> reactor pressure vessels because <strong>of</strong> their superior fracture toughnessproperties. However, exposure to high levels <strong>of</strong> neutron irradiation for extended periods leadsto significant reduction in the fracture resistance <strong>of</strong> these steels. Experimental data arepresented on fracture toughness <strong>and</strong> crack growth rates (CGRs) <strong>of</strong> austenitic SSs irradiated t<strong>of</strong>luence levels up to 2.0 x 10 21 n/cm 2 (E > 1 MeV) (ª3.0 dpa) at ª288°C. <strong>Crack</strong> growth testswere conducted under cycling loading <strong>and</strong> long hold time trapezoidal loading in simulatedboiling water reactor (BWR) environments, <strong>and</strong> fracture toughness tests were conducted in air.Neutron irradiation at 288°C decreases the fracture toughness <strong>of</strong> the steels; the data fromcommercial heats fall within the scatter b<strong>and</strong> for the data obtained at higher temperatures. Inaddition, the results indicate significant enhancement <strong>of</strong> CGRs <strong>of</strong> the irradiated steels innormal water chemistry BWR environment; the CGRs for irradiated steels are a factor <strong>of</strong> ª5higher than the disposition curve proposed for sensitized austenitic SSs. The rates decreasedby more than an order <strong>of</strong> magnitude in low–dissolved–oxygen BWR environment.iii
ContentsAbstract....................................................................................................................................Executive Summary.................................................................................................................Acknowledgments ....................................................................................................................iiixiiixv1. Introduction .................................................................................................................... 12. Experimental................................................................................................................... 32.1 J–R Curve Characterization................................................................................ 62.2 <strong>Crack</strong> <strong>Growth</strong> Rate Tests.................................................................................... 112.2.1 Procedure............................................................................................. 112.2.2 Data Qualification ............................................................................... 122.2.3 Effect <strong>of</strong> Specimen Size........................................................................ 133. Results............................................................................................................................. 153.1 <strong>Fracture</strong> <strong>Toughness</strong>............................................................................................ 153.1.1 Nonirradiated Type 304 Stainless Steel.............................................. 153.1.2 <strong>Irradiated</strong> Type 304 Stainless Steels................................................... 183.2 <strong>Crack</strong> <strong>Growth</strong> Tests on <strong>Irradiated</strong> Stainless Steels in BWR Environments...... 213.2.1 Specimen C3-B <strong>Irradiated</strong> to 0.9 x 10 21 n/cm 2 ................................. 223.2.2 Specimen C3-C <strong>Irradiated</strong> to 2.0 x 10 21 n/cm 2 ................................. 263.2.3 Specimen C16-B <strong>Irradiated</strong> to 2.0 x 10 21 n/cm 2 ............................... 293.2.4 Specimen C3-A <strong>Irradiated</strong> to 0.3 x 10 21 n/cm 2 ................................. 343.2.5 CGRs <strong>of</strong> <strong>Irradiated</strong> <strong>Austenitic</strong> SSs under Continuous Cycling .......... 373.2.6 CGRs <strong>of</strong> <strong>Irradiated</strong> <strong>Austenitic</strong> SSs under Cycling with Long HoldPeriods ................................................................................................. 384. Summary......................................................................................................................... 39References ................................................................................................................................ 41Appendix .................................................................................................................................. 45v
Figures1. <strong>Fracture</strong> toughness JIc as a function <strong>of</strong> neutron exposure for austeniticTypes 304 <strong>and</strong> 316 SS ............................................................................................... 12. Configuration <strong>of</strong> compact–tension specimen used for this study............................. 33. Schematic representation <strong>of</strong> hot–cell J–R test facility............................................... 34. Schematic <strong>of</strong> the actuator, load cell, test train, autoclave, <strong>and</strong> furnace.................. 45. Schematic diagram <strong>of</strong> recirculating water system .................................................... 56. Examples <strong>of</strong> load-vs.-loadline displacement curves for irradiated specimens <strong>of</strong>Heats C19 <strong>and</strong> L20 <strong>of</strong> Type 304 SS tested at 288°C................................................. 77. <strong>Fracture</strong> toughness J–R curves obtained from DC potential <strong>and</strong> elasticunloading compliance methods for specimens Y4–02 <strong>and</strong> Y4–03 <strong>of</strong> thermallyaged cast CF–8M SS................................................................................................... 98. <strong>Fracture</strong> toughness J–R curves obtained from DC potential <strong>and</strong> elasticunloading compliance methods for thermally aged Heat 75 <strong>of</strong> cast CF–8M SS;specimen 75–03T, 75–04T, <strong>and</strong> 75–10T.................................................................... 109. <strong>Fracture</strong> toughness J–R curves obtained from DC potential <strong>and</strong> elasticunloading compliance methods for 50% cold–worked Type 316NG; specimen184–38 <strong>and</strong> 184–40.................................................................................................... 1010. <strong>Fracture</strong> toughness J–R curves for 1/4–T <strong>and</strong> 1–T CT specimens <strong>of</strong> aged Heat 75<strong>of</strong> CF–8M cast stainless steel at 288°C...................................................................... 1111. <strong>Crack</strong> growth rate data under continuous cycling for thermally aged cast SS <strong>and</strong>50% cold–worked Type 316LN SS in high–purity water at 289°C. ........................... 1312. Stress corrosion cracking data for austenitic stainless steels in high–DO water at289°C.......................................................................................................................... 1413. <strong>Fracture</strong> toughness J–R curve obtained by DC potential <strong>and</strong> unloadingcompliance methods for nonirradiated specimens L2–C <strong>and</strong> L2–E <strong>of</strong> Heat L2 <strong>of</strong>Type 304 SS at 288°C. ............................................................................................... 1514. <strong>Fracture</strong> toughness J–R curve obtained by DC potential <strong>and</strong> unloadingcompliance methods for nonirradiated specimen L20–D <strong>of</strong> Heat L20 <strong>of</strong>Type 304 SS at 288°C. ............................................................................................... 1615. <strong>Fracture</strong> toughness J–R curve obtained by DC potential <strong>and</strong> unloadingcompliance methods for nonirradiated specimens C16–C <strong>and</strong> C16–D <strong>of</strong> Heat C16<strong>of</strong> Type 316 SS at 288°C. ........................................................................................... 1616. <strong>Fracture</strong> toughness J–R curve obtained by DC potential <strong>and</strong> unloadingcompliance methods for nonirradiated specimen C19–D <strong>of</strong> Heat C19 <strong>of</strong>Type 304 SS at 288°C. ............................................................................................... 17vi
17. <strong>Fracture</strong> toughness J–R curves for nonirradiated Type 304 stainless steelsat 288°C...................................................................................................................... 1718. Photomicrographs <strong>of</strong> fracture surfaces <strong>of</strong> nonirradiated specimens <strong>of</strong> Heats L2<strong>and</strong> L20 tested at 288°C. ........................................................................................... 1719. Photomicrograph <strong>of</strong> fracture surface <strong>of</strong> nonirradiated specimen <strong>of</strong> Heat C19tested at 288°C........................................................................................................... 1820. Photomicrograph <strong>of</strong> MnS inclusions on the fracture surface <strong>of</strong> nonirradiatedspecimen <strong>of</strong> Heat L2 tested at 288°C......................................................................... 1821. <strong>Fracture</strong> toughness J–R curve obtained by DC potential <strong>and</strong> unloadingcompliance methods at 288°C for Heat C19 <strong>of</strong> Type 304 SS irradiated to afluence level <strong>of</strong> 0.3, 0.9, <strong>and</strong> 2.0 x 10 21 n/cm 2 . ....................................................... 1922. <strong>Fracture</strong> toughness J–R curve obtained by DC potential <strong>and</strong> unloadingcompliance methods at 288°C for Heat C16 <strong>of</strong> Type 316 SS irradiated to afluence level <strong>of</strong> 0.9 x 10 21 n/cm 2 .............................................................................. 2023. <strong>Fracture</strong> toughness J–R curve obtained by DC potential <strong>and</strong> unloadingcompliance methods at 288°C for Heat L20 <strong>of</strong> Type 304 SS irradiated to afluence level <strong>of</strong> 0.3 <strong>and</strong> 0.9 x 10 21 n/cm 2 ................................................................. 2024. <strong>Fracture</strong> toughness J–R curve obtained by DC potential <strong>and</strong> unloadingcompliance methods at 288°C for Heat L2 <strong>of</strong> Type 304 SS irradiated to a fluencelevel <strong>of</strong> 0.9 x 10 21 n/cm 2 ........................................................................................... 2125. <strong>Fracture</strong> toughness JIc <strong>of</strong> austenitic stainless steels as a function <strong>of</strong> neutronexposure at 288°C...................................................................................................... 2126. Changes in crack length <strong>and</strong> ECP after the dissolved oxygen level in thefeedwater was decreased from ª500 to 10 ppb <strong>and</strong> increased from ª10 to300 ppb ...................................................................................................................... 2327. Photomicrographs <strong>of</strong> the fracture surface <strong>of</strong> specimen C3–B tested in high–puritywater at 289°C............................................................................................................ 2328. <strong>Crack</strong>–length–vs.–time plots for irradiated Type 304 SS in high–purity water at289°C during test periods 2–5, 6, 7–8, 9–12, <strong>and</strong> 14–15.......................................... 2429. Change in crack length <strong>and</strong> ECP <strong>of</strong> Pt <strong>and</strong> SS electrodes for Specimen C3–Cafter the dissolved oxygen level in the feedwater was decreased from ª300 to10 ppb......................................................................................................................... 2730. Photomicrographs <strong>of</strong> the fracture surface <strong>of</strong> Specimen C3–C .................................. 2731. <strong>Crack</strong>–length–vs.–time plots for irradiated Type 304 SS in high–purity water at289°C during test periods 1–2, 3–5, 6–7, <strong>and</strong> 7–8 .................................................... 2832. Change in crack length <strong>and</strong> ECP <strong>of</strong> Pt <strong>and</strong> SS electrodes when the DO level infeedwater was decreased from ª300 to
33. Photomicrographs <strong>of</strong> the fracture surface <strong>of</strong> Specimen C16–B ................................ 3134. <strong>Crack</strong>–length–vs.–time plots for irradiated Type 316 SS in high–purity water at289°C during test periods up to 1, 2–3, 4–5, 6–7, 8–10, 11–12, <strong>and</strong> 13–15............ 3135. Photomicrographs <strong>of</strong> the fracture surface <strong>of</strong> Specimen C3–A................................... 3536. <strong>Crack</strong>–length–vs.–time plots for irradiated Type 316 SS in high–purity water at289°C during test periods 1–2, 3–5, 6–7, 8–10, <strong>and</strong> 11–12...................................... 3537. CGR data for irradiated austenitic SSs under continuous cycling at 289°C inhigh–purity water with ª300 ppb <strong>and</strong>
A-8.2. <strong>Fracture</strong> surface <strong>of</strong> specimen C19–D tested at 288°C .............................................. 62A-9.1.Load-vs.-loadline displacement curve for specimen C16–C <strong>of</strong> nonirradiatedType 316 SS tested at 288°C ..................................................................................... 64A-9.2. <strong>Fracture</strong> surface <strong>of</strong> specimen C16–C tested at 288°C............................................... 64A-10.1. Load-vs.-loadline displacement curve for specimen C16–D <strong>of</strong> nonirradiatedType 316 SS tested at 288°C ..................................................................................... 66A-10.2. <strong>Fracture</strong> surface <strong>of</strong> specimen C16–D tested at 288°C .............................................. 66A-11.1. Load-vs.-loadline displacement curve for specimen L20–D <strong>of</strong> nonirradiatedType 304 SS tested at 288°C ..................................................................................... 68A-11.2. <strong>Fracture</strong> surface <strong>of</strong> specimen L20–D tested at 288°C............................................... 68A-12.1. Load-vs.-loadline displacement curve for specimen L2–C <strong>of</strong> nonirradiatedType 304 SS tested at 288°C ..................................................................................... 70A-12.2. <strong>Fracture</strong> surface <strong>of</strong> specimen L2–C tested at 288°C ................................................. 70A-13.1. Load-vs.-loadline displacement curve for specimen L2–E <strong>of</strong> nonirradiatedType 304 SS tested at 288°C ..................................................................................... 72A-13.2. <strong>Fracture</strong> surface <strong>of</strong> specimen L2–E tested at 288°C ................................................. 72A-14.1Load-vs.-loadline displacement curve for specimen C19–A <strong>of</strong> irradiatedType 304 SS tested at 288°C ..................................................................................... 74A-14.2 <strong>Fracture</strong> surface <strong>of</strong> specimen C19–A tested at 288°C............................................... 74A-15.1Load-vs.-loadline displacement curve for specimen C19–B <strong>of</strong> irradiatedType 304 SS tested at 288°C ..................................................................................... 76A-15.2 <strong>Fracture</strong> surface <strong>of</strong> specimen C19–B tested at 288°C............................................... 76A-16.1Load-vs.-loadline displacement curve for specimen C19–C <strong>of</strong> irradiatedType 304 SS tested at 288°C ..................................................................................... 78A-16.2 <strong>Fracture</strong> surface <strong>of</strong> specimen C19–C tested at 288°C............................................... 78A-17.1Load-vs.-loadline displacement curve for specimen C16–A <strong>of</strong> irradiatedType 316 SS tested at 288°C ..................................................................................... 80A-17.2 <strong>Fracture</strong> surface <strong>of</strong> specimen C16–A tested at 288°C............................................... 80A-18.1. Load-vs.-loadline displacement curve for specimen L20–A <strong>of</strong> irradiatedType 304 SS tested at 288°C ..................................................................................... 82A-18.2. <strong>Fracture</strong> surface <strong>of</strong> specimen L20–A tested at 288°C ............................................... 82A-19.1. Load-vs.-loadline displacement curve for specimen L20–B <strong>of</strong> irradiatedType 304 SS tested at 288°C ..................................................................................... 84ix
A-19.2. <strong>Fracture</strong> surface <strong>of</strong> specimen L20–B tested at 288°C............................................... 84A-20.1. Load-vs.-loadline displacement curve for specimen L2–A <strong>of</strong> irradiatedType 304 SS tested at 288°C ..................................................................................... 86A-20.2. <strong>Fracture</strong> surface <strong>of</strong> specimen L2–A tested at 288°C ................................................. 86Tables1. Composition <strong>of</strong> austenitic stainless steels irradiated in the Halden reactor............ 62. Tensile properties <strong>of</strong> irradiated austenitic stainless steels at 288°C........................ 63. <strong>Crack</strong> growth results for Specimen C3–B <strong>of</strong> Type 304 SS in high–purity waterat 289°C...................................................................................................................... 224. <strong>Crack</strong> growth results for Specimen C3–C <strong>of</strong> Type 304 SS in high–purity waterat 289°C...................................................................................................................... 265. <strong>Crack</strong> growth results for Specimen C16–B <strong>of</strong> Type 316 SS in high–purity waterat 289°C...................................................................................................................... 296. <strong>Crack</strong> growth results for Specimen C3–A <strong>of</strong> Type 304 SS in high–purity waterat 289°C...................................................................................................................... 34A-1.A-2.A-3.A-4.A-5.A-6.A-7.Test data for specimen Y4–03 <strong>of</strong> thermally aged CF–8M cast SS tested at288°C.......................................................................................................................... 47Test data for specimen Y4–02 <strong>of</strong> thermally aged CF–8M cast SS tested at288°C.......................................................................................................................... 49Test data for specimen 75–03T <strong>of</strong> thermally aged CF–8M cast SS tested at288°C.......................................................................................................................... 51Test data for specimen 75–04T <strong>of</strong> thermally aged CF–8M cast SS tested at288°C.......................................................................................................................... 53Test data for specimen 75–10T <strong>of</strong> thermally aged CF–8M cast SS tested at288°C.......................................................................................................................... 55Test data for specimen 184–38 <strong>of</strong> 50% cold–worked Type 316NG SS tested at288°C.......................................................................................................................... 57Test data for specimen 184–40 <strong>of</strong> 50% cold–worked Type 316NG SS tested at288°C.......................................................................................................................... 59A-8. Test data for specimen C19–D <strong>of</strong> nonirradiated Type 304 SS tested at 288°C ........ 61A-9. Test data for specimen C16–C <strong>of</strong> nonirradiated Type 316 SS tested at 288°C ........ 63x
A-10. Test data for specimen C16–D <strong>of</strong> nonirradiated Type 316 SS tested at 288°C ........ 65A-11. Test data for specimen L20–D <strong>of</strong> nonirradiated Type 304 SS tested at 288°C......... 67A-12. Test data for specimen L2–C <strong>of</strong> nonirradiated Type 304 SS tested at 288°C........... 69A-13. Test data for specimen L2–E <strong>of</strong> nonirradiated Type 304 SS tested at 288°C........... 71A-14. Test data for specimen C19–A <strong>of</strong> irradiated Type 304 SS tested at 288°C............... 73A-15. Test data for specimen C19–B <strong>of</strong> irradiated Type 304 SS tested at 288°C............... 75A-16. Test data for specimen C19–C <strong>of</strong> irradiated Type 304 SS tested at 288°C .............. 77A-17. Test data for specimen C16–A <strong>of</strong> irradiated Type 316 SS tested at 288°C............... 79A-18. Test data for specimen L20–A <strong>of</strong> irradiated Type 304 SS tested at 288°C ............... 81A-19. Test data for specimen L20–B <strong>of</strong> irradiated Type 304 SS tested at 288°C............... 83A-20. Test data for specimen L2–A <strong>of</strong> irradiated Type 304 SS tested at 288°C ................. 85xi
xii
Executive Summary<strong>Austenitic</strong> stainless steels (SSs) are used extensively as structural alloys in the internalcomponents <strong>of</strong> reactor pressure vessels because <strong>of</strong> their high strength, ductility, <strong>and</strong> fracturetoughness. <strong>Fracture</strong> <strong>of</strong> these steels occurs by stable tearing at stresses well above the yieldstress, <strong>and</strong> tearing instabilities require extensive plastic deformation. However, exposure toneutron irradiation for extended periods changes the microstructure <strong>and</strong> degrades the fractureproperties <strong>of</strong> these steels. Irradiation leads to a significant increase in yield strength <strong>and</strong>reduction in ductility <strong>and</strong> fracture resistance <strong>of</strong> austenitic SSs. Existing data on fracturetoughness <strong>of</strong> austenitic SSs indicate substantial decrease in toughness at exposures <strong>of</strong>1–10 dpa; the effect is largest in high–toughness steels. However, most <strong>of</strong> the existing fracturetoughness test data have been obtained at temperatures above 350°C; fracture toughnessresults that are relevant to light water reactors (LWRs) are very limited.In addition, radiation can exacerbate the corrosion fatigue <strong>and</strong> stress corrosion cracking(SCC) behavior <strong>of</strong> SSs by affecting the material microchemistry, e.g., radiation–inducedsegregation; material microstructure, e.g., radiation hardening; <strong>and</strong> water chemistry, e.g.,radiolysis. Service failures in core components <strong>of</strong> several operating reactors have beenattributed to irradiation assisted stress corrosion cracking (IASCC). While initially consideredas a unique form <strong>of</strong> cracking that would not occur in the absence <strong>of</strong> radiation, IASCC is nowgenerally considered as a radiation accelerated environmental cracking process. It has beentermed as premature subcritical cracking <strong>of</strong> materials exposed to ionizing irradiation. Thefactors that influence SCC susceptibility <strong>of</strong> materials include neutron fluence, cold work,corrosion potential, water purity, temperature, <strong>and</strong> loading.This report presents experimental data on fracture toughness <strong>and</strong> crack growth rate(CGR) for austenitic Types 304 <strong>and</strong> 316 SS that were irradiated to fluence levels <strong>of</strong> ª0.3, 0.9,<strong>and</strong> 2.0 x 10 21 n/cm 2 (E > 1 MeV) (ª0.45, 1.35, <strong>and</strong> 3.0 dpa) at ª288°C. The irradiations werecarried out in a He environment in the Halden heavy water boiling reactor. <strong>Fracture</strong> toughnesstests were conducted in air <strong>and</strong> CGR tests in normal water chemistry (NWC) <strong>and</strong> hydrogenwater chemistry (HWC) BWR environments at ª288°C. All tests were performed on 1/4–Tcompact tension specimens.Neutron irradiation at 288°C to 2.0 x 10 21 n/cm 2 (E > 1 MeV) (3.0 dpa) decreased thefracture toughness <strong>of</strong> all <strong>of</strong> the steels. In general, fracture toughness <strong>of</strong> the commercial HeatsC16 <strong>and</strong> C19 is superior to that <strong>of</strong> the laboratory Heats L20 <strong>and</strong> L2. These differences ariseprimarily from differences in toughness <strong>of</strong> the nonirradiated steels, i.e., the fracture toughness<strong>of</strong> the laboratory heats is significantly lower than that <strong>of</strong> the commercial heats. The fracturetoughness J–R curves for irradiated Types 304 <strong>and</strong> 316 SS are comparable. The data fromcommercial heats fall within the scatter b<strong>and</strong> for the data obtained at higher temperatures.For Heat C19 <strong>of</strong> Type 304 SS irradiated to 0.3, 0.9, <strong>and</strong> 2.0 x 10 21 n/cm 2 , the J Ic values are507, 313, <strong>and</strong> 188 kJ/m 2 , respectively.The results indicate significant enhancement <strong>of</strong> CGRs <strong>of</strong> irradiated steel in the NWC BWRenvironment. The CGRs <strong>of</strong> irradiated steels are a factor <strong>of</strong> ª5 higher than the disposition curveproposed in NUREG–0313 for sensitized austenitic SSs in water with 8 ppm dissolved oxygen(DO). The CGRs <strong>of</strong> Type 304 SS irradiated to 0.9 <strong>and</strong> 2.0 x 10 21 n/cm 2 <strong>and</strong> <strong>of</strong> Types 304 <strong>and</strong>316 SS irradiated to 2.0 x 10 21 n/cm 2 are comparable.xiii
In low–DO BWR environments, the CGRs <strong>of</strong> the irradiated steels decreased by an order <strong>of</strong>magnitude in some tests, e.g., Heat C3 <strong>of</strong> Type 304 SS irradiated to 0.9 x 10 21 n/cm 2 <strong>and</strong> HeatC16 <strong>of</strong> Type 316 SS irradiated to 2 x 10 21 n/cm 2 . The beneficial effect <strong>of</strong> decreased DO wasnot observed for Heat C3 <strong>of</strong> Type 304 SS irradiated to 2 x 10 21 n/cm 2 ; it is possible that thisdifferent behavior is associated with the loss <strong>of</strong> constraint in the specimen due to the highapplied load.Type 304 SS irradiated to 0.3 x 10 21 n/cm 2 shows very little environmental enhancement<strong>of</strong> CGRs in the NWC BWR environment; the CGRs under SCC conditions are below thedisposition curve for sensitized SSs in water with 8 ppm DO given in NUREG–0313.xiv
AcknowledgmentsThe authors thank T. M. Galvin, L. A. Knoblich, E. J. Listwan, <strong>and</strong> R. W. Clark for theircontributions to the experimental effort. This work is sponsored by the Office <strong>of</strong> NuclearRegulatory Research, U.S. Nuclear Regulatory Commission, under Job Code Y6388; ProjectManager: W. H. Cullen, Jr. <strong>and</strong> C. E. Moyer.xv
xvi
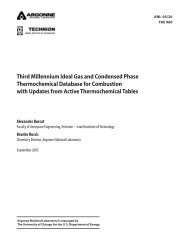
1. Introduction<strong>Austenitic</strong> stainless steels (SSs) are used extensively as structural alloys in reactorpressure vessel internal components because <strong>of</strong> their high strength, ductility, <strong>and</strong> fracturetoughness. <strong>Fracture</strong> <strong>of</strong> these steels occurs by stable tearing at stresses well above the yieldstress, <strong>and</strong> tearing instabilities require extensive plastic deformation. However, exposure toneutron irradiation for extended periods changes the microstructure <strong>and</strong> degrades the fractureproperties <strong>of</strong> these steels. Irradiation leads to a significant increase in yield strength <strong>and</strong>reduction in ductility <strong>and</strong> fracture resistance <strong>of</strong> austenitic SSs. 1–3 Changes in mechanicalproperties are known to influence fatigue or corrosion fatigue properties <strong>of</strong> irradiatedmaterials. 4 Irradiation assisted stress corrosion cracking (IASCC) is another degradationprocess that affects light water reactor (LWR) internals exposed to fast neutron radiation. 1,5,6Neutron irradiation <strong>of</strong> austenitic SSs at temperatures below 400°C leads to the formation<strong>of</strong> a substructure with very fine defects that consist <strong>of</strong> small (5 nm) faulted interstitial loops. 7–9 The latter are obstaclesto dislocation motion <strong>and</strong> lead to matrix strengthening <strong>and</strong> increase in tensile strength. Also,irradiation–induced defects cause loss <strong>of</strong> ductility <strong>and</strong> reduced strain-hardening capacity <strong>of</strong> thematerial. The effects <strong>of</strong> radiation on various austenitic SSs vary significantly <strong>and</strong> appear to berelated to minor differences in the chemical composition <strong>of</strong> the steels; 1 the chemicalcomposition can influence the stacking fault energy <strong>and</strong>/or irradiation–inducedmicrostructure. As yield strength approaches ultimate strength, planar slip or dislocationchanneling is promoted <strong>and</strong> leads to pronounced degradation in the fracture resistance <strong>of</strong>these steels. 3 In general, higher stacking–fault energy enhances <strong>and</strong> cold working inhibitsdislocation channeling. 1J Ic (kJ/m 2 )12001000800600400Types 304 & 316 SSIrradiation Temp: 350 - 450°CTest Temp: 350 - 427°CMichel & Gray, 1987Van Osch et al., 1997Dufresne et al., 1979Mills et al., 1985Mills, 1988Bernard & Verzeletti, 1985Picker et al., 1983Ould et al., 1988Figure 1.<strong>Fracture</strong> toughness J Ic as a function <strong>of</strong>neutron exposure for austenitic Types 304<strong>and</strong> 316 SS20000 5 10 15 20 25Neutron Exposure (dpa)The effect <strong>of</strong> neutron exposure on the fracture toughness J Ic <strong>of</strong> austenitic SSs irradiatedat 350–450°C is shown in Fig. 1. 10–18 The effects <strong>of</strong> irradiation may be divided into threeregimes: little or no loss <strong>of</strong> toughness below a threshold exposure <strong>of</strong> ª1 dpa, substantial1
decrease in toughness at exposures <strong>of</strong> 1–10 dpa, <strong>and</strong> no further reduction in toughness abovea saturation exposure <strong>of</strong> 10 dpa. The effect is largest in high–toughness steels. Thedegradation in fracture properties saturates at a J Ic value <strong>of</strong> ª30 kJ/m 2 (or equivalent criticalstress intensity factor KJc <strong>of</strong> 70 MPa m 0.5 ). Also, the failure mode changes from dimplefracture to channel fracture. However, most <strong>of</strong> the existing fracture toughness test data havebeen obtained at temperatures above 350°C; fracture toughness results that are relevant toLWRs are very limited. 2Radiation can exacerbate the corrosion fatigue <strong>and</strong> stress corrosion cracking (SCC)behavior <strong>of</strong> SSs by affecting the material microchemistry, e.g., radiation–induced segregation;material microstructure, e.g., radiation hardening; <strong>and</strong> water chemistry, e.g., radiolysis. 5Service failures in core components <strong>of</strong> several boiling water reactors (BWRs) 19,20 <strong>and</strong>pressurized water reactors (PWRs) 4,21 have been attributed to IASCC. While initiallyconsidered as a unique form <strong>of</strong> cracking that would not occur in the absence <strong>of</strong> radiation,IASCC is now generally considered as a radiation accelerated environmental cracking process.It has been termed as premature subcritical cracking <strong>of</strong> materials exposed to ionizingirradiation.The factors that influence SCC susceptibility <strong>of</strong> materials include neutron fluence, coldwork, corrosion potential, water purity, temperature, <strong>and</strong> loading. The effects <strong>of</strong> neutronfluence on IASCC <strong>of</strong> austenitic SSs has been investigated for BWR control blade sheaths 20 <strong>and</strong>laboratory tests on BWR–irradiated material; 5,22–24 the extent <strong>of</strong> intergranular SCC increaseswith fluence. Although a threshold fluence level <strong>of</strong> 5 x 10 20 n/cm 2 (E >1 MeV) has beenreported for austenitic SSs in BWR environment, the experimental data show an increase inintergranular cracking above a fluence <strong>of</strong> ª2 x 10 20 n/cm 2 (E >1 MeV) (ª0.3 dpa). The resultsalso show the beneficial effect <strong>of</strong> reducing the corrosion potential <strong>of</strong> the environment. 25,26However, low corrosion potential does not provide immunity to IASCC, e.g., intergranular SCChas been observed in cold worked, irradiated SS baffle bolts in PWRs. The threshold fluencefor IASCC is higher under low potential conditions such as HWC in BWRs or PWR primarywater chemistry.This report presents experimental data on fracture toughness, corrosion fatigue, <strong>and</strong>stress corrosion cracking (SCC) <strong>of</strong> austenitic SSs that were irradiated to fluence levels <strong>of</strong> ª0.3,0.9, <strong>and</strong> 2.0 x 10 21 n/cm 2 (E > 1 MeV) (ª0.45, 1.35, <strong>and</strong> 3.0 dpa) at ª288°C. The irradiationswere carried out in a He environment in the Halden heavy water boiling reactor. <strong>Fracture</strong>toughness tests were conducted in air <strong>and</strong> CGR tests in normal water chemistry (NWC) <strong>and</strong>low–DO BWR environments at 288°C. The results are compared with the existing dataobtained from irradiated reactor internal components removed from operating plants <strong>and</strong>materials irradiated in test reactors.2
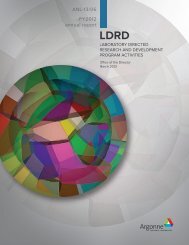
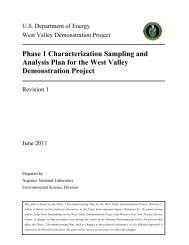
2. Experimental<strong>Fracture</strong> toughness J–R curve <strong>and</strong> crack growth rate (CGR) tests have been conducted at288°C on several austenitic SSs that were irradiated up to 2.0 x 10 21 n/cm 2 (E > 1 MeV)(ª3.0 dpa) at ª288°C in a helium environment in the Halden boiling heavy water reactor. Thetests were performed on 1/4–T compact tension (CT) specimens; the J–R curve tests wereperformed in air <strong>and</strong> CGR tests in BWR environments. A modified configuration <strong>of</strong> the CTspecimen geometry, Fig. 2, was used in the present study. <strong>Crack</strong> extensions were determinedby both DC potential <strong>and</strong> elastic unloading compliance techniques.C15.0012.006.00+.053.00 - .00 DIA.2 THRU HOLESC .02A3.256.50A .02A .022.00.794CENTERED7.00BA .02DETAIL 'M'14.00'C'3.303.301.451.45'M'.45 R2.002.00XXX-X1.53 DIA2 THRU HOLESSPECIMEN IDC .027.00B .02A .02#56 (1.19) DIA. DRILL 3.25 DP.#0-80 UNF-2B TAP 2.17 ±.06 DP. 2.45Figure 2.Configuration <strong>of</strong> compact–tension specimen used for this study (dimensions in mm)HydraulicActuatorLoad CellFurnacePneumaticCyl inde rFigure 3.Schematic representation <strong>of</strong> hot–cell J–R test facilityThe facility for conducting the tests is designed for in–cell testing, with the test train,furnace, <strong>and</strong> other required equipment mounted on top <strong>of</strong> a portable wheeled cart that can beeasily rolled into the cell. A schematic representation <strong>of</strong> the system is shown in Fig. 3. A small3
autoclave is installed inside the furnace for conducting tests in simulated BWR environments.Water is circulated through a port in the autoclave cover plate that serves both as inlet <strong>and</strong>outlet. The hydraulic actuator is mounted on top <strong>of</strong> the frame, with the test train componentssuspended beneath it. A drawing <strong>of</strong> the actuator, load cell, test train, autoclave, <strong>and</strong> furnaceare shown in Fig. 4. The 22–kN (5–kip) load cell is at the top <strong>of</strong> the pull rod. The furnace ismounted on a pneumatic cylinder <strong>and</strong> can be raised to enclose the autoclave with the load cage<strong>and</strong> the specimen during the test. An Instron Model 8500+ Dynamic Materials Testing Systemis used for performing the tests.The load cage that contains the test specimen consists <strong>of</strong> the cover plate <strong>of</strong> a 1–liter SSautoclave (from PARR Associates) <strong>and</strong> a 12.7–mm–thick bottom plate separated by fourcompression rods. The lower two–piece clevis assembly is fastened to the bottom plate <strong>of</strong> thecage with the two sections connected by an oxidized zircalloy pin, electrically insulated withmica washers. The same arrangement is used for the upper clevice assembly, connected to thepull rod. A 1/4–T CT specimen is mounted in the clevises with Inconel pins. Platinum wiresare used for the current <strong>and</strong> potential leads. The current leads are attached to SS split pinsthat are inserted into the holes at the top <strong>and</strong> bottom <strong>of</strong> the specimen. The potential leads areattached by screwing short SS pins into threaded holes in the specimen <strong>and</strong> attaching theplatinum wires with in–line SS crimps.ActuatorLoad CellCompressionColumns (4)LVDTPull RodSpecimenFurnaceLoad CageAutoclaveFigure 4.Schematic <strong>of</strong> the actuator, load cell, test train, autoclave, <strong>and</strong> furnaceThe recirculating water system consists <strong>of</strong> a storage tank, high pressure pump,regenerative heat exchanger, autoclave preheater, test autoclave, electrochemical potential(ECP) cell preheater, ECP cell, regenerative heat exchanger, Mity Mite TM back-pressureregulator, an ion–exchange cartridge, a 0.2 micron filter, a demineralizer resin bed, another4
0.2 micron filter, <strong>and</strong> return line to the tank. A schematic diagram <strong>of</strong> the recirculating watersystem is shown in Fig. 5. Water is circulated at low flow rates, e.g., ª10 mL/min.The BWR environments comprise high–purity–deionized water that contains eitherª300 ppb or
<strong>Crack</strong>ing <strong>of</strong> Metallic Materials Under Constant Load.” The composition <strong>of</strong> the various heats <strong>of</strong>irradiated austenitic SSs is presented in Table 1. The tensile yield <strong>and</strong> ultimate stress for thevarious SSs irradiated to the three fluence levels <strong>and</strong> in the nonirradiated condition 27,28 aregiven in Table 2.Table 1.Composition (wt.%) <strong>of</strong> austenitic stainless steels irradiated in the Halden reactorAlloyID aVendorHeat ID Analysis Ni Si P S Mn C N Cr Mo O bType 304 SSC3 PNL-C-6 Vendor 8.91 0.46 0.019 0.004 1.81 0.016 0.083 18.55ANL 9.10 0.45 0.020 0.003 1.86 0.024 0.074 18.93 144C19 DAN–74827 Vendor 8.08 0.45 0.031 0.003 0.99 0.060 0.070 18.21 –ANL 8.13 0.51 0.028 0.008 1.00 0.060 0.068 18.05 200L2 BPC–4–111 Vendor 10.50 0.82 0.080 0.034 1.58 0.074 0.102 17.02 66L20 BPC–4–101 Vendor 8.91 0.17 0.010 0.004 0.41 0.002 0.002 18.10 –ANL 8.88 0.10 0.020 0.005 0.47 0.009 0.036 18.06 940Type 316 SSC16 PNL–SS–14 Vendor 12.90 0.38 0.014 0.002 1.66 0.020 0.011 16.92 –ANL 12.32 0.42 0.026 0.003 1.65 0.029 0.011 16.91 2.18 157a First letters “C” <strong>and</strong> “L” denote commercial <strong>and</strong> laboratory heats, respectively.b In wppm.Table 2. Tensile properties a <strong>of</strong> irradiated austenitic stainless steels at 288°CFluence (E >1 MeV)Nonirradiated 0.3 x 10 21 n/cm 2 0.9 x 10 21 n/cm 2 2.0 x 10 21 n/cm 2Steel Type(Heat)Yield(MPa)Ultimate(MPa)Yield(MPa)Ultimate(MPa)Yield(MPa)Ultimate(MPa)Yield(MPa)Ultimate(MPa)304 SS (C3) (154) (433) 338 491 632 668 796 826304 SS (C19) 178 501 554 682 750 769 787 801304 SS (L2) 193 348 – – 839 849 – –304 SS (L20) – – 454 552 670 743– –632 697316 SS (C16) (189) (483) 370 527 562 618 766 803a Estimated values within parentheses.The experimental data for the fracture toughness J–R curves are compiled in theAppendix. Some <strong>of</strong> the results have been presented earlier. 29–32 Because tensile properties <strong>of</strong>the material were not available for some irradiation conditions, estimated values <strong>of</strong> flow stresswere used in the earlier presentations. In the present report, the fracture toughness resultshave been reevaluated using tensile properties determined from comparably irradiated tensilespecimens. 27,28Also, in earlier publications, 29–33 Heat C16 was erroneously identified as Type 304 SS.Because the flow stress for solution annealed Type 316 SS is typically higher than that forsolution annealed Type 304 SS, the experimental data for nonirradiated Heat C16 have beencorrected in the present report; the difference is essentially in the slope <strong>of</strong> the blunting line.2.1 J–R Curve CharacterizationBefore testing, the specimens were fatigue–precracked in air at room temperature. Theprecracked specimens were then tested at 288°C at a constant extension rate; tests wereinterrupted periodically to determine the crack length. Specimens were held at constantextension to measure crack length by both the DC potential drop <strong>and</strong> elastic unloadingcompliance techniques. For most steels, load relaxation occurs during the hold period or6
unloading, which causes a time-dependent nonlinearity in the unloading curve. Consequently,before unloading, the specimen was held for ª1 min to allow load relaxation. Elastic unloading<strong>and</strong> reloading was carried out in the load control mode.Specimen extension was monitored <strong>and</strong> controlled outside the high–temperature zone.The displacement <strong>of</strong> load points was determined by subtracting the extension <strong>of</strong> the load trainfrom the measured extension. The load train displacement was determined as a function <strong>of</strong>applied load using a very stiff specimen. The load–line displacements determined by thismethod were compared with actual displacements measured optically during J–R curve tests atroom temperature. The measured <strong>and</strong> estimated values were in very good agreement; forload–line displacements up to 2 mm, the error in the estimated values was
The following correlation, obtained from the best–fit <strong>of</strong> the experimental data fornormalized crack length <strong>and</strong> normalized DC potential, was used to determine crack lengths bythe DC potential method.a ÈÊi Uˆ˘= Í0. 28887Á-0.5˜˙W ÎÍËU0¯˚˙0.34775, (5)where W is the specimen width, <strong>and</strong> U <strong>and</strong> U 0 are the current <strong>and</strong> initial potentials.Equation 5 is comparable to the ASTM E 1737 correlation for a CT specimen with currentinputs at the W/4 position <strong>and</strong> DC potential lead connections at the W/3 position.The DC potential data were corrected for the effects <strong>of</strong> plasticity on the measuredpotential, i.e., large crack–tip plasticity can increase measured potentials due to resistivityincreases without crack extension. As per ASTM E 1737, the change in potential before crackinitiation was ignored, <strong>and</strong> the remainder <strong>of</strong> the potential change was used to establish the J–Rcurve. A plot <strong>of</strong> normalized potential vs. loadline displacement generally remains linear untilthe onset <strong>of</strong> crack extension. For all data within the linear portion <strong>of</strong> the curve, crackextension was calculated from the blunting–line relationship Da = J/(4s f ), where s f is the flowstress defined as the average <strong>of</strong> the 0.2% <strong>of</strong>fset yield stress <strong>and</strong> ultimate tensile stress. Theexclusion lines are parallel to the blunting line intersecting the abscissa at 0.15 <strong>and</strong> 1.50 mm.Although ASTM E 813 specifies a slope <strong>of</strong> two times the effective yield stress (or flowstress) for the <strong>of</strong>fset line, a slope <strong>of</strong> four times the flow stress was used to define the <strong>of</strong>fset <strong>and</strong>exclusion lines. For high–strain–hardening materials, e.g., nonirradiated austenitic SSs, aslope that is four times the flow stress (4s f ) represents the blunting line better than the slope <strong>of</strong>2s f defined in ASTM E 1737. 3 In irradiated materials, the increase in yield stress is primarilydue to a high density <strong>of</strong> barriers to dislocation motion. During deformation as dislocationssweep through the irradiated matrix, they annihilate the very fine scale <strong>of</strong> barriers, thuscreating a “channel” for easy dislocation motion. This may result in marked work s<strong>of</strong>tening.To account for possible strain s<strong>of</strong>tening that may occur in irradiated materials, an effective flowstress defined as the average <strong>of</strong> the nonirradiated <strong>and</strong> irradiated flow stress was used in J–Rcurve data analysis. Because the effective flow stress discounts the irradiation–inducedincrease in flow stress by a factor <strong>of</strong> 2, the slope <strong>of</strong> the blunting line was defined as 4s f even forthe irradiated materials.The final crack size was marked by fatigue cycling at room temperature. The specimenswere then fractured <strong>and</strong> the initial (i.e., fatigue precrack) <strong>and</strong> final (test) crack lengths <strong>of</strong> bothhalves <strong>of</strong> the fractured specimen were measured optically. The crack lengths were determinedby the 9/8 averaging technique, i.e., the two near–surface measurements were averaged <strong>and</strong>the resultant value was averaged with the remaining seven measurements.The elastic unloading compliance measurements were adjusted only with the measuredinitial crack length, whereas the crack length measurements obtained by the DC potential–droptechnique were adjusted with both the initial <strong>and</strong> final crack lengths. The two-point pinningmethod was used to correct the measured potentials from the test data. The correctednormalized potentials NP are expressed in terms <strong>of</strong> the measured normalized potentials NP(U/U 0 in Eq. 5) by the relationship8
NP NP - P 1= . (6)P - P2 1The variables P 1 <strong>and</strong> P 2 are solutions <strong>of</strong> the expressions<strong>and</strong>NPi- PiNPi= , (7)P - P2 1NPfNPf- Pi= , (8)P - P2 1where NP i <strong>and</strong> NP f are normalized potentials that correspond to initial <strong>and</strong> final crack lengthsdetermined from Eq. 5, <strong>and</strong> NP i <strong>and</strong> NP f are the measured values. The fracture toughness J Icvalues were determined from ASTM E–813 as the intersection <strong>of</strong> the 0.2–mm <strong>of</strong>fset line with thepower law fit (<strong>of</strong> the form J = Da n ) <strong>of</strong> the test data between the 0.15– <strong>and</strong> 1.50–mm exclusionlines.Several fracture toughness J–R curve tests were conducted at room temperature <strong>and</strong>288°C on thermally aged CF–8M cast SS <strong>and</strong> on a 50% cold–worked (CW) Type 316LN SS todevelop correlations for estimating crack lengths <strong>and</strong> to validate the test procedure.Experimental data for the tests at 288°C are given in the Appendix, Tables A–1 to A–7.For materials with relatively low fracture toughness, e.g., J Ic
500400CF–8M (Specimen 75–03T)Aged 10,000 h at 400°C288°C500400CF–8M (Specimen 75–04T)Aged 10,000 h at 400°C288°CDeformation J (kJ/m 2 )300200Deformation J (kJ/m 2 )300200100DC PotentialElastic Unloading100DC PotentialElastic UnloadingDeformation J (kJ/m 2 )00 0.5 1 1.5 2 2.5 3 3.5<strong>Crack</strong> Extension (mm)500400300200100(a)CF–8M (Specimen 75–10T)Aged 10,000 h at 400°C288°CDC PotentialElastic Unloading00 0.5 1 1.5 2 2.5 3 3.5<strong>Crack</strong> Extension (mm)(b)Figure 8.<strong>Fracture</strong> toughness J–R curves obtained from DCpotential <strong>and</strong> elastic unloading compliancemethods for thermally aged Heat 75 <strong>of</strong> castCF–8M SS; specimen (a) 75–03T, (b) 75–04T,<strong>and</strong> (c) 75–10T00 0.5 1 1.5 2 2.5 3 3.5<strong>Crack</strong> Extension (mm)500400(c)Type 316NG SS (Specimen 184–38)50% Cold Worked288°C500400Type 316NG SS (Specimen 184–40)50% Cold Worked288°CDeformation J (kJ/m 2 )300200DC PotentialElastic UnloadingDeformation J (kJ/m 2 )300200DC PotentialElastic Unloading10010000 0.5 1 1.5 2 2.5 3 3.5<strong>Crack</strong> Extension (mm)(a)00 0.5 1 1.5 2 2.5 3 3.5<strong>Crack</strong> Extension (mm)Figure 9. <strong>Fracture</strong> toughness J–R curves obtained from DC potential <strong>and</strong> elastic unloading compliancemethods for 50% cold–worked Type 316NG; specimen (a) 184–38 <strong>and</strong> (b) 184–40(b)The J–R curves obtained from 1/4–T CT specimens <strong>of</strong> thermally aged Heat 75 <strong>of</strong> CF–8Mcast SS are compared with those obtained from 1–T CT specimens <strong>of</strong> the same heat in Fig. 10.The curves for the 1/4–T CT specimens show good agreement with the curve for the 1–T CTspecimen with the same orientation, e.g., transverse orientation.10
Deformation J (kJ/m 2 )500400300200100288°C, CF–8M (Heat 75)Aged 10,000 h at 400°CSpecimen #751-02T75-03T75-04T75-10TOpen Symbols: 1/4–T CTClosed Symbols: 1–T CT00 0.5 1 1.5 2 2.5 3 3.5<strong>Crack</strong> Extension (mm)Figure 10.<strong>Fracture</strong> toughness J–R curves for 1/4–T <strong>and</strong> 1–TCT specimens <strong>of</strong> aged Heat 75 <strong>of</strong> CF–8M caststainless steel at 288°C. The last digit in thespecimen number represents orientation;T = transverse.2.2 <strong>Crack</strong> <strong>Growth</strong> Rate Tests2.2.1 ProcedureAll specimens were fatigue precracked in the test environment at temperature <strong>and</strong> loadratio R = 0.2, ª1 Hz frequency, <strong>and</strong> maximum stress intensity factor K max ª15 MPa m 1/2 . Afterª0.5–mm extension, R was increased incrementally to 0.7, <strong>and</strong> the loading waveform changedto a slow/fast sawtooth with rise times <strong>of</strong> 30–1000 s. Constant–load tests were conducted withthe trapezoidal waveform, R = 0.7, 1– or 2–h hold period at peak, <strong>and</strong> either 4– or 24–sunload/reload period. During individual test periods, K max was maintained approximatelyconstant by periodic load shedding (less than 2% decrease in load at any given time).The stress intensity factor range DK was calculated as follows:DKDPBB W=( )+NÊ a ˆÁ2˜Ë W ¯ Ê a ˆf Á ˜(9)/ /Ê a ˆ ËW¯Á1- ˜Ë W ¯12 32DP = Pmax -Pmin for R > 0 (10)2 3 4Ê a ˆÊ a ˆÊ a ˆÊ a ˆÊ a ˆf Á ˜ = 0886 . + 464 . Á ˜ -1332 . Á ˜ + 1472 . Á ˜ - 56 . Á ˜ . (11)ËW¯ËW¯ËW¯ËW¯ËW¯where P max <strong>and</strong> P min are maximum <strong>and</strong> minimum applied load, a is crack length, W is thespecimen width, <strong>and</strong> effective thickness B eff = (B B N ) 0.5 . Also, because a modified configuration<strong>of</strong> disc–shaped CT specimen was used in the present study, crack length was calculated fromEq. 5 that was developed from the best fit <strong>of</strong> the experimental data for normalized crack length<strong>and</strong> normalized DC potential.Under cyclic loading, the CGR (m/s) can be expressed as the superposition <strong>of</strong> the rate inair (i.e., mechanical fatigue) <strong>and</strong> the rates due to corrosion fatigue <strong>and</strong> SCC, given asa˙ = a˙ + a˙ + a˙. (12)env air cf scc11
During crack growth tests in high–temperature water, environmental enhancement <strong>of</strong> CGRsdoes not occur from the start <strong>of</strong> the test. Under more rapid cyclic loading, the crack growth isdominated by mechanical fatigue. The CGRs during precracking <strong>and</strong> initial periods <strong>of</strong> cyclicloading were primarily due to mechanical fatigue. For the present tests on irradiated SSs,environmental enhancement typically was observed under loading conditions that would leadto CGRs between 10 -10 <strong>and</strong> 10 –9 m/s in air. For K max values <strong>of</strong> 15–18 MPa m 1/2 , these valuescorrespond to a load ratio R ≥ 0.5 <strong>and</strong> rise time ≥ 30 s.All tests were started in high–purity water that contained 250–300 ppb DO (i.e., NWCBWR environment). The ECPs <strong>of</strong> a Pt electrode <strong>and</strong> a SS sample located at the exit <strong>of</strong> theautoclave were monitored continuously during the test while the water DO level <strong>and</strong>conductivity were determined periodically. After data were obtained for high–DO water, the DOlevel in the feedwater was decreased to
10 -810 -9CF8M Cast SS289°COpen Symbols:ª0.3 ppm DOClosed Symbols:ª4.0 ppm DO10 -810 -950% Cold WorkedType 316LN SS289°CCGR env(m/s)10 -1010 -1110 -1210 -1310 -7 10 -13 10 -12 10 -11 10 -10 10 -9 10 -8 10 -7Heat 4331, 1/4-T CT700 h at 400°CHeat 75, 1-T CT10,000 h at 400°C or30,000 h at 350°CHeat 75 1/4-T CT10,000 h at 400°CShack/Kassner Model for8 ppm DO0.3 ppm DOCGR env(m/s)10 -1010 -1110 -1210 -1310 -7 10 -13 10 -12 10 -11 10 -10 10 -9 10 -8 10 -71/4-T CT, ª0.55 ppm DO1-T CT, ª7.7 ppm DO1/4 T-CT ,
<strong>and</strong> function C SS is given by a third–order polynomial <strong>of</strong> temperature T (°C), expressed asC SS = 1.9142 x 10 –12 + 6.7911 x 10 –15 T – 1.6638 x 10 –17 T 2 + 3.9616 x 10 –20 T 3 . (17)The two curves in the figure represent the best–fit curves for sensitized austenitic SSs inhigh–purity water at 289°C. 35 The CGRs in water with ª0.3 ppm DO are given by theexpressionȧ env = ȧ air + 4.5 x 10 -5 ( ȧ air ) 0.5 (18)<strong>and</strong> in water with ª8 ppm DO by the expressionȧ env = ȧ air + 1.5 x 10 -4 ( ȧ air ) 0.5 . (19)The experimental CGRs for the 1/4–T CT specimen <strong>of</strong> Heat 4331 are in good agreementwith the data obtained on the 1–T CT specimen <strong>of</strong> Heat 75. The rates for the 1/4–T CTspecimen <strong>of</strong> Heat 75 <strong>and</strong> 50% CW Type 316LN SS are somewhat higher. However, the K/sizecriteria were generally exceeded for these tests, i.e., the values <strong>of</strong> K max were higher than thoseallowed by Eqs. 13 or 14.For the 50% CW Type 316LN SS, the CGR under constant load conditions in high–DOwater at 289°C is plotted in Fig. 12; the maximum stress intensity for the test was within theK/size–validity criteria. Data obtained earlier on 1–T CT specimens <strong>of</strong> several heats <strong>of</strong>Types 304 <strong>and</strong> 316 SS are also included in the figure. In ª250–ppb–DO water, the CGRs for a1/4–T CT specimen <strong>of</strong> 50% CW Type 316LN SS are higher than those for a 1–T CT specimen <strong>of</strong>sensitized Type 304 SS. <strong>Rates</strong> for the 1/4–T specimen are comparable to those <strong>of</strong> sensitizedType 304 SS in very high–DO water (>6000 ppb DO).<strong>Austenitic</strong> SSsHigh DO Environment289°C10 -9Open Symbols: ª250 ppb DOClosed Symbols: ≥6000 ppb DOExperimental CGR (m/s)10 -1010 -1110 -8 0 10 20 30 40 501-T CT SpecimenNUREG-0313Figure 12.Stress corrosion cracking data for austeniticstainless steels in high–DO water at 289°C.10 -12304 SS Heat 30956 (Sensitized)304 SS Heat 10285 (Sensitized)316NG Heat P915761/4-T CT Specimen50% CW 316LN Heat 18474Stress Intensity K (MPa·m 1/2 )14
3. Results3.1 <strong>Fracture</strong> <strong>Toughness</strong>3.1.1 Nonirradiated Type 304 Stainless SteelThe fracture toughness J–R curves for nonirradiated specimens <strong>of</strong> Heats L2, L20, C16,<strong>and</strong> C19, obtained in air by the DC potential <strong>and</strong> elastic unloading compliance methods, areshown in Figs. 13–16; experimental data for the tests are given in the Appendix. Duplicatetests were conducted for Heats L2 <strong>and</strong> C16. The results indicate that the fracture toughness <strong>of</strong>the laboratory Heats L2 <strong>and</strong> L20 is very low. The J–R curves are significantly lower than thosetypically observed for Type 304 SSs, Fig. 17. 15,38–41 For wrought austenitic SSs, 3 the J Icvalues at temperatures up to 550°C are typically >400 kJ/m 2 ; experimental J Ic for Heats L2<strong>and</strong> L20 is in the range <strong>of</strong> 150–230 <strong>and</strong> 80–120 kJ/m 2 , respectively. The commercial HeatsC16 <strong>and</strong> C19 show the very high fracture toughnesses expected for Type 304 SSs. For bothsteels, the J–R curve could not be obtained; the experimental curve is composed only <strong>of</strong> theblunting line. <strong>Fracture</strong> toughness J Ic is >830 kJ/m 2 for C19, <strong>and</strong> it could not be determinedfor Heat C16.800700288°CDC PotentialSpecimen L2-CNonirradiated800700288°CUnloading ComplianceSpecimen L2-CNonirradiatedDeformation J (kJ/m 2 )600500400300200J = 243Da 0.27100J IC = 186 kJ/m 200 0.5 1 1.5 2 2.5 3 3.5<strong>Crack</strong> Extension (mm)800700288°CDC PotentialSpecimen L2-ENonirradiatedDeformation J (kJ/m 2 )600500400300200100J IC= 237 kJ/m 2J = 283 Da 0.20Closed Symbol: Measured <strong>Crack</strong>00 0.5 1 1.5 2 2.5 3 3.5<strong>Crack</strong> Extension (mm)800700288°CUnloading ComplianceSpecimen L2-ENonirradiatedDeformation J (kJ/m 2 )600500400300200J = 268Da 0.49100J IC= 159 kJ/m 200 0.5 1 1.5 2 2.5 3 3.5<strong>Crack</strong> Extension (mm)Deformation J (kJ/m 2 )600500400300200100J = 275Da 0.54J IC= 154 kJ/m 2Closed Symbol:Measured <strong>Crack</strong>00 0.5 1 1.5 2 2.5 3 3.5<strong>Crack</strong> Extension (mm)Figure 13. <strong>Fracture</strong> toughness J–R curve obtained by DC potential <strong>and</strong> unloading compliance methodsfor nonirradiated specimens L2–C <strong>and</strong> L2–E <strong>of</strong> Heat L2 <strong>of</strong> Type 304 SS at 288°C.15
800700288°CDC PotentialSpecimen L20-DNonirradiated800700288°CUnloading ComplianceSpecimen L20-DNonirradiatedDeformation J (kJ/m 2 )600500400300200100J IC= 78 kJ/m 2J = 174Da 0.6000 0.5 1 1.5 2 2.5 3 3.5<strong>Crack</strong> Extension (mm)Deformation J (kJ/m 2 )600500400300200100J IC= 119 kJ/m 2J = 236Da 0.56Closed Symbol:Measured <strong>Crack</strong>00 0.5 1 1.5 2 2.5 3 3.5<strong>Crack</strong> Extension (mm)Figure 14. <strong>Fracture</strong> toughness J–R curve obtained by DC potential <strong>and</strong> unloading compliance methodsfor nonirradiated specimen L20–D <strong>of</strong> Heat L20 <strong>of</strong> Type 304 SS at 288°C.Deformation J (kJ/m 2 )1000800600400288°CDC PotentialSpecimen C16-CNonirradiatedDeformation J (kJ/m 2 )1000800600400288°CUnloading ComplianceSpecimen C16-CNonirradiated20020000 0.5 1 1.5 2 2.5 3 3.5<strong>Crack</strong> Extension (mm)00 0.5 1 1.5 2 2.5 3 3.5<strong>Crack</strong> Extension (mm)Deformation J (kJ/m 2 )1000800600400288°CDC PotentialSpecimen C16-DNonirradiatedDeformation J (kJ/m 2 )1000800600400288°CUnloading ComplianceSpecimen C16-DNonirradiated20020000 0.5 1 1.5 2 2.5 3 3.5<strong>Crack</strong> Extension (mm)00 0.5 1 1.5 2 2.5 3 3.5<strong>Crack</strong> Extension (mm)Figure 15. <strong>Fracture</strong> toughness J–R curve obtained by DC potential <strong>and</strong> unloading compliance methodsfor nonirradiated specimens C16–C <strong>and</strong> C16–D <strong>of</strong> Heat C16 <strong>of</strong> Type 316 SS at 288°C.16
Deformation J (kJ/m 2 )1000800600400288°CDC PotentialSpecimen C19-DNonirradiatedJ IC= 835 kJ/m 2Deformation J (kJ/m 2 )1000800600400288°CUnloading ComplianceSpecimen C19-DNonirradiated20020000 0.5 1 1.5 2 2.5 3 3.5<strong>Crack</strong> Extension (mm)00 0.5 1 1.5 2 2.5 3 3.5<strong>Crack</strong> Extension (mm)Figure 16. <strong>Fracture</strong> toughness J–R curve obtained by DC potential <strong>and</strong> unloading compliance methodsfor nonirradiated specimen C19–D <strong>of</strong> Heat C19 <strong>of</strong> Type 304 SS at 288°C.2000Type 304 SS288°CDeformation J (kJ/m 2 )15001000500PipePlate00 1 2 3 4 5<strong>Crack</strong> Extension (mm)Figure 17.<strong>Fracture</strong> toughness J–R curves fornonirradiated Type 304 stainless steels at288°C.The differences between the fracture toughness <strong>of</strong> laboratory <strong>and</strong> commercial heats arereflected in their fracture behavior. Photomicrographs <strong>of</strong> the fracture surface <strong>of</strong> brokennonirradiated specimens <strong>of</strong> laboratory Heats L2 <strong>and</strong> L20 <strong>and</strong> commercial Heat C19 are shownin Figs. 18 <strong>and</strong> 19, respectively. Heat L2 contains relatively high S <strong>and</strong> P contents <strong>and</strong> manyclusters <strong>of</strong> MnS inclusions. Failure occurs primarily via grain–boundary separation, which isFigure 18.(a)Photomicrographs <strong>of</strong> fracture surfaces <strong>of</strong> nonirradiated specimens <strong>of</strong> Heats (a) L2 <strong>and</strong>(b) L20 tested at 288°C.(b)17
accompanied by some plastic deformation <strong>and</strong> decohesion along the MnS clusters (Fig. 20).Heat L20 exhibits a dimple fracture; failure occurs by nucleation <strong>and</strong> growth <strong>of</strong> microvoids <strong>and</strong>rupture <strong>of</strong> remaining ligaments. Heat L20 contains relatively high oxygen <strong>and</strong> many oxideparticle inclusions. In Fig. 18b, nearly every dimple appears to have been initiated bydecohesion <strong>of</strong> an oxide inclusion. An identical fracture behavior was observed for Heat L20irradiated to 0.9 x 10 21 n◊cm –2 (1.35 dpa). In contrast, commercial heats exhibit ductile failurewith some dimple fracture, as shown for Heat C19 in Fig. 19.Figure 19.Photomicrograph <strong>of</strong> fracture surface <strong>of</strong>nonirradiated specimen <strong>of</strong> Heat C19 tested at288°C.Figure 20.Photomicrograph <strong>of</strong> MnS inclusions on thefracture surface <strong>of</strong> nonirradiated specimen <strong>of</strong>Heat L2 tested at 288°C.3.1.2 <strong>Irradiated</strong> Type 304 Stainless Steels<strong>Fracture</strong> toughness J–R curve tests were conducted at 288°C on Heats C19, L20, <strong>and</strong> L2<strong>of</strong> Type 304 SS <strong>and</strong> Heat C16 <strong>of</strong> Type 316 SS irradiated to 2.0 x 10 21 n◊cm –2 (E > 1 MeV)(3.0 dpa). The J–R curves for the various steels are shown in Figs. 21–24; experimental datafor the tests are given in the Appendix. For specimen C19–C, the J–R curve could not bedetermined from the DC potential method because <strong>of</strong> broken potential leads. Note that therather flat J–R curve determined for specimen C19–A most likely is due to the small specimensize used in these tests; the maximum allowed J values were exceeded for the test.Neutron irradiation at 288°C decreases the fracture toughness <strong>of</strong> all steels. In general,fracture toughness <strong>of</strong> the commercial Heats C16 <strong>and</strong> C19 is superior to that <strong>of</strong> the laboratoryHeats L20 <strong>and</strong> L2. These differences arise primarily from differences in toughness <strong>of</strong> thenonirradiated steels, i.e., the fracture toughness <strong>of</strong> the laboratory heats is significantly lowerthan that <strong>of</strong> the commercial heats. The fracture toughness J–R curves for irradiated Types 304<strong>and</strong> 316 SS are comparable.18
Deformation J (kJ/m 2 )800700600500400300200288°CDC PotentialJ IC= 507 kJ/m 2J = 579Da 0.17Specimen C19-A0.3 x 10 21 n cm –2 0Deformation J (kJ/m 2 )800700600500400300200J = 661Da 0.15288°CUnloading ComplianceSpecimen C19-A0.3 x 10 21 n cm –2J IC= 599 kJ/m 2 Closed Symbol: Measured <strong>Crack</strong>10080070000 0.5 1 1.5 2 2.5 3 3.5<strong>Crack</strong> Extension (mm)288°CDC PotentialSpecimen C19-B(a)1008007000 0.5 1 1.5 2 2.5 3 3.5<strong>Crack</strong> Extension (mm)288°CUnloading ComplianceSpecimen C19-B0.9 x 10 21 n cm -2Deformation J (kJ/m 2 )600500400300200J IC= 313 kJ/m 2J = 442Da 0.320.9 x 10 21 n cm -2 0Deformation J (kJ/m 2 )600500400300200J = 513Da 0.33J IC= 368 kJ/m 2 Closed Symbol: Measured <strong>Crack</strong>10010000 0.5 1 1.5 2 2.5 3 3.5<strong>Crack</strong> Extension (mm)(b)8007000 0.5 1 1.5 2 2.5 3 3.5<strong>Crack</strong> Extension (mm)288°CUnloading ComplianceSpecimen C19-C2.0 x 10 21 n cm -2Specimen C19–C – DC Potential methodData not obtainedDeformation J (kJ/m 2 )600500400300200J = 268Da 0.28100J IC = 188 kJ/m 2Closed Symbol: Measured <strong>Crack</strong>00 0.5 1 1.5 2 2.5 3 3.5<strong>Crack</strong> Extension (mm)(c)Figure 21. <strong>Fracture</strong> toughness J–R curve obtained by DC potential <strong>and</strong> unloading compliance methodsat 288°C for Heat C19 <strong>of</strong> Type 304 SS irradiated to a fluence level <strong>of</strong> (a) 0.3, (b) 0.9, <strong>and</strong>(c) 2.0 x 10 21 n/cm 2 .19
800700288°CDC PotentialSpecimen C16-A0.9 x 10 21 n cm -2800700288°CUnloading ComplianceSpecimen C16-A0.9 x 10 21 n cm -2Deformation J (kJ/m 2 )600500400300200100J IC= 315 kJ/m 2J = 491Da 0.45Deformation J (kJ/m 2 )600500400300200100J = 607Da 0.52J IC= 378 kJ/m 2 Closed Symbol: Measured <strong>Crack</strong>00 0.5 1 1.5 2 2.5 3 3.5<strong>Crack</strong> Extension (mm)00 0.5 1 1.5 2 2.5 3 3.5<strong>Crack</strong> Extension (mm)Figure 22. <strong>Fracture</strong> toughness J–R curve obtained by DC potential <strong>and</strong> unloading compliance methodsat 288°C for Heat C16 <strong>of</strong> Type 316 SS irradiated to a fluence level <strong>of</strong> 0.9 x 10 21 n/cm 2 .200288°CUnloading ComplianceSpecimen L20-A0.3 x 10 21 n cm -2200288°CDC PotentialSpecimen L20-A0.3 x 10 21 n cm -2Deformation J (kJ/m 2 )Deformation J (kJ/m 2 )15010050200150100J IC= 62 kJ/m 2J = 100Da 0.34Closed Symbol: Measured <strong>Crack</strong>00 0.5 1 1.5 2 2.5 3 3.5<strong>Crack</strong> Extension (mm)50288°CDC PotentialJ = 55 Da 0.22Specimen L20-B0.9 x 10 21 n cm -2(a)Deformation J (kJ/m 2 )Deformation J (kJ/m 2 )15010050200150100J IC= 62 kJ/m 2J = 104Da 0.3600 0.5 1 1.5 2 2.5 3 3.5<strong>Crack</strong> Extension (mm)50288°CUnloading ComplianceJ = 45Da 0.12Specimen L20-B0.9 x 10 21 n cm -2Closed Symbol:Measured <strong>Crack</strong>J IC= 39 kJ/m 200 0.5 1 1.5 2 2.5 3 3.5<strong>Crack</strong> Extension (mm)J IC= 37 kJ/m 200 0.5 1 1.5 2 2.5 3 3.5<strong>Crack</strong> Extension (mm)(b)Figure 23. <strong>Fracture</strong> toughness J–R curve obtained by DC potential <strong>and</strong> unloading compliance methodsat 288°C for Heat L20 <strong>of</strong> Type 304 SS irradiated to a fluence level <strong>of</strong> (a) 0.3 <strong>and</strong>(b) 0.9 x 10 21 n/cm 2 .20
Deformation J (kJ/m 2 )20015010050288°CDC PotentialJ = 52 Da 0.22Specimen L2-A0.9 x 10 21 n cm -2Deformation J (kJ/m 2 )20015010050288°CUnloading ComplianceJ = 51Da 0.24Specimen L2-A0.9 x 10 21 n cm -2Closed Symbol:Measured <strong>Crack</strong>J IC= 38 kJ/m 200 0.5 1 1.5 2 2.5 3 3.5<strong>Crack</strong> Extension (mm)J IC= 35 kJ/m 200 0.5 1 1.5 2 2.5 3 3.5<strong>Crack</strong> Extension (mm)Figure 24. <strong>Fracture</strong> toughness J–R curve obtained by DC potential <strong>and</strong> unloading compliance methodsat 288°C for Heat L2 <strong>of</strong> Type 304 SS irradiated to a fluence level <strong>of</strong> 0.9 x 10 21 n/cm 2 .The experimental J Ic values for the two commercial heats <strong>of</strong> austenitic SSs are plotted asa function <strong>of</strong> neutron exposure in Fig. 25. Results from tests on Type 304 SS reactor internalmaterials from operating BWRs 2 are also included in the figure. All CT specimen data fromcommercial heats fall within the scatter b<strong>and</strong> for the data obtained at temperatures higherthan 288°C.600500Types 304 SSIrradiation Temp: 288°CTest Temp: 288°C835 kJ/cm 2 Figure 25.J Ic (kJ/m 2 )400300200100ANL HeatsC19C16JAPEIC DataBend BarCT SpecimenShort RodGE DataCT Specimen<strong>Fracture</strong> toughness J Ic <strong>of</strong> austenitic stainlesssteels as a function <strong>of</strong> neutron exposure at288°C. Dashed lines represent upper <strong>and</strong>lower bounds for change in J Ic for austeniticSSs irradiated at 350–450°C.JAPEIC = Japan Power Engineering <strong>and</strong>Inspection Corporation, GE = General ElectricNuclear Energy00 5 10 15 20 25Neutron Exposure (dpa)3.2 <strong>Crack</strong> <strong>Growth</strong> Tests on <strong>Irradiated</strong> Stainless Steels in BWR Environments<strong>Crack</strong> growth tests have been completed at 289°C on 1/4–T CT specimens <strong>of</strong> Type 304 SS(Heat C3) irradiated to 0.3, 0.9, <strong>and</strong> 2.0 x 10 21 n/cm 2 <strong>and</strong> Type 316 SS (Heat C16) irradiatedto 2.0 x 10 21 n/cm 2 . The significant results for the various tests are summarized below.21
3.2.1 Specimen C3-B <strong>Irradiated</strong> to 0.9 x 10 21 n/cm 2The environmental <strong>and</strong> loading conditions, experimental CGRs, allowed K max from K/sizecriterion in Eq. 13, <strong>and</strong> the deviation <strong>of</strong> applied K max from the allowed value are given inTable 3. Allowed K max was determined using effective yield stress in Eq. 13. Precracking wasinitiated at R = 0.2 <strong>and</strong> K max = 16 MPa m 1/2 . During most test periods, K max was maintainedapproximately constant by periodic load shedding.Table 3. <strong>Crack</strong> growth results for Specimen C3–B <strong>of</strong> Type 304 SS a in high–purity water at 289°CO Test ECPRise Down Hold<strong>Growth</strong> K max from DeviationTest Time, mV (SHE) b 2Conc., b Load Time, Time, Time, K max , DK, Rate, Eq. 13 in K max ,Period h Pt Steel ppb Ratio s s s MPa·m 1/2 MPa·m 1/2 m/s MPa m 1/2 %1 28 230 154 300 0.20 0.5 0.5 0 19.14 15.31 6.83E-08 18.4 42 172 239 189 300 0.51 60 2 0 18.96 9.29 1.75E-10 18.3 33 287 233 187 300 0.70 300 2 0 19.79 5.94 6.38E-10 18.0 104 335 235 191 300 0.70 2 2 7200 20.10 0 1.06E-09 17.7 145 376 238 195 300 0.70 2 2 7200 22.07 0 1.04E-09 17.4 276 624 -475 –595 ª10 0.70 2 2 7200 22.27 0 4.02E-11 17.2 307 696 -482 –607 ª10 0.70 300 2 0 22.10 6.63 8.56E-11 17.1 298 935 -495 –614 ª10 0.70 2 2 3600 22.66 0 6.42E-12 17.1 329 1031 -499 –609 ª10 0.70 300 2 0 22.53 6.76 3.37E-11 17.1 3210a 1127 -495 –613 ª10 0.70 1000 2 0 22.19 6.66 negligible 17.1 3010b 1271 -507 –620 ª10 0.70 1000 2 0 23.04 6.91 1.20E-11 17.1 3511 1295 -507 –624 ª10 0.70 30 2 0 22.87 6.86 5.17E-11 17.1 3412 1343 -498 –617 ª10 0.70 300 2 0 23.10 6.93 1.55E-11 17.1 3614 1608 248 151 250 0.70 1000 2 0 24.17 7.25 5.93E-10 16.7 4515 1655 244 155 250 0.70 2 2 3600 24.42 0 8.70E-10 16.4 49a Heat C3, irradiated to 0.9 x 10 21 n cm -2 .b Represents values in the effluent.Conductivity was 0.07 <strong>and</strong> 0.3–0.45 mS/cm in feedwater <strong>and</strong> effluent, respectively. Feedwater pH at roomtemperature was 6.5.The test was initiated in high–purity water with ª300 ppb DO. After ª375 h, the DO levelin the feedwater was decreased to ª10 ppb by sparging it with pure nitrogen. After 1380 h, theDO level was increased from ª10 to ª300 ppb by sparging the feedwater with nitrogen plus 1%oxygen gas mixture. Because <strong>of</strong> the very low flow rates for the recirculating water system ittook several days for the environmental conditions to stabilize. Changes in crack length <strong>and</strong>ECP <strong>of</strong> Pt <strong>and</strong> SS electrodes during these transient periods are shown in Fig. 26. During thetransition periods, changes in the steel ECP were slower than those in the Pt ECP. Forexample, in Fig. 26a, although the Pt ECP decreased below –400 mV (SHE) within 40 h, it tookmore than 150 h for the steel ECP to decrease below –400 mV. Also, because <strong>of</strong> an unexpectedpower bump the test tripped after ª1390 h (during the second transition period); it wasrestarted at 1470 h. The ECPs <strong>of</strong> both electrodes were below –200 mV before the interruption<strong>and</strong> above 100 mV after the test was restarted.A photomicrograph <strong>of</strong> the fracture surface <strong>of</strong> both halves <strong>of</strong> the specimen is shown inFig. 27. The final crack length, determined from the photograph, showed very good agreementwith the value estimated from the DC potential measurements. Changes in crack length <strong>and</strong>K max with time during various test periods are shown in Fig. 28a–e. In general, the DCpotential measurements show very little scatter, particularly for measured growth rates>5 x 10 –11 m/s. Some fluctuations in DC potential measurements were observed when eitherthe autoclave temperature varied ±3°C (e.g., 170–260 h) or the DO level in the water was beingchanged (e.g., 450–530 h <strong>and</strong> 1370–1510 h).22
<strong>Crack</strong> Length (mm)7.607.557.507.457.407.35289°CCGR= 4.02 x 10 -11 m/sHigh–Purity WaterDO
7.4Type 304 SS (Heat C3)289°CTest CGRI–07 (Spec. C3-B) High–Purity WaterFluence 0.9 x 10 21 n/cm 2Constant LoadUnload to R = 0.7 every 2 h35<strong>Crack</strong> Length (mm)7.27.0CGR = 1.75 x 10 –10 m/sK = 19.0 MPa m 0.5maxR = 0.5, Rise Time 60 sCGR = 6.38 x 10 –10 m/sK = 19.8 MPa m 0.5maxR = 0.7, Rise Time 300 s1.06 x 10 –9 m/s20.1 MPa m 0.5R = 1.01.04 x 10 –9 m/s22.1 MPa m 0.5R = 1.03025K max(MPa m 0.5 )6.820<strong>Crack</strong> LengthK maxDO ª250 ppbDO
<strong>Crack</strong> Length (mm)7.607.587.567.547.527.508.007.90Type 304 SS (Heat C3)Test CGRI–07 (Spec. C3-B)Fluence 0.9 x 10 21 n/cm 23.37 x 10 –11 m/s22.6 MPa m 0.50.7, 300 sno growth22.2 MPa m 0.50.7, 1000 s289°CHigh–Purity Water DO ª10 ppbSteel ECP –610 mV (SHE)5.17 x 10 –11 m/s22.9 MPa m 0.50.7, 30 sCGR = 1.20 x 10 –11 m/sK = 23.1 MPa m 0.5maxR = 0.7, Rise Time = 1000 s<strong>Crack</strong> Length151000 1100 1200 1300 1400Type 304 SS (Heat C3)Test CGRI–07 (Spec. C3-B)Time (h)(d)8.70 x 10 –10 m/s24.4 MPa m 0.51.55 x 10 –11 m/s23.1 MPa m 0.50.7, 300 sK max3530252035K max (MPa m 0.5 )<strong>Crack</strong> Length (mm)7.807.707.60K maxFluence 0.9 x 10 21 n/cm 2 CGR = 5.93 x 10 –11 m/sK = 24.2 MPa m 0.5maxR = 0.7Rise Time = 1000 s289°CConstant loadUnload to R = 0.7 every 1 h302520K max (MPa m 0.5 )7.50<strong>Crack</strong> Length1500 1550 1600 1650Time (h)High–Purity Water DO ª250 ppbSteel ECP 155 mV (SHE)15(e)Figure 28. (Cont’d.)For this specimen, environmental enhancement occurred after ª170 h (Fig. 28a), whenthe load ratio <strong>and</strong> rise time, respectively, were changed from 0.5 <strong>and</strong> 60 s to 0.7 <strong>and</strong> 300 s.For the new loading condition, although the predicted CGR in air decreased by a factor <strong>of</strong> ª15(Eqs. 15–17), the measured rate in the environment increased by a factor <strong>of</strong> ª3. The resultsindicate the benefit <strong>of</strong> low–DO environment on growth rates; CGRs decreased by more than anorder <strong>of</strong> magnitude when the DO level was decreased to
For specimen C3–B, during Test Periods 1–4 the experimental K max values were 4–14%higher than the allowable value based on the effective yield stress <strong>and</strong> 30–50% higher duringPeriods 5–15. For this specimen, loading conditions for all test periods would satisfy the K/sizecriterion <strong>of</strong> Eq. 13 if the actual yield stress instead <strong>of</strong> effective yield stress is used. Thecrack–length–vs.–time plots in Figs. 26a <strong>and</strong> 28a <strong>and</strong> b show that environmental factors stillstrongly influenced the CGR at these K levels. For example, the CGRs decreased by a factor <strong>of</strong>ª20 when the DO level was decreased from ª300 to 10 ppb. Thus in this case, it is not clearthat the violation <strong>of</strong> the K size criterion after Test Period 3 actually led to a significant loss <strong>of</strong>specimen constraint.3.2.2 Specimen C3-C <strong>Irradiated</strong> to 2.0 x 10 21 n/cm 2The environmental <strong>and</strong> loading conditions, experimental CGRs, allowed K max from K/sizecriterion in Eq. 13, <strong>and</strong> the deviation <strong>of</strong> applied K max from the allowed value are given inTable 4. Allowed K max was determined using effective yield stress. Precracking was carried outat R = 0.3 <strong>and</strong> K max = 17 MPa m 1/2 ; the applied K max was maintained approximately constantduring individual test periods by periodic load shedding. The test was initiated in high–puritywater with ª300 ppb DO. After ª240 h, the DO level in the feedwater was decreased to ª10 ppbby sparging the feedwater tank first with pure nitrogen <strong>and</strong> then with nitrogen plus 5%hydrogen. The changes in crack length <strong>and</strong> ECP <strong>of</strong> Pt <strong>and</strong> SS electrodes during the transientperiod are shown in Fig. 29. As seen earlier for Specimen C3–B, it took several days for the DOlevel to decrease below 20 ppb, <strong>and</strong> changes in the steel ECP were slower than that in the PtECP. For example, the Pt ECP decreased to –450 mV (SHE) within a couple <strong>of</strong> days while thesteel ECP remained above –250 mV for a long time; it decreased below –400 mV only after thefeedwater tank was sparged with nitrogen plus 5% hydrogen gas mixture. The test wasterminated after 810 h because the range <strong>of</strong> valid K max was significantly exceeded.Table 4. <strong>Crack</strong> growth results for Specimen C3–C <strong>of</strong> Type 304 SS a in high–purity water at 289°CO Test ECPRise Down Hold<strong>Growth</strong> K max from DeviationTest Time, mV (SHE) b 2Conc., b Load Time, Time, Time, K max , DK, Rate, Eq. 13 in K max ,Period h Pt Steel ppb Ratio s s s MPa·m 1/2 MPa·m 1/2 m/s MPa m 1/2 %1 46 241 164 300 0.26 2 2 0 17.89 13.24 2.00E-08 22.4 -202 71 223 155 300 0.53 30 2 0 18.40 8.65 2.22E-09 22.1 -173 99 235 167 300 0.70 300 2 0 18.80 5.64 1.73E-09 21.8 -144 142 232 164 300 0.69 1000 2 0 19.21 5.96 1.25E-09 21.4 -105 191 233 164 300 0.70 2 2 3600 19.42 0 6.83E-10 21.1 -86 311 -450 7 100 0.70 2 2 3600 23.67 0 5.07E-10 20.5 167 560 -547 -294 10 0.70 2 2 3600 27.49 0 6.91E-10 19.1 448 706 -551 -502 10 0.70 2 2 3600 34.74 0 2.04E-09 16.4 1119 724 -557 -457 10 0.70 2 2 3600 36.96 0 3.70E-09 15.8 134a Heat C3, irradiated to 2.0 x 10 21 n/cm 2 .b Represents values in the effluent.Conductivity was 0.07 <strong>and</strong> 0.3–0.45 mS/cm in feedwater <strong>and</strong> effluent, respectively. Feedwater pH at roomtemperature was 6.5.A photomicrograph <strong>of</strong> the fracture surface <strong>of</strong> both halves <strong>of</strong> the specimen is shown inFig. 30. The final crack length was determined from the photograph <strong>of</strong> both halves <strong>of</strong> thefractured specimen. Several unbroken ligaments can be seen extending back from the finalcrack front. Because <strong>of</strong> these unbroken ligaments the crack lengths were determined from anaverage <strong>of</strong> 16 evenly spaced measurements. A total 17 measurements were made, the twonear–surface measurements were averaged, <strong>and</strong> the resultant value was averaged with theremaining 15 measurements. The actual crack extension was ª40% greater than the value26
8.608.40ª400 ppb DO
7.006.80Type 304 SS (Heat C3)Test CGRI–08 (Spec. C3-C)3025<strong>Crack</strong> Length (mm)6.606.40Fluence 2.0 x 10 21 n/cm 2 289°CCGR = 2.00 x 10 –8 m/sK max = 17.9 MPa m 0.5R = 0.26, Rise Time 2 sK maxCGR = 2.22 x 10 –9 m/sK max = 18.4 MPa m 0.5R = 0.53, Rise Time 30 s2015K max(MPa m 0.5 )<strong>Crack</strong> Length (mm)<strong>Crack</strong> Length (mm)6.20<strong>Crack</strong> Length6.00520 30 40 50 60 70 807.407.307.207.107.006.906.808.208.007.807.60Type 304 SS (Heat C3)Test CGRI–08 (Spec. C3-C)Time (h)(a)High–Purity Water, DO ª300 ppbSteel ECP 165 mV (SHE)Fluence 2.0 x 10 21 n/cm 2 CGR = 1.25 x 10 –9 m/sK max = 19.2 MPa m 0.5R = 0.69, Rise Time 1000 sK max<strong>Crack</strong> LengthCGR = 1.73 x 10 –9 m/s289°CK max = 18.8 MPa m 0.5R = 0.70, Rise Time 300 s80 100 120 140 160 180Type 304 SS (Heat C3)Test CGRI–08 (Spec. C3-C)Time (h)(b)CGR = 6.83 x 10 –10 m/sK max = 19.4 MPa m 0.5Constant load, periodic unloadto R = 0.7 every 1 hHigh–Purity Water, DO ª300 ppbSteel ECP 165 mV (SHE)Fluence 2.0 x 10 21 n/cm 2 ª20 ppb DOª80 ppb DOª400 ppb DO5.07 x 10 –10 m/s23.7 MPa m 0.5Steel ECP 165 – 10 mV (SHE)<strong>Crack</strong> Length289°CCGR = 6.91 x 10 –10 m/sK max = 27.5 MPa m 0.5Steel ECP -294 mV (SHE)103025201510545403530K max(MPa m 0.5 )K max(MPa m 0.5 )Figure 31.7.407.20K max20200 240 280 320 360 400 440 480 520Time (h)Constant Load, periodic unloadingto R = 0.7 every 1 h(c)<strong>Crack</strong>–length–vs.–time plots for irradiated Type 304 SS (Heat C3) in high–purity water at289°C during test periods (a) 1–2, (b) 3–5, (c) 6–7, <strong>and</strong> (d) 7–82528
<strong>Crack</strong> Length (mm)9.40Type 304 SS (Heat C3)Test CGRI–08 (Spec. C3-C)9.20Pure NFluence 2.0 x 10 21 n/cm 2 2CGR = 2.04 x 10 –9 m/s9.00K max = 34.7 MPa m 0.5Steel ECP -502 mV (SHE)8.80N 2+ 5% H 28.60 CGR = 6.91 x 10 –10 m/sK max = 27.5 MPa m 0.58.40 Steel ECP -254 mV (SHE)8.20289°CK maxHigh–Purity Water ª10 ppb DO8.00Constant Load, periodic unloading<strong>Crack</strong> Lengthto R = 0.7 every 1 h7.80450 500 550 600 650 700Time (h)(d)Figure 31. (Cont’d.)454035302520K max(MPa m 0.5 )3.2.3 Specimen C16-B <strong>Irradiated</strong> to 2.0 x 10 21 n/cm 2The environmental <strong>and</strong> loading conditions, experimental CGRs, allowed K max from K/sizecriterion in Eq. 13, <strong>and</strong> the deviation <strong>of</strong> applied K max from the allowed value are given inTable 5. Allowed K max was determined using effective yield stress in Eq. 13. Precracking wasinitiated at R = 0.3 <strong>and</strong> K max = 14 MPa m 1/2 . After ª0.4 mm advance, R was increasedincrementally to 0.7, <strong>and</strong> rise time increased to 30 s. The maximum stress intensity factorK max was maintained approximately constant by periodic load shedding. After ª265 h, the DOlevel in the feedwater was decreased from ª250 ppb to
“The social care line was that these were non-social workers who didn’t know whatthey were doing.” A former senior <strong>of</strong>ficer“She [social care manager] was the pr<strong>of</strong>essional, they were the statutory service,who knew what they doing <strong>and</strong> we were just youth workers…. That attitude is notuncommon, but is not generally seen to this extent. The roles are different, there aretensions - <strong>and</strong> that’s not always inappropriate - but not to this extreme. My relationswith [social care manager] <strong>and</strong> [social care manager] were very frosty”. A formeryouth service manager“There was pr<strong>of</strong>essional snobbery….. I was advocating for a young woman at ameeting <strong>and</strong> I was just shut up, I was told that I could sit in the meeting but that Iwasn’t allowed to participate. That’s how you were treated.” A youth workerThe issue <strong>of</strong> pr<strong>of</strong>essional boundaries was reinforced by a lack <strong>of</strong> underst<strong>and</strong>ing –deliberate or otherwise – about the type <strong>of</strong> information gathered <strong>and</strong> held about thegirls <strong>and</strong> the perpetrators. The information that Risky Business had was deemed ‘notgood enough’ by both social care <strong>and</strong> the police. Information they passed on was<strong>of</strong>ten discredited.“We spent months gathering information… This was in response to the messagefrom Social Care, that we were making things up, that the problem wasn’t as bad aswe were saying… Risky Business used to record every detail we got from the girls!We referred them all.” A youth worker“I’ve sat in a meeting with police where they’ve said, ‘we need to stop making storiessound worse than they are’.” A youth worker‘the way in which [RB] collate <strong>and</strong> share information…. is very much embedded intheir status as youth workers <strong>and</strong> the approach they take to sexual exploitation issimilar to that they would take in incidents <strong>of</strong> anti-social behaviour or the setting up <strong>of</strong>a youth club. That is by over time mapping out networks <strong>of</strong> young people <strong>and</strong>identifying their needs <strong>and</strong> perceptions. Whilst this will fit with the intelligencegathering model <strong>of</strong> the police it may not necessarily fit so well with the social caremodel <strong>of</strong> thresholds <strong>and</strong> priorities.’ Serious Case Review into the death <strong>of</strong> Child SThe value <strong>of</strong> the relationships Risky Business staff had with the girls was discreditedby social care <strong>and</strong> the police. It seemed to Inspectors that this attitude betrayed areal undervaluing <strong>of</strong> the relationships the project had developed with the girls whowere at risk <strong>of</strong> or were involved in CSE <strong>and</strong>, by extension, a real undervaluing <strong>of</strong> thegirls <strong>and</strong> their experience <strong>and</strong> the information they were providing. Staff werediscredited in both pr<strong>of</strong>essional <strong>and</strong> personal terms.44
7.006.956.90Type 304 SS (Heat C16)Test CGRI–09 (Spec. C16-B)CGR = 4.62 x 10 –10 m/sK max = 15.2 MPa m 0.5Constant Load, periodic unloadingto R = 0.7 every 1 hFluence 2.0 x 10 21 n/cm 2 289°CDO decreasedto
7.047.037.02Type 304 SS (Heat C16)Test CGRI–09 (Spec. C16-B)CGR = 4.11 x 10 –11 m/sK max = 19.7 MPa m 0.5Constant Load. periodicunloading to R = 0.7 every 1 h2624<strong>Crack</strong> Length (mm)7.017.006.99Fluence 2.0 x 10 21 n/cm 2 289°CCGR = 1.73 x 10 –11 m/sK max = 17.3 MPa m 0.5Constant Load. periodicunloading to R = 0.7 every 1 h<strong>Crack</strong> Length2220K max (MPa m 0.5 )6.986.97K maxHigh–Purity Water, DO
to 1.3 (Table 2),effective flow stress instead <strong>of</strong> effective yield stress was used to determine the allowed K maxfrom Eq. 13. The test was started in a high–DO environment (ª300 ppb DO in effluent), <strong>and</strong>the water flow rate was ª10 mL/min. The ECPs <strong>of</strong> Pt <strong>and</strong> SS electrodes in the effluent streamwere monitored continuously. Precracking was carried out at R = 0.3 <strong>and</strong> K max = 13–14 MPam 1/2 . After ª0.3 mm crack advance, R was increased incrementally to 0.7, <strong>and</strong> the waveformwas changed from triangular to saw-tooth with rise times <strong>of</strong> 12–500 s.A photomicrograph <strong>of</strong> the fracture surface <strong>of</strong> both halves <strong>of</strong> the specimen is shown inFig. 35. The final crack length, determined from the photograph, showed very good agreementwith the value estimated from the DC potential measurement. Also, the results in Table 6indicate that for specimen C3–A, loading conditions for all test periods, except 11 <strong>and</strong> 12,satisfied the K/size criterion <strong>of</strong> Eq. 13.The changes in crack length <strong>and</strong> K max with time during various test periods are shown inFigs. 36a–e. For this specimen, crack growth could not be maintained for loading conditionswith high values <strong>of</strong> R <strong>and</strong> relatively low K max . For example, at K max = 14 MPa m 1/2 increasingR from 0.3 to 0.5 essentially stopped crack growth (Fig. 36a). Changing R back to the earliervalue did not restore crack growth; K max had to be increased to start crack growth. To promoteenvironmentally enhanced crack growth, the rise time for the cyclic loading at R = 0.3 wasincreased from 0.5 to 300 s before increasing R (Fig. 36b). For R = 0.7, crack growth occurredonly at K max greater than 17 MPa m 1/2 .Table 6. <strong>Crack</strong> growth results for Specimen C3–A <strong>of</strong> Type 304 SS a in high–purity water at 289°CTest ECP b O 2Rise Down Hold<strong>Growth</strong> K max from DeviationTest Time, mV (SHE) Conc., b Load Time, Time, Time, K max , DK, Rate, Eq. 13 in K max ,Period h Pt Steel ppb Ratio s s s MPa·m 1/2 MPa·m 1/2 m/s MPa m 1/2 %Pre 55 226 167 300 0.31 0.5 0.5 0 12.9 8.9 2.94E-09 18.4 -301 165 212 166 300 0.30 0.5 0.5 0 14.0 9.8 8.37E-09 17.9 -222a 189 221 169 300 0.50 5 5 0 13.9 6.9 negligible 17.9 -232b 193 211 169 300 0.50 0.5 0.5 0 13.8 6.9 negligible 17.9 -232c 214 209 161 300 0.30 0.5 0.5 0 13.9 9.7 negligible 17.9 -232d 219 211 163 300 0.30 0.5 0.5 0 15.0 10.5 1.48E-08 17.7 -153 364 218 171 300 0.30 1 1 0 15.9 11.1 1.39E-08 17.5 -94 380 218 171 300 0.30 30 4 0 16.0 11.2 1.33E-09 17.4 -85 404 219 177 300 0.29 300 4 0 15.9 11.3 3.29E-10 17.4 -86 479 204 173 300 0.48 300 4 0 15.7 8.2 4.75E-11 17.4 -107 596 235 187 300 0.70 12 12 0 15.7 4.7 negligible 17.4 -108 670 228 188 300 0.70 12 12 0 17.6 5.3 6.23E-11 17.3 29 717 231 186 300 0.70 12 12 3600 17.8 – – 17.3 310 910 234 197 300 0.70 500 12 3600 17.9 – 8.65E-11 17.2 411 1080 232 200 300 0.70 500 12 3600 22.0 – 1.11E-10 17.1 2912 1175 226 203 300 0.70 500 1 9500 22.3 – 1.28E-10 17.0 31a Heat C3, irradiated to 2.0 x 10 21 n/cm 2 .b Represents values in the effluent. Conductivity was 0.07 <strong>and</strong> 0.3–0.45 mS/cm in feedwater <strong>and</strong> effluent, respectively.Feedwater pH at room temperature was 6.5.34
Figure 35.Photomicrographs <strong>of</strong> the fracture surface <strong>of</strong> Specimen C3–A<strong>Crack</strong> Length (mm)6.606.506.406.306.206.10Type 304 SS (Heat C3)Test CGRI–12 (Spec. C3-A)n/cm 28.37 x 10 –9 m/s14.0 MPa m 0.50.3, 1 Hz 13.9 MPa m 0.513.9 MPa m 0.50.5, 0.1 Hz0.3, 1 HzK maxFluence 0.3 x 10 21 289°C<strong>Crack</strong> Length13.8 MPa m 0.50.5, 1 Hz1.48 x 10 –8 m/s15.0 MPa m 0.50.3, 1 Hz14.1 MPa m 0.50.5, Rise time 12 sHigh–Purity Water, DO ª250 ppbSteel ECP 170 mV (SHE)2018161412K max(MPa m 0.5 )<strong>Crack</strong> Length (mm)6.0010140 160 180 200 220 2406.806.756.706.656.606.556.506.45Type 304 SS (Heat C3)Test CGRI–12 (Spec. C3-A)Time (h)(a)Fluence 0.3 x 10 21 n/cm 2 1.33 x 10 –9 m/s16.0 MPa m 0.51.39 x 10 –8 m/s 0.3, 30 s rise time15.9 MPa m 0.50.3, 0.5 HzK max289°C<strong>Crack</strong> Length3.29 x 10 –10 m/s15.9 MPa m 0.50.3, 300 s rise timeHigh–Purity Water, DO ª300 ppbSteel ECP 170 mV (SHE)6.40280 300 320 340 360 380 40010Time (h)(b)Figure 36. <strong>Crack</strong>–length–vs.–time plots for irradiated Type 316 SS (Heat C16) in high–purity water at289°C during test periods (a) 1–2, (b) 3–5, (c) 6–7, (d) 8–10, <strong>and</strong> (e) 11–12.2018161412K max(MPa m 0.5 )35
6.906.85Type 304 SS (Heat C3)289°CTest CGRI–12 (Spec. C3-A)High–Purity Water, DO ª300 ppbFluence 0.3 x 10 21 n/cm 2 Steel ECP 180 mV (SHE)2018<strong>Crack</strong> Length (mm)6.806.756.70K max1614K max(MPa m 0.5 )6.65<strong>Crack</strong> Length4.75 x 10 –11 m/s15.7 MPa m 0.50.48, 300 s rise timenegligible growth0.7, 12 s rise time12<strong>Crack</strong> Length (mm)6.6010400 450 500 550 6006.906.856.806.756.70Type 304 SS (Heat C3)Test CGRI–12 (Spec. C3-A)Time (h)(c)24222018K max(MPa m 0.5 )6.65K maxFluence 0.3 x 10 21 n/cm 2 289°C6.23 x 10 –11 m/s17.6 MPa m 0.50.70, 12 s rise timeCGR not determined17.9 MPa m 0.50.70, 12 s rise time3600 s hold<strong>Crack</strong> Length8.65 x 10U-11 m/s17.9 MPa m 0.50.70, 500 s rise time3600 s holdHigh–Purity Water, DO ª250 ppbSteel ECP 210 mV (SHE)16<strong>Crack</strong> Length (mm)6.607.006.956.906.856.80600 650 700 750 800 850 900Type 304 SS (Heat C3)Test CGRI–12 (Spec. C3-A)Time (h)(d)28262422K max(MPa m 0.5 )6.75K maxFluence 0.3 x 10 21 n/cm 2 289°C<strong>Crack</strong> Length1.11 x 10U-10 m/s22.0 MPa m 0.50.70, 500 s rise time3600 s hold1.13 x 10U-10 m/s22.3 MPa m 0.50.70, 500 s rise time9500 s holdHigh–Purity Water, DO ª250 ppbSteel ECP 218 mV (SHE)206.70900 950 1000 1050 1100 1150 1200Time (h)(e)Figure 36. (Cont’d)36
<strong>Crack</strong> growth rates could not be measured during test period 9 because <strong>of</strong> significantvariations in the autoclave temperature, which resulted in large fluctuations in the DCpotential measurements (Fig. 36d). Also, during test period 11 (Fig. 36e), applied K maxgradually decreased from the desired value <strong>of</strong> 22 to 20.5 MPa m 1/2 over a 50–h period because<strong>of</strong> faulty back–pressure regulator. Specimen C3–A irradiated to 0.3 x 10 21 n/cm 2 showed verylittle environmental enhancement <strong>of</strong> CGRs both under continuous cycling <strong>and</strong> SCC conditions.There was no change in CGR when the hold time was increased from 3600 to 9500 s (Fig. 36etest period 11 <strong>and</strong> 12).3.2.5 CGRs <strong>of</strong> <strong>Irradiated</strong> <strong>Austenitic</strong> SSs under Continuous CyclingFor continuous cyclic loading, the experimental CGRs for irradiated austenitic SSs inhigh– <strong>and</strong> low–DO environments <strong>and</strong> those predicted in air for the same loading conditions areplotted in Fig. 37. The curves represent the Shack/Kassner model for nonirradiated austeniticSSs in high–purity water with either 8 or 0.2 ppm DO (Eqs. 18 <strong>and</strong> 19, respectively) <strong>and</strong> areincluded to provide a comparison with the irradiated CGR data. The CGRs in air ȧ air (m/s)were determined from the correlations developed by James <strong>and</strong> Jones, 36 e.g., Eqs. 15–17.The results for SSs irradiated to 0.9 or 2.0 x 10 21 n/cm 2 (1.35 or 3.0 dpa) indicatesignificant enhancement <strong>of</strong> the CGRs in high–DO water under cyclic loading with long risetimes. The CGRs for Type 304 SS irradiated to either 0.9 or 2.0 x 10 21 n◊cm –2 , <strong>and</strong> Type 316SS irradiated to 2.0 x 10 21 n◊cm –2 are comparable. For these irradiation conditions, the CGRsin water with ª 300 ppb DO are slightly higher than the rates predicted by the Shack/Kassnermodel for nonirradiated austenitic SSs in high–purity water with 8 ppm DO (Fig. 37a).Type 304 SS irradiated to 0.3 x 10 21 n/cm 2 (0.45 dpa) shows very little environmentalenhancement <strong>of</strong> CGRs in high–DO water (open diamonds in Fig. 37a); the CGRs in water withª 300 ppb DO may be represented by the Shack/Kassner model for nonirradiated austeniticSSs in high–purity water with 0.2 ppm DO.10 -8<strong>Austenitic</strong> SSs, 289°Cª300 ppb Dissolved OxygenShack/KassnerModel 8 ppm DOCGR air +1.5x10 -4 CGR 0.5air10 -8<strong>Austenitic</strong> SSs289°C
For continuous cyclic loading, decreasing the DO level has a beneficial effect on CGRs,e.g., decreasing the DO from ª300 ppb DO to
4. Summary<strong>Fracture</strong> toughness J–R curve tests have been conducted on four heats <strong>of</strong> Type 304 SSthat were irradiated to fluence levels <strong>of</strong> ª0.3, 0.9, <strong>and</strong> 2.0 x 10 21 n/cm 2 (E > 1 MeV) (ª0.45,1.35, 3.00 dpa) at ª288°C in a helium environment in the Halden boiling heavy water reactor.The tests were performed on 1/4–T compact tension specimens in air at 288°C; crackextensions were determined by both DC potential <strong>and</strong> elastic unloading compliance techniques.Neutron irradiation at 288°C to 2.0 x 10 21 n/cm 2 (E > 1 MeV) (3.0 dpa) decreased thefracture toughness <strong>of</strong> all <strong>of</strong> the steels. For these materials, minor differences in the chemicalcomposition <strong>of</strong> the steels, e.g., differences in nickel content for Heats C16 <strong>and</strong> C19 or siliconcontent for heats L2 <strong>and</strong> L20, have little or no effect on the fracture toughness <strong>of</strong> irradiatedsteels.In general, fracture toughness <strong>of</strong> the commercial Heats C16 <strong>and</strong> C19 is superior to that <strong>of</strong>the laboratory Heats L20 <strong>and</strong> L2. These differences arise primarily from differences intoughness <strong>of</strong> the nonirradiated steels, i.e., the fracture toughness <strong>of</strong> the laboratory heats issignificantly lower than that <strong>of</strong> the commercial heats. The fracture toughness J–R curves forirradiated Types 304 <strong>and</strong> 316 SS are comparable. The data from commercial heats fall withinthe scatter b<strong>and</strong> for the data obtained at higher temperatures. For Heat C19 <strong>of</strong> Type 304 SSirradiated to 0.3, 0.9, <strong>and</strong> 2.0 x 10 21 n/cm 2 , the J Ic values are 507, 313, <strong>and</strong> 188 kJ/m 2 ,respectively.<strong>Crack</strong> growth tests have been performed in simulated BWR environments at ª289°C onType 304 SS (Heat C3) irradiated to 0.3, 0.9, <strong>and</strong> 2.0 x 10 21 n/cm 2 <strong>and</strong> Type 316 SS (HeatC16) irradiated to 2.0 x 10 21 n/cm 2 at ª288°C in a helium environment. The tests wereconducted under cyclic loading with a slow/fast sawtooth waveform <strong>and</strong> long rise times or atrapezoidal waveform. The latter essentially represents constant load with periodic partialunloads.The results for the steels irradiated to either 0.9 or 2.0 x 10 21 n/cm 2 indicate significantenhancement <strong>of</strong> CGRs in the NWC BWR environment. For these irradiation conditions, theCGRs under continuous cycling are slightly higher than the rates predicted by theShack/Kassner model for nonirradiated austenitic SSs in high–purity water with 8 ppm DO.The CGRs under SCC conditions are a factor <strong>of</strong> ª5 higher than the disposition curve proposedin NUREG–0313 for sensitized austenitic SSs. The CGRs <strong>of</strong> Type 304 SS irradiated to 0.9 <strong>and</strong>2.0 x 10 21 n/cm 2 <strong>and</strong> <strong>of</strong> Types 304 <strong>and</strong> 316 SS irradiated to 2.0 x 10 21 n/cm 2 are comparable.In low–DO BWR environments, the CGRs <strong>of</strong> the irradiated steels decreased by an order <strong>of</strong>magnitude in tests where K values clearly met the validity criteria, e.g., Heat C3 <strong>of</strong> Type 304 SSirradiated to 0.9 x 10 21 n/cm 2 <strong>and</strong> Heat C16 <strong>of</strong> Type 316 SS irradiated to 2 x 10 21 n/cm 2 . Thebeneficial effect <strong>of</strong> decreased DO was not observed for Heat C3 <strong>of</strong> Type 304 SS irradiated to2 x 10 21 n/cm 2 ; it is possible that this different behavior is associated with the loss <strong>of</strong>constraint in the specimen due to the high K.Type 304 SS irradiated to 0.3 x 10 21 n/cm 2 (0.45 dpa) shows very little environmentalenhancement <strong>of</strong> CGRs in the NWC BWR environment; under continuous cycling, the CGRs arecomparable to those predicted by the Shack/Kassner model for nonirradiated austenitic SSs in39
high–purity water with 0.2 ppm DO. The CGRs for Type 304 irradiated to 0.3 x 10 21 n/cm 2under SCC conditions are below the disposition curve for sensitized SSs in water with 8 ppmDO given in NUREG–0313.40
References1. S. M. Bruemmer et al., “Critical Issue Reviews for the Underst<strong>and</strong>ing <strong>and</strong> Evaluation <strong>of</strong>Irradiation–Assisted Stress Corrosion <strong>Crack</strong>ing,” EPRI TR–107159, Electric PowerResearch Institute, Palo Alto, CA (1996).2. M. L. Herrera, et al., “Evaluation <strong>of</strong> the Effects <strong>of</strong> Irradiation on the <strong>Fracture</strong> <strong>Toughness</strong> <strong>of</strong>BWR Internal Components,” in Proc. ASME/JSME 4th Intl. Conf. on Nucl. Eng.(ICONE–4) Vol. 5, A. S. Rao, R. M. Duffey, <strong>and</strong> D. Elias, eds., American Society <strong>of</strong>Mechanical Engineers, New York, pp. 245–251 (1996).3. W. J. Mills, “<strong>Fracture</strong> <strong>Toughness</strong> <strong>of</strong> Type 304 <strong>and</strong> 316 Stainless Steels <strong>and</strong> their Welds,”Intl. Mater. Rev. 42, 45–82 (1997).4. H. Kanasaki, I. Satoh, M. Koyama, T. Okubo, T. R. Mager, <strong>and</strong> R. G. Lott, “Fatigue <strong>and</strong>Stress Corrosion <strong>Crack</strong>ing Behaviors <strong>of</strong> <strong>Irradiated</strong> Stainless Steels in PWR PrimaryWater,” Proc. 5th Intl. Conf. On Nuclear Engineering, ICONE5-2372, pp. 1–7 (1997).5. P. L. Andresen, F. P. Ford, S. M. Murphy, <strong>and</strong> J. M. Perks, “State <strong>of</strong> Knowledge <strong>of</strong>Radiation Effects on Environmental <strong>Crack</strong>ing in Light Water Reactor Core Materials,”Proc. 4th Intl. Symp. on Environmental Degradation <strong>of</strong> Materials in Nuclear PowerSystems – Water Reactors, NACE, pp. 1.83–1.121 (1990).6. A. Jenssen <strong>and</strong> L. G. Ljungberg, “Irradiation Assisted Stress Corrosion <strong>Crack</strong>ing <strong>of</strong>Stainless Alloys in BWR Normal Water Chemistry <strong>and</strong> Hydrogen Water Chemistry,” Proc.Sixth Intl. Symp. on Environmental Degradation <strong>of</strong> Materials in Nuclear Power Systems –Water Reactor, R. E. Gold <strong>and</strong> E. P. Simonen, eds., Minerals, Metals & Materials Society,547–553 (1993).7. P. J. Maziasz <strong>and</strong> C. J. McHargue, “Microstructural Evolution in Annealed <strong>Austenitic</strong>Steels during Neutron Irradiation,” Int. Met. Rev. 32, 190 (1987).8. P. J. Maziasz, “Overview <strong>of</strong> Microstructural Evolution in Neutron–<strong>Irradiated</strong> <strong>Austenitic</strong>Stainless Steels,” J. Nucl. Mater. 205, 118–145 (1993).9. F. A. Garner, “Evolution <strong>of</strong> Microstructures in Face–Centered Cubic Metals duringNeutron Irradiation,” J. Nucl. Mater. 205, 98–111 (1993).10. J. Dufresne, B. Henry, <strong>and</strong> H. Larsson, “<strong>Fracture</strong> <strong>Toughness</strong> <strong>of</strong> <strong>Irradiated</strong> AISI 304 <strong>and</strong>316L Stainless Steels,” in Effects <strong>of</strong> Radiation on Structural Materials, ASTM STP 683,J. A. Sprague <strong>and</strong> D. Kramer, eds., American Society for Testing <strong>and</strong> Materials,Philadelphia, pp. 511–528 (1979).11. C. Picker, A. L. Stott, <strong>and</strong> H. Cocks, “Effects <strong>of</strong> Low–Dose Fast Neutron Irradiation on the<strong>Fracture</strong> <strong>Toughness</strong> <strong>of</strong> Type 316 Stainless Steel <strong>and</strong> Weld Metal,” in Proc. SpecialistsMeeting on Mechanical Properties <strong>of</strong> Fast Reactor Structural Materials, Chester, UK,Paper IWGFR 49/440–4 (1983).41
12. F. H. Huang, “The <strong>Fracture</strong> Characterization <strong>of</strong> Highly <strong>Irradiated</strong> Type 316 StainlessSteel,” Int. J. <strong>Fracture</strong> 25, 181–193 (1984).13. J. Bernard <strong>and</strong> G. Verzeletti, “Elasto–Plastic <strong>Fracture</strong> Mechanics Characterization <strong>of</strong>Type 316H <strong>Irradiated</strong> Stainless Steel up to 1 dpa,” in Effects <strong>of</strong> Radiation on Materials:12th Intl. Symp., ASTM STP 870, F. A. Garner <strong>and</strong> J. S. Perrin, eds., American Society forTesting <strong>and</strong> Materials, Philadelphia, pp. 619–641 (1985).14. W. J. Mills, L. A. James, <strong>and</strong> L. D. Blackburn, 1985, “Results <strong>of</strong> <strong>Fracture</strong> Mechanics Testson PNC SU 304 Plate,” Westinghouse Hanford Report HEDL–7544, Hanford EngineeringDevelopment Laboratory, Richl<strong>and</strong>, WA.15. W. J. Mills, “<strong>Fracture</strong> <strong>Toughness</strong> <strong>of</strong> <strong>Irradiated</strong> Stainless Steel Alloys,” Nucl. Technol. 82,290–303 (1988).16. D. J. Michel <strong>and</strong> R. A. Gray, “Effects <strong>of</strong> Irradiation on the <strong>Fracture</strong> <strong>Toughness</strong> <strong>of</strong> FBRStructural Materials,” J. Nucl. Mater. 148, 194–203 (1987).17. P. Ould, P. Balladon, <strong>and</strong> Y. Meyzaud, Bull. Cercle Etud. Metaux 15, 31.1–31.12 (1988).18. E. V. Van Osch, M. G. Horsten, <strong>and</strong> M. I. De Vries, “<strong>Fracture</strong> <strong>Toughness</strong> <strong>of</strong> PWRInternals,” ECN Contribution to CEC Contract on PWR Internals–Part 2(ETNU/CT/94/0136–F), ECN–I–97–010 (71747/NUC/EvO/mh/006274), Netherl<strong>and</strong>sEnergy Research Foundation ECN, Petten, the Netherl<strong>and</strong>s (1997).19. K. S. Brown <strong>and</strong> G. M. Gordon, “Effects <strong>of</strong> BWR Coolant Chemistry on the Propensity forIGSCC Initiation <strong>and</strong> <strong>Growth</strong> in Creviced Reactor Internals Components,” Proc. Third Intl.Symp. on Environmental Degradation <strong>of</strong> Materials in Nuclear Power Systems – WaterReactor, AIME, pp. 243–248 (1987).20. G. M. Gordon <strong>and</strong> K. S. Brown, “Dependence <strong>of</strong> Creviced BWR Component IGSCCBehavior on Coolant Chemistry,” Proc. 4th Intl. Symp. on Environmental Degradation <strong>of</strong>Materials in Nuclear Power Systems – Water Reactor, Daniel Cubicciotti, ed., NACE,pp. 14.46–14.61 (1990).21. F. Garzarolli, D. Alter, <strong>and</strong> P. Dewes, “Deformability <strong>of</strong> <strong>Austenitic</strong> Stainless Steels <strong>and</strong>Nickel–Base Alloys in the Core <strong>of</strong> a Boiling <strong>and</strong> a Pressurized Water Reactor,” Proc. Intl.Symp. on Environmental Degradation <strong>of</strong> Materials in Nuclear Power Systems – WaterReactor, ANS, pp. 131–138 (1986).22. M. Kodama et al., “IASCC Susceptibility <strong>of</strong> <strong>Austenitic</strong> Stainless Steels <strong>Irradiated</strong> to HighNeutron Fluence,” Proc. Sixth Intl. Symp. on Environmental Degradation <strong>of</strong> Materials inNuclear Power Systems – Water Reactor, R. E. Gold <strong>and</strong> E. P. Simonen, eds., Minerals,Metals & Materials Society, pp. 583–588 (1993).23. M. Kodama et al., “Effects <strong>of</strong> Fluence <strong>and</strong> Dissolved Oxygen on IASCC in <strong>Austenitic</strong>Stainless Steels,” Proc. Fifth Intl. Symp. on Environmental Degradation <strong>of</strong> Materials inNuclear Power Systems – Water Reactor, American Nuclear Society, pp. 948–954 (1991).42
24. W. L. Clark <strong>and</strong> A. J. Jacobs, “Effect <strong>of</strong> Radiation Environment on SCC <strong>of</strong> <strong>Austenitic</strong>Materials,” Proc. First Intl. Symp. on Environmental Degradation <strong>of</strong> Materials in NuclearPower Systems – Water Reactor, NACE, p. 451 (1983).25. A. Jenssen <strong>and</strong> L. G. Ljungberg, “Irradiation Assisted Stress Corrosion <strong>Crack</strong>ing <strong>of</strong>Stainless Alloys in BWR Normal Water Chemistry <strong>and</strong> Hydrogen Water Chemistry,” Proc.Sixth Intl. Symp. on Environmental Degradation <strong>of</strong> Materials in Nuclear Power Systems –Water Reactor, R. E. Gold <strong>and</strong> E. P. Simonen, eds., Minerals, Metals & Materials Society,pp. 547–553 (1993).26. A. Jenssen <strong>and</strong> L. G. Ljungberg, “Irradiation Assisted Stress Corrosion <strong>Crack</strong>ing. PostIrradiation CERT Tests <strong>of</strong> Stainless Steels in a BWR Test Loop,” Proc. Seventh Intl. Symp.on Environmental Degradation <strong>of</strong> Materials in Nuclear Power Systems – Water Reactor,G. Airey et al., eds., NACE, pp. 1043–1052 (1995).27. H. M. Chung, W. E. Ruther, R. V. Strain, <strong>and</strong> W. J. Shack, “<strong>Irradiated</strong>–Assisted StressCorrosion <strong>Crack</strong>ing <strong>of</strong> Model <strong>Austenitic</strong> Stainless Steel Alloys,” NUREG/CR–6687,ANL–00/21 (Oct. 2000).28. H. M. Chung, R. V. Strain, <strong>and</strong> R. W. Clark, “Slow–Strain–Rate–Tensile Test <strong>of</strong> Model<strong>Austenitic</strong> Stainless Steels <strong>Irradiated</strong> in the Halden Reactor,” in Environmentally Assisted<strong>Crack</strong>ing in Light Water Reactors Annual Report January–December 2001,NUREG/CR–4667, Vol. 32, ANL–02/33, pp. 19–28 (2003).29. O. K. Chopra, E. E. Gruber, <strong>and</strong> W. J. Shack, “<strong>Fracture</strong> <strong>Toughness</strong> Characterization <strong>of</strong>Type 304 Stainless Steel <strong>Irradiated</strong> in the Halden Reactor,” Proc. <strong>of</strong> the 8th Intl. Conf. onNuclear Engineering, ICONE8–8301, ASME (2000).30. E. E. Gruber <strong>and</strong> O. K. Chopra, “<strong>Fracture</strong> <strong>Toughness</strong> J–R Test <strong>of</strong> <strong>Austenitic</strong> StainlessSteels <strong>Irradiated</strong> in Halden Reactor,” in Environmentally Assisted <strong>Crack</strong>ing in Light WaterReactors Semiannual Report January 1999–June 1999, NUREG/CR–4667, Vol. 28,ANL–00/7, pp. 27–35 (July 2000).31. E. E. Gruber <strong>and</strong> O. K. Chopra, “<strong>Fracture</strong> <strong>Toughness</strong> J–R Test <strong>of</strong> <strong>Austenitic</strong> StainlessSteels <strong>Irradiated</strong> in Halden Reactor,” in Environmentally Assisted <strong>Crack</strong>ing in Light WaterReactors Semiannual Report July 1999–December 1999, NUREG/CR–4667, Vol. 29,ANL–00/23, pp. 30–38 (Nov. 2000).32. E. E. Gruber <strong>and</strong> O. K. Chopra, “<strong>Fracture</strong> <strong>Toughness</strong> J–R Test <strong>of</strong> <strong>Austenitic</strong> StainlessSteels <strong>Irradiated</strong> in Halden Reactor,” in Environmentally Assisted <strong>Crack</strong>ing in Light WaterReactors Semiannual Report July 1998–December 1998, NUREG/CR–4667, Vol. 31,ANL–01/09, pp. 33–37 (April 2002).33. E. E. Gruber <strong>and</strong> O. K. Chopra, “<strong>Fracture</strong> <strong>Toughness</strong> J–R Test <strong>of</strong> <strong>Austenitic</strong> StainlessSteels <strong>Irradiated</strong> in Halden Reactor,” in Environmentally Assisted <strong>Crack</strong>ing in Light WaterReactors Semiannual Report July 1998–December 1998, NUREG/CR–4667, Vol. 27,ANL–99/11, pp. 39–45 (Oct. 1999).43
34. P. L. Andresen, “Similarity <strong>of</strong> Cold Work <strong>and</strong> Radiation Hardening in Enhancing YieldStrength <strong>and</strong> SCC <strong>Growth</strong> <strong>of</strong> Stainless Steel in Hot Water,” Corrosion/02, Paper 02509,NACE (2002).35. W. J. Shack <strong>and</strong> T. F. Kassner, “Review <strong>of</strong> Environmental Effects on Fatigue <strong>Crack</strong><strong>Growth</strong> <strong>of</strong> <strong>Austenitic</strong> Stainless Steels,” NUREG/CR–6176, ANL–94/1 (May 1994).36. L. A. James <strong>and</strong> D. P. Jones, “Fatigue <strong>Crack</strong> <strong>Growth</strong> Correlation for <strong>Austenitic</strong> StainlessSteels in Air,” Proc. Conf. on Predictive Capabilities in Environmentally–Assisted<strong>Crack</strong>ing, PVP Vol. 99, R. Rungta, ed., American Society <strong>of</strong> Mechanical Engineers,New York, pp. 363–414 (1985).37. W. S. Hazelton <strong>and</strong> W. H. Koo, “Technical Report on Material Selection <strong>and</strong> ProcessingGuidelines for BWR Coolant Pressure Boundary Piping, Final Report,” NUREG–0313,Rev. 2 (1988).38. A. L. Hiser, “<strong>Fracture</strong> <strong>Toughness</strong> Characterization <strong>of</strong> Nuclear Piping Steels,”NUREG/CR–5118, MEA–2325, Materials Engineering Associates, Inc., Lanham, MD(1989).39. G. M. Wilkowski et al., “Degraded Piping Program – Phase II, Semiannual Report,”NUREG/CR–4082, Vol. 2 (1985).40. Mills, W. J., “Heat–to–Heat Variations in the <strong>Fracture</strong> <strong>Toughness</strong> <strong>of</strong> <strong>Austenitic</strong> StainlessSteels,” Eng. <strong>Fracture</strong> Mech. 30, 469–492 (1988).41. M. G. Vassilaros, R. A. Hays, <strong>and</strong> J. P. Gudas, “Investigation <strong>of</strong> the Ductile <strong>Fracture</strong>Properties <strong>of</strong> Type 304 Stainless Steel Plate, Welds, <strong>and</strong> 4–Inch Pipe,” in Proc. 12th WaterReactor Safety Information Meeting, NUREG/CP–0058, Vol. 4, U.S. Nuclear RegulatoryCommission, pp. 176–189 (1985).44
Appendix45
Table A-1. Test data for specimen Y4–03 <strong>of</strong> thermally aged CF–8M cast SS tested at 288°CTest Number : JR–18 Test Temp. : 288°CMaterial Type : CF–8M Cast SS Heat Number : 4331Aging Temp. : 400°C Aging Time : 700 hIrradiation Temp. : – Fluence : –Thickness : 6.515 mm Net Thickness : 5.879 mmWidth : 12.005 mm Flow Stress : 410.5 MPaModulus E : 180 GPaInitial <strong>Crack</strong> : 7.43 mm Init. a/W : 0.62 (Measured)Final <strong>Crack</strong> : 8.90 mm Final a/W : 0.74 (Measured)Final <strong>Crack</strong> : 8.97 mm Final a/W : 0.75 (Compliance)Load Deflection Unloading Compliance DC Potential MethodNo. (kN) (mm) J (kJ/m 2 ) Da (mm) J (kJ/m 2 ) Da (mm)0 0.0885 0.0001 1.6352 0.309 34.5 0.103 32.9 0.0212 1.7575 0.398 48.6 0.016 45.6 0.0303 1.8598 0.490 63.3 -0.030 59.3 0.0394 1.9474 0.583 76.7 0.042 74.0 0.0475 2.0168 0.678 93.2 -0.001 89.5 0.0576 2.0747 0.774 110.1 -0.014 105.7 0.0677 2.1142 0.871 126.9 -0.013 120.7 0.1598 2.1325 0.971 144.1 -0.003 136.2 0.2119 2.1641 1.069 158.8 0.061 152.2 0.26210 2.1930 1.169 175.9 0.077 168.6 0.30911 2.1907 1.269 192.1 0.120 185.0 0.36512 2.1627 1.373 205.9 0.209 200.2 0.45113 2.1592 1.475 220.9 0.266 215.4 0.51714 2.1463 1.577 235.9 0.325 230.8 0.58415 2.1369 1.679 251.6 0.370 245.9 0.65216 2.1329 1.781 266.0 0.432 261.3 0.71217 2.1169 1.884 282.4 0.468 276.9 0.77118 2.0898 1.988 293.2 0.569 291.6 0.84119 2.0822 2.091 307.6 0.621 306.6 0.89720 2.0395 2.196 321.1 0.688 321.9 0.95621 1.9870 2.302 331.2 0.781 335.5 1.02722 1.9336 2.408 337.5 0.903 347.7 1.10423 1.8696 2.515 345.5 1.004 359.9 1.17424 1.8184 2.621 348.7 1.139 371.5 1.24325 1.7353 2.731 347.2 1.309 382.5 1.31626 1.6788 2.837 348.2 1.444 390.6 1.39927 1.6272 2.943 354.2 1.541 399.1 1.471Power–Law FitJ = C(Da) nUnloading Compliance J Ic : 258 kJ/m 2 (15 Data)Coeff. C : 334 kJ/m 2 Exponent n : 0.25 Fit Coeff. R : 0.907DC Potential Method J Ic : 162 kJ/m 2 (20 Data)Coeff. C : 324 kJ/m 2 Exponent n : 0.57 Fit Coeff. R : 0.99747
3.02.5Load (kN)2.01.51.00.5Load–LoadlineDisplacementMeasuredCorrected0.00 0.5 1 1.5 2 2.5 3 3.5Displacement (mm)Test JR-18Specimen Y4-03288°CCF–8M (Heat 4331)Aged 700 h at 400°CFigure A-1.1. Load-vs.-loadline displacement curve for specimen Y4–03<strong>of</strong> thermally aged CF–8M cast SS tested at 288°CFigure A-1.2. <strong>Fracture</strong> surface <strong>of</strong> specimen Y4–03 tested at 288°C48
Table A-2. Test data for specimen Y4–02 <strong>of</strong> thermally aged CF–8M cast SS tested at 288°CTest Number : JR–10 Test Temp. : 288°CMaterial Type : CF–8M Cast SS Heat Number : 4331Aging Temp. : 400°C Aging Time : 700 hIrradiation Temp. : – Fluence : –Thickness : 6.515 mm Net Thickness : 5.857 mmWidth : 12.003 mm Flow Stress : 410.5 MPaModulus E : 180 GPaInitial <strong>Crack</strong> : 7.51 mm Init. a/W : 0.63 (Measured)Final <strong>Crack</strong> : 9.32 mm Final a/W : 0.78 (Measured)Final <strong>Crack</strong> : 9.79 mm Final a/W : 0.82 (Compliance)Load Deflection Unloading Compliance DC Potential MethodNo. (kN) (mm) J (kJ/m 2 ) Da (mm) J (kJ/m 2 ) Da (mm)0 0.0454 0.0001 1.3318 0.126 11.3 0.090 10.2 0.0062 1.5435 0.207 21.7 0.135 20.3 0.0123 1.8447 0.380 49.2 -0.127 45.7 0.0274 1.9550 0.471 61.3 0.015 60.3 0.0365 2.2615 0.846 129.8 -0.147 127.6 0.0766 2.3153 0.942 142.5 -0.003 146.1 0.0877 2.3602 1.039 158.0 0.075 165.0 0.0988 2.3776 1.139 174.3 0.158 183.5 0.1489 2.3923 1.240 190.4 0.245 201.3 0.20210 2.4221 1.338 207.1 0.313 218.4 0.25911 2.4132 1.440 224.0 0.395 236.7 0.31112 2.4189 1.537 242.1 0.441 253.7 0.36713 2.4221 1.638 263.4 0.454 270.7 0.43314 2.3963 1.741 284.2 0.479 287.4 0.50215 2.3313 1.846 304.8 0.504 303.1 0.58116 2.2815 1.951 325.9 0.516 317.4 0.66817 2.2210 2.056 338.7 0.607 331.3 0.75018 2.1712 2.161 356.1 0.644 344.9 0.82819 2.0689 2.270 353.6 0.856 357.3 0.92020 1.9830 2.379 359.4 0.981 366.8 1.02321 1.8812 2.488 347.5 1.245 374.5 1.13322 1.7815 2.597 343.0 1.435 380.2 1.24523 1.7143 2.704 345.7 1.569 385.9 1.34724 1.6143 2.815 335.4 1.797 389.5 1.46525 1.5329 2.923 333.6 1.950 394.1 1.56026 1.4724 3.029 337.5 2.060 397.5 1.65827 1.4208 3.136 338.5 2.188 402.4 1.74028 1.3745 3.241 343.7 2.284 408.5 1.813Power–Law FitJ = C(Da) nUnloading Compliance J Ic : 252 kJ/m 2 (14 Data)Coeff. C : 341 kJ/m 2 Exponent n : 0.29 Fit Coeff. R : 0.620DC Potential Method J Ic : 254 kJ/m 2 (14 Data)Coeff. C : 351 kJ/m 2 Exponent n : 0.31 Fit Coeff. R : 0.97649
3.02.5Load (kN)2.01.51.00.5Load–LoadlineDisplacementMeasuredCorrected0.00 0.5 1 1.5 2 2.5 3 3.5Displacement (mm)Test JR-10288°CCF–8M (Heat 4331)Aged 700 h at 400°CFigure A-2.1. Load-vs.-loadline displacement curve for specimen Y4–02<strong>of</strong> thermally aged CF–8M cast SS tested at 288°CFigure A-2.2. <strong>Fracture</strong> surface <strong>of</strong> specimen Y4–02 tested at 288°C50
Table A-3. Test data for specimen 75–03T <strong>of</strong> thermally aged CF–8M cast SS tested at 288°CTest Number : JR–07 Test Temp. : 288°CMaterial Type : CF–8M Cast SS Heat Number : 75Aging Temp. : 400°C Aging Time : 10,000 hIrradiation Temp. : – Fluence : –Thickness : 6.51 mm Net Thickness : 5.90 mmWidth : 11.98 mm Flow Stress : 410.0 MPaModulus E : 180 GPaInitial <strong>Crack</strong> : 7.28 mm Init. a/W : 0.61 (Measured)Final <strong>Crack</strong> : 9.35 mm Final a/W : 0.78 (Measured)Final <strong>Crack</strong> : 8.72 mm Final a/W : 0.73 (Compliance)Load Deflection Unloading Compliance DC Potential MethodNo. (kN) (mm) J (kJ/m 2 ) Da (mm) J (kJ/m 2 ) Da (mm)0 0.0436 0.0001 1.0106 0.057 2.0 -0.105 3.3 0.0022 1.3193 0.128 10.0 -0.144 10.4 0.0063 1.5284 0.209 18.5 0.064 19.9 0.0124 1.8202 0.385 43.2 -0.115 44.1 0.0275 1.9252 0.476 54.0 0.075 57.9 0.0356 2.0155 0.569 65.1 0.293 72.7 0.0447 2.0982 0.659 88.7 -0.130 87.7 0.0538 2.1654 0.753 103.9 -0.069 103.8 0.0639 2.2201 0.849 118.4 0.005 120.8 0.07310 2.2704 0.946 131.8 0.116 138.2 0.08411 2.2922 1.045 148.4 0.162 156.3 0.09512 2.2904 1.147 166.6 0.184 171.4 0.20513 2.2895 1.247 185.9 0.177 183.9 0.33614 2.2695 1.351 200.2 0.276 195.7 0.49115 2.2375 1.455 217.3 0.316 207.2 0.63816 2.2228 1.558 237.1 0.309 219.2 0.76617 2.1885 1.663 249.8 0.409 232.0 0.88418 2.1151 1.770 262.2 0.505 243.1 1.03319 1.9839 1.883 267.4 0.686 248.8 1.25320 1.9150 1.991 273.7 0.828 251.1 1.47921 1.8491 2.099 276.1 1.010 255.4 1.66022 1.7651 2.208 280.7 1.159 260.9 1.83223 1.6387 2.322 271.7 1.442 261.9 2.074Power–Law FitJ = C(Da) nUnloading Compliance J Ic : 225 kJ/m 2 (11 Data)Coeff. C : 277 kJ/m 2 Exponent n : 0.19 Fit Coeff. R : 0.748DC Potential Method J Ic : 180 kJ/m 2 (9 Data)Coeff. C : 233 kJ/m 2 Exponent n : 0.22 Fit Coeff. R : 0.97251
3.02.5CF–8M (Spec. #75–03T)Aged 10,000 h at 400°C288°CLoad (kN)2.01.51.0Load–Loadline0.5DisplacementMeasuredCorrected0.00 0.5 1 1.5 2 2.5 3 3.5Displacement (mm)Figure A-3.1. Load-vs.-loadline displacement curve for specimen75–03T <strong>of</strong> thermally aged CF–8M cast SS tested at 288°CFigure A-3.2. <strong>Fracture</strong> surface <strong>of</strong> specimen 75–03T tested at 288°C52
Table A-4. Test data for specimen 75–04T <strong>of</strong> thermally aged CF–8M cast SS tested at 288°CTest Number : JR–08 Test Temp. : 288°CMaterial Type : CF–8M Cast SS Heat Number : 75Aging Temp. : 400°C Aging Time : 10,000 hIrradiation Temp. : – Fluence : –Thickness : 6.51 mm Net Thickness : 5.87 mmWidth : 11.98 mm Flow Stress : 410.0 MPaModulus E : 180 GPaInitial <strong>Crack</strong> : 7.79 mm Init. a/W : 0.65 (Measured)Final <strong>Crack</strong> : 9.89 mm Final a/W : 0.83 (Measured)Final <strong>Crack</strong> : 10.07 mm Final a/W : 0.84 (Compliance)Load Deflection Unloading Compliance DC Potential MethodNo. (kN) (mm) J (kJ/m 2 ) Da (mm) J (kJ/m 2 ) Da (mm)0 0.0436 0.0001 0.4938 0.033 0.9 -0.198 1.0 0.0002 1.9252 0.829 92.5 -0.063 99.8 0.0623 2.0155 0.978 111.2 0.062 121.8 0.1514 2.0982 1.128 131.3 0.171 142.9 0.2465 2.1654 1.279 154.1 0.238 164.1 0.3476 2.2201 1.436 179.8 0.284 185.3 0.4587 2.2704 1.592 203.9 0.348 203.5 0.5958 2.2922 1.752 222.6 0.474 220.4 0.7389 2.2904 1.911 234.5 0.648 232.7 0.90810 2.2895 2.071 240.6 0.857 245.4 1.04811 2.2695 2.230 248.0 1.027 258.4 1.17512 2.2375 2.387 254.8 1.188 269.7 1.29913 2.2228 2.544 268.4 1.278 283.7 1.39014 2.1885 2.705 265.5 1.531 295.1 1.52015 2.1151 2.866 265.4 1.694 301.9 1.65116 1.9839 3.032 255.1 1.968 304.6 1.81917 1.9150 3.192 241.8 2.176 300.8 1.97818 1.8491 3.351 242.7 2.283 299.1 2.108Power–Law FitJ = C(Da) nUnloading Compliance J Ic : 197 kJ/m 2 (10 Data)Coeff. C : 248 kJ/m 2 Exponent n : 0.20 Fit Coeff. R : 0.931DC Potential Method J Ic : 154 kJ/m 2 (10 Data)Coeff. C : 246 kJ/m 2 Exponent n : 0.39 Fit Coeff. R : 0.99753
3.02.5CF–8M (Spec. #75–04T)Aged 10,000 h at 400°C288°CLoad (kN)2.01.51.0Load–Loadline0.5DisplacementMeasuredCorrected0.00 0.5 1 1.5 2 2.5 3 3.5Displacement (mm)Figure A-4.1. Load-vs.-loadline displacement curve for specimen75–04T <strong>of</strong> thermally aged CF–8M cast SS tested at 288°CFigure A-4.2. <strong>Fracture</strong> surface <strong>of</strong> specimen 75–04T tested at 288°C54
Table A-5. Test data for specimen 75–10T <strong>of</strong> thermally aged CF–8M cast SS tested at 288°CTest Number : JR–32 Test Temp. : 288°CMaterial Type : CF–8M Cast SS Heat Number : 75Aging Temp. : 400°C Aging Time : 10,000 hIrradiation Temp. : – Fluence : –Thickness : 6.50 mm Net Thickness : 5.82 mmWidth : 12.01 mm Flow Stress : 410.0 MPaModulus E : 180 GPaInitial <strong>Crack</strong> : 6.08 mm Init. a/W : 0.51 (Measured)Final <strong>Crack</strong> : 8.75 mm Final a/W : 0.73 (Measured)Final <strong>Crack</strong> : 8.81 mm Final a/W : 0.72 (Compliance)Load Deflection Unloading Compliance DC Potential MethodNo. (kN) (mm) J (kJ/m 2 ) Da (mm) J (kJ/m 2 ) Da (mm)0 0.0885 0.0001 2.7615 0.368 58.5 -0.496 55.8 0.0382 2.9091 0.458 69.1 -0.195 73.0 0.0443 3.0341 0.550 85.9 -0.051 91.6 0.0554 3.1404 0.642 98.7 0.264 110.7 0.0625 3.2116 0.739 118.4 0.331 128.6 0.1956 3.2370 0.838 142.7 0.266 146.8 0.3097 3.2792 0.937 167.1 0.209 164.9 0.4268 3.3219 1.035 178.9 0.461 183.9 0.5149 3.3099 1.135 204.2 0.415 203.3 0.60910 3.2659 1.240 216.2 0.654 221.5 0.74711 3.2468 1.345 232.5 0.794 239.6 0.86512 3.1347 1.454 258.7 0.787 257.3 0.99913 2.9554 1.567 269.0 1.005 270.9 1.18514 2.8420 1.677 282.7 1.143 282.5 1.36315 2.7179 1.788 287.7 1.380 294.9 1.51116 2.6173 1.896 296.5 1.552 306.6 1.65617 2.4656 2.008 294.4 1.841 316.7 1.81218 2.2673 2.123 305.2 1.977 322.8 2.00019 2.1098 2.235 304.0 2.215 325.3 2.19420 1.9790 2.345 308.0 2.383 327.9 2.36721 1.8358 2.458 307.8 2.581 330.7 2.53022 1.7366 2.567 311.3 2.731 334.8 2.667Power–Law FitJ = C(Da) nUnloading Compliance J Ic : 181 kJ/m 2 (11 Data)Coeff. C : 258 kJ/m 2 Exponent n : 0.30 Fit Coeff. R : 0.914DC Potential Method J Ic : 146 kJ/m 2 (11 Data)Coeff. C : 246 kJ/m 2 Exponent n : 0.42 Fit Coeff. R : 0.98955
5.04.0Test JR-32288°CSpecimen 75-10TCF-8MHeat 75 (28% Ferrite)Aged 10,000 h at 400°CLoad (kN)3.02.01.0Measured ExtensionLoading–Pin Displacement0.00 0.5 1 1.5 2 2.5 3Displacement (mm)Figure A-5.1. Load-vs.-loadline displacement curve for specimen75–10T <strong>of</strong> thermally aged CF–8M cast SS tested at 288°CFigure A-5.2. <strong>Fracture</strong> surface <strong>of</strong> specimen 75–10T tested at 288°C56
Table A-6. Test data for specimen 184–38 <strong>of</strong> 50% cold–worked Type 316NG SS tested at 288°CTest Number : JR–12 Test Temp. : 288°CMaterial Type : 50% CW 316NG SS Heat Number : 18474Aging Temp. : – Aging Time : –Irradiation Temp. : – Fluence : –Thickness : 6.497 mm Net Thickness : 5.819 mmWidth : 12.032 mm Flow Stress : 861.0 MPaModulus E : 175 GPaInitial <strong>Crack</strong> : 7.14 mm Init. a/W : 0.59 (Measured)Final <strong>Crack</strong> : 10.30 mm Final a/W : 0.86 (Measured)Final <strong>Crack</strong> : 9.64 mm Final a/W : 0.80 (Compliance)Load Deflection Unloading Compliance DC Potential MethodNo. (kN) (mm) J (kJ/m 2 ) Da (mm) J (kJ/m 2 ) Da (mm)0 0.0445 0.0001 1.2522 0.045 2.1 0.048 2.1 0.0012 1.9296 0.093 7.8 0.055 7.9 0.0023 2.5430 0.148 17.4 0.023 17.4 0.0054 3.0577 0.208 30.1 0.184 30.2 0.0095 3.4665 0.274 45.8 0.169 48.0 0.0926 3.2041 0.389 72.5 0.522 79.8 0.5897 2.9932 0.505 93.9 0.779 99.0 1.0698 2.2784 0.658 115.2 1.169 118.1 1.7339 1.8362 0.792 121.5 1.594 121.3 2.25710 1.5115 0.919 136.3 1.903 126.9 2.72811 1.2219 1.046 113.0 2.501 134.4 3.160Power–Law FitJ = C(Da) nUnloading Compliance J Ic : 51 kJ/m 2 (5 Data)Coeff. C : 102 kJ/m 2 Exponent n : 0.46 Fit Coeff. R : 0.989DC Potential Method J Ic : 61 kJ/m 2 (5 Data)Coeff. C : 97 kJ/m 2 Exponent n : 0.30 Fit Coeff. R : 0.99557
5.04.0Test JR-12288°C50% CW 316NGLoad (kN)3.02.0Load–Loadline1.0DisplacementMeasuredAdjusted0.00 0.2 0.4 0.6 0.9 1.1 1.3 1.5Displacement (mm)Figure A-6.1. Load-vs.-loadline displacement curve for specimen 184–38<strong>of</strong> 50% cold–worked Type 316NG SS tested at 288°CFigure A-6.2. <strong>Fracture</strong> surface <strong>of</strong> specimen 184–38 tested at 288°C58
Table A-7. Test data for specimen 184–40 <strong>of</strong> 50% cold–worked Type 316NG SS tested at 288°CTest Number : JR–19 Test Temp. : 288°CMaterial Type : 50% CW 316NG SS Heat Number : 18474Aging Temp. : – Aging Time : –Irradiation Temp. : – Fluence : –Thickness : 6.528 mm Net Thickness : 5.829 mmWidth : 12.024 mm Flow Stress : 861.0 MPaModulus E : 175 GPaInitial <strong>Crack</strong> : 7.35 mm Init. a/W : 0.61 (Measured)Final <strong>Crack</strong> : 10.28 mm Final a/W : 0.86 (Measured)Final <strong>Crack</strong> : 10.01 mm Final a/W : 0.82 (Compliance)Load Deflection Unloading Compliance DC Potential MethodNo. (kN) (mm) J (kJ/m 2 ) Da (mm) J (kJ/m 2 ) Da (mm)0 0.0894 0.0001 1.2295 0.083 4.2 0.407 4.3 0.0012 1.8900 0.126 13.1 0.177 10.0 0.0043 2.5012 0.174 18.7 0.099 19.0 0.0054 3.0493 0.230 32.2 0.135 31.9 0.0095 3.4621 0.304 52.6 0.148 52.3 0.0156 3.2699 0.419 79.9 0.481 86.3 0.3737 2.6147 0.568 99.7 1.030 110.4 0.9978 2.3976 0.634 103.4 1.228 105.4 1.2299 1.9777 0.715 109.2 1.530 113.1 1.57410 1.6716 0.788 114.2 1.699 112.9 1.85011 1.5275 0.850 116.5 1.890 112.8 2.05112 1.4056 0.910 116.5 2.098 115.3 2.26113 1.2873 0.971 118.4 2.238 116.1 2.43614 1.1210 1.037 118.8 2.420 118.1 2.64215 1.0453 1.094 119.1 2.547 116.2 2.79416 0.9715 1.152 120.2 2.666 117.6 2.939Power–Law FitJ = C(Da) nUnloading Compliance J Ic : 61 kJ/m 2 (8 Data)Coeff. C : 96 kJ/m 2 Exponent n : 0.30 Fit Coeff. R : 0.993DC Potential Method J Ic : 81 kJ/m 2 (8 Data)Coeff. C : 104 kJ/m 2 Exponent n : 0.17 Fit Coeff. R : 0.98959
Load (kN)4.03.53.02.52.01.5Test JR-19Specimen 184-40288°C50% CW Type 316NG1.0Load–LoadlineDisplacement0.5MeasuredCorrected0.00 0.5 1 1.5 2Displacement (mm)Figure A-7.1. Load-vs.-loadline displacement curve for specimen 184–40<strong>of</strong> 50% cold–worked Type 316NG SS tested at 288°CFigure A-7.2. <strong>Fracture</strong> surface <strong>of</strong> specimen 184–40 tested at 288°C60
Table A-8. Test data for specimen C19–D <strong>of</strong> nonirradiated Type 304 SS tested at 288°CTest Number : JR–27 Test Temp. : 288°CMaterial Type : Type 304 SS Heat Number : C19Aging Temp. : – Aging Time : –Irradiation Temp. : – Fluence : –Thickness : 6.480 mm Net Thickness : 5.890 mmWidth : 12.000 mm Flow Stress : 339.5 MPaModulus E : 175 GPaInitial <strong>Crack</strong> : 7.28 mm Init. a/W : 0.61 (Measured)Final <strong>Crack</strong> : 7.63 mm Final a/W : 0.64 (Measured)Final <strong>Crack</strong> : 7.70 mm Final a/W : 0.64 (Compliance)Load Deflection Unloading Compliance DC Potential MethodNo. (kN) (mm) J (kJ/m 2 ) Da (mm) J (kJ/m 2 ) Da (mm)0 0.089 0.0001 1.214 0.247 21.8 -0.001 21.8 0.0162 1.279 0.342 31.5 -0.027 31.2 0.0233 1.346 0.435 40.3 0.056 40.9 0.0304 1.407 0.582 56.5 0.070 57.0 0.0425 1.515 0.774 80.0 0.033 79.3 0.0596 1.607 0.969 102.8 0.087 103.2 0.0767 1.674 1.166 125.6 0.181 128.6 0.0928 1.790 1.562 183.4 0.172 182.4 0.1359 1.852 1.761 210.0 0.232 210.9 0.15510 1.931 1.956 247.1 0.134 239.4 0.18211 2.025 2.355 300.5 0.254 301.1 0.22112 2.153 2.852 392.9 0.152 381.1 0.28913 2.221 3.150 433.5 0.253 432.1 0.31914 2.294 3.449 464.5 0.434 485.7 0.34215 2.439 4.045 587.5 0.418 590.0 0.43316 2.536 4.524 673.8 0.51917 2.617 5.046 765.5 0.62518 2.670 5.550 834.9 0.811Power–Law FitJ = C(Da) nUnloading Compliance J Ic : 695 kJ/m 2 (9 Data)Coeff. C : 765 kJ/m 2 Exponent n : 0.28 Fit Coeff. R : 0.338DC Potential Method (information could not be determined)61
Load (kN)3.02.52.01.51.0Test JR-27288°CSpecimen C19–DNonirradiated0.5Measured ExtensionLoading–Pin Displacement0.00 1 2 3 4 5 6Displacement (mm)Figure A-8.1. Load-vs.-loadline displacement curve for specimen C19–D<strong>of</strong> nonirradiated Type 304 SS tested at 288°CFigure A-8.2. <strong>Fracture</strong> surface <strong>of</strong> specimen C19–D tested at 288°C62
Table A-9. Test data for specimen C16–C <strong>of</strong> nonirradiated Type 316 SS tested at 288°CTest Number : JR–31 Test Temp. : 288°CMaterial Type : Type 316 SS Heat Number : C16Aging Temp. : – Aging Time : –Irradiation Temp. : – Fluence : –Thickness : 6.500 mm Net Thickness : 5.810 mmWidth : 11.990 mm Flow Stress : 336.0 MPa (estimated)Modulus E : 175 GPaInitial <strong>Crack</strong> : 7.30 mm Init. a/W : 0.61 (Measured)Final <strong>Crack</strong> : 7.96 mm Final a/W : 0.66 (Measured)Final <strong>Crack</strong> : 7.65 mm Final a/W : 0.64 (Compliance)Load Deflection Unloading Compliance DC Potential MethodNo. (kN) (mm) J (kJ/m 2 ) Da (mm) J (kJ/m 2 ) Da (mm)0 0.065 0.000 0.0 0.0001 1.207 0.208 18.9 -0.002 19.0 0.0142 1.293 0.412 40.2 -0.064 39.5 0.0303 1.370 0.618 60.7 0.023 61.5 0.0454 1.426 0.826 82.5 0.103 84.7 0.0615 1.492 1.023 108.6 0.041 107.8 0.0816 1.555 1.220 129.2 0.146 132.0 0.0967 1.620 1.417 152.1 0.219 157.0 0.1138 1.674 1.615 178.7 0.236 182.9 0.1339 1.784 2.012 251.4 0.077 236.3 0.18710 1.831 2.211 278.6 0.095 264.8 0.20711 1.877 2.410 310.1 0.082 293.7 0.23112 1.925 2.609 338.6 0.112 323.6 0.25213 1.977 2.808 373.7 0.081 353.6 0.27814 2.023 3.007 413.8 0.015 384.0 0.30815 2.060 3.207 439.0 0.083 416.3 0.32716 2.100 3.407 469.7 0.108 448.6 0.34917 2.140 3.607 503.6 0.114 481.1 0.37518 2.180 3.807 520.0 0.243 515.9 0.38719 2.219 4.007 555.5 0.249 549.1 0.41320 2.259 4.207 601.8 0.197 581.4 0.44821 2.298 4.406 632.6 0.239 616.3 0.47122 2.330 4.607 646.5 0.371 654.1 0.48123 2.359 4.808 689.0 0.356 688.2 0.513Power–Law FitJ = C(Da) n(information could not be determined)63
Load (kN)3.02.52.01.51.0Test JR-31288°CSpecimen C16–CNonirradiated0.5Measured ExtensionLoading–Pin Displacement0.00 1 2 3 4 5 6Displacement (mm)Figure A-9.1. Load-vs.-loadline displacement curve for specimen C16–C<strong>of</strong> nonirradiated Type 316 SS tested at 288°CFigure A-9.2. <strong>Fracture</strong> surface <strong>of</strong> specimen C16–C tested at 288°C64
Table A-10. Test data for specimen C16–D <strong>of</strong> nonirradiated Type 316 SS tested at 288°CTest Number : JR–28 Test Temp. : 288°CMaterial Type : Type 316 SS Heat Number : C16Aging Temp. : – Aging Time : –Irradiation Temp. : – Fluence : –Thickness : 6.470 mm Net Thickness : 5.90 mmWidth : 11.980 mm Flow Stress : 336.0 MPa (estimated)Modulus E : 175 GPaInitial <strong>Crack</strong> : 7.41 mm Init. a/W : 0.62 (Measured)Final <strong>Crack</strong> : 7.83 mm Final a/W : 0.65 (Measured)Final <strong>Crack</strong> : 7.60 mm Final a/W : 0.63 (Compliance)Load Deflection Unloading Compliance DC Potential MethodNo. (kN) (mm) J (kJ/m 2 ) Da (mm) J (kJ/m 2 ) Da (mm)0 0.088 0.000 0.0 0.0001 1.218 0.247 22.5 0.059 23.0 0.0172 1.304 0.441 43.5 0.007 42.9 0.0323 1.373 0.637 63.8 0.072 64.1 0.0474 1.439 0.834 85.4 0.129 86.5 0.0645 1.501 1.031 109.2 0.140 109.9 0.0816 1.567 1.228 138.6 0.026 134.1 0.1037 1.621 1.426 170.1 -0.096 159.3 0.1278 1.672 1.625 192.1 -0.014 185.7 0.1439 1.725 1.823 204.8 0.230 213.3 0.15210 1.772 2.023 230.1 0.287 241.3 0.17111 1.818 2.222 260.1 0.295 269.7 0.19412 1.865 2.421 310.7 0.068 297.6 0.23113 1.908 2.621 332.8 0.169 327.7 0.24814 1.949 2.820 368.4 0.134 357.8 0.27415 1.982 3.020 400.4 0.141 388.8 0.29816 2.019 3.221 428.9 0.182 420.6 0.31917 2.055 3.420 467.3 0.148 452.3 0.34818 2.088 3.621 495.4 0.195 484.8 0.369Power–Law FitJ = C(Da) n(information could not be determined)65
Load (kN)3.02.52.01.51.0Test JR-28288°CSpecimen C16–DNonirradiated0.5Measured ExtensionLoading–Pin Displacement0.00 1 2 3 4 5 6Displacement (mm)Figure A-10.1.Load-vs.-loadline displacement curve for specimenC16–D <strong>of</strong> nonirradiated Type 316 SS tested at 288°CFigure A-10.2. <strong>Fracture</strong> surface <strong>of</strong> specimen C16–D tested at 288°C66
Table A-11. Test data for specimen L20–D <strong>of</strong> nonirradiated Type 304 SS tested at 288°CTest Number : JR–29 Test Temp. : 288°CMaterial Type : Type 304L SS (HP) Heat Number : L20Aging Temp. : – Aging Time : –Irradiation Temp. : – Fluence : –Thickness : 6.50 mm Net Thickness : 5.89 mmWidth : 12.00 mm Flow Stress : 307.0 MPa (estimated)Modulus E : 175 GPaInitial <strong>Crack</strong> : 7.22 mm Init. a/W : 0.60 (Measured)Final <strong>Crack</strong> : 9.52 mm Final a/W : 0.79 (Measured)Final <strong>Crack</strong> : 8.84 mm Final a/W : 0.74 (Compliance)Load Deflection Unloading Compliance DC Potential MethodNo. (kN) (mm) J (kJ/m 2 ) Da (mm) J (kJ/m 2 ) Da (mm)0 0.0000 0.0001 1.2384 0.028 3.3 -0.704 3.4 0.0032 1.4995 0.103 8.4 -0.481 11.4 0.0073 1.6414 0.190 17.4 -0.170 22.1 0.0144 1.7179 0.285 28.9 0.082 33.0 0.0245 1.8211 0.581 78.1 0.072 74.0 0.1436 1.8264 0.682 88.5 0.184 86.6 0.2327 1.8069 0.786 102.8 0.204 98.4 0.3668 1.7975 0.888 117.5 0.209 110.0 0.4739 1.7949 0.991 125.9 0.397 121.8 0.57610 1.7917 1.092 138.0 0.460 134.0 0.65911 1.7704 1.196 153.0 0.473 146.4 0.74812 1.7468 1.300 169.2 0.460 158.1 0.84313 1.7148 1.405 175.8 0.635 169.6 0.94014 1.6761 1.510 192.7 0.600 180.3 1.04415 1.6365 1.615 203.1 0.686 190.0 1.15316 1.5991 1.720 212.3 0.774 199.3 1.26317 1.5627 1.825 224.8 0.808 208.5 1.36318 1.5440 1.929 225.6 0.999 217.8 1.45519 1.5088 2.033 240.6 0.990 227.2 1.54420 1.4684 2.139 243.0 1.150 235.9 1.64121 1.4354 2.244 253.0 1.200 243.8 1.73722 1.4021 2.349 266.8 1.211 252.5 1.81523 1.3652 2.454 272.8 1.306 260.8 1.90224 1.3260 2.559 283.3 1.344 267.3 2.00025 1.2886 2.665 293.3 1.386 272.9 2.09826 1.2517 2.770 289.9 1.550 278.1 2.19427 1.2104 2.876 294.9 1.626 281.8 2.302Power–Law FitJ = C(Da) nUnloading Compliance J Ic : 119 kJ/m 2 (19 Data)Coeff. C : 236 kJ/m 2 Exponent n : 0.56 Fit Coeff. R : 0.948DC Potential Method J Ic : 78 kJ/m 2 (21 Data)Coeff. C : 174 kJ/m 2 Exponent n : 0.60 Fit Coeff. R : 0.99867
2.52.0Test JR-29288°CSpecimen L20–DNonirradiatedLoad (kN)1.51.00.5Measured ExtensionLoading–Pin Displacement0.00 0.5 1 1.5 2 2.5 3 3.5 4Displacement (mm)Figure A-11.1.Load-vs.-loadline displacement curve for specimenL20–D <strong>of</strong> nonirradiated Type 304 SS tested at 288°CFigure A-11.2. <strong>Fracture</strong> surface <strong>of</strong> specimen L20–D tested at 288°C68
Table A-12. Test data for specimen L2–C <strong>of</strong> nonirradiated Type 304 SS tested at 288°CTest Number : JR–20 Test Temp. : 288°CMaterial Type : Type 304 SS Heat Number : L2Aging Temp. : – Aging Time : –Irradiation Temp. : – Fluence : –Thickness : 6.51 mm Net Thickness : 5.84 mmWidth : 11.98 mm Flow Stress : 270.5 MPaModulus E : 175 GPaInitial <strong>Crack</strong> : 7.38 mm Init. a/W : 0.61 (Measured)Final <strong>Crack</strong> : 9.17 mm Final a/W : 0.76 (Measured)Final <strong>Crack</strong> : 8.08 mm Final a/W : 0.75 (Compliance)Load Deflection Unloading Compliance DC Potential MethodNo. (kN) (mm) J (kJ/m 2 ) Da (mm) J (kJ/m 2 ) Da (mm)0 0.089 0.0001 1.300 0.080 6.5 0.237 6.5 0.0062 1.453 0.169 18.9 0.152 17.1 0.0163 1.529 0.265 30.2 0.155 29.3 0.0284 1.596 0.361 43.7 0.126 41.9 0.0405 1.648 0.459 58.7 0.041 55.2 0.0546 1.685 0.556 72.5 0.015 68.9 0.0677 1.717 0.656 87.4 0.027 83.2 0.0808 1.741 0.756 101.7 0.040 97.7 0.0939 1.754 0.857 117.1 0.027 112.4 0.10710 1.769 0.958 130.1 0.082 127.1 0.11911 1.774 1.059 144.7 0.101 142.1 0.13212 1.780 1.160 159.9 0.104 157.0 0.14613 1.775 1.275 176.7 0.120 171.1 0.23414 1.759 1.379 191.6 0.136 181.6 0.33915 1.734 1.482 203.5 0.200 192.3 0.43216 1.708 1.586 214.2 0.277 201.9 0.54217 1.692 1.688 227.3 0.310 211.0 0.65118 1.666 1.793 238.6 0.372 220.9 0.74719 1.619 1.898 243.2 0.518 230.0 0.85020 1.580 2.001 252.5 0.593 237.2 0.97321 1.544 2.105 260.8 0.676 244.9 1.07522 1.504 2.209 265.5 0.798 253.0 1.17323 1.461 2.315 275.3 0.859 259.4 1.28924 1.411 2.470 283.6 1.006 270.8 1.42925 1.353 2.627 292.9 1.132 280.0 1.57726 1.280 2.785 299.8 1.271 286.5 1.74127 1.219 2.942 304.8 1.417 292.3 1.893Power–Law FitJ = C(Da) nUnloading Compliance J Ic : 237 kJ/m 2 (13 Data)Coeff. C : 283 kJ/m 2 Exponent n : 0.20 Fit Coeff. R : 0.988DC Potential Method J Ic : 186 kJ/m 2 (15 Data)Coeff. C : 243 kJ/m 2 Exponent n : 0.27 Fit Coeff. R : 0.99669
3.02.5Test JR-20288°CSpecimen L2-CNonirradiatedLoad (kN)2.01.51.00.5Measured ExtensionLoading–Pin Displacement0.00 0.5 1 1.5 2 2.5 3 3.5 4Displacement (mm)Figure A-12.1.Load-vs.-loadline displacement curve for specimen L2–C<strong>of</strong> nonirradiated Type 304 SS tested at 288°CFigure A-12.2. <strong>Fracture</strong> surface <strong>of</strong> specimen L2–C tested at 288°C70
Table A-13. Test data for specimen L2–E <strong>of</strong> nonirradiated Type 304 SS tested at 288°CTest Number : JR–30 Test Temp. : 288°CMaterial Type : Type 304 SS Heat Number : L2Aging Temp. : – Aging Time : –Irradiation Temp. : – Fluence : –Thickness : 6.49 mm Net Thickness : 5.87 mmWidth : 12.03 mm Flow Stress : 270.5 MPaModulus E : 175 GPaInitial <strong>Crack</strong> : 7.38 mm Init. a/W : 0.61 (Measured)Final <strong>Crack</strong> : 9.17 mm Final a/W : 0.76 (Measured)Final <strong>Crack</strong> : 8.08 mm Final a/W : 0.75 (Compliance)Load Deflection Unloading Compliance DC Potential MethodNo. (kN) (mm) J (kJ/m 2 ) Da (mm) J (kJ/m 2 ) Da (mm)0 0.0885 0.0001 1.1441 0.052 4.2 0.027 4.2 0.0042 1.2273 0.144 13.0 0.049 13.1 0.0123 1.3033 0.238 23.0 -0.020 22.6 0.0214 1.3669 0.334 32.8 0.057 32.9 0.0305 1.4225 0.430 44.4 -0.014 43.7 0.0416 1.4741 0.527 55.9 -0.022 55.0 0.0527 1.5226 0.624 65.5 0.102 66.7 0.0618 1.5627 0.722 78.0 0.088 78.8 0.0729 1.6022 0.820 88.5 0.185 91.2 0.08210 1.6347 0.918 99.6 0.261 102.2 0.17311 1.6534 1.019 116.8 0.150 114.1 0.21812 1.6743 1.118 123.1 0.371 126.3 0.26613 1.6908 1.219 142.0 0.244 138.8 0.31214 1.7019 1.320 147.3 0.468 151.2 0.36215 1.7095 1.421 159.3 0.523 163.8 0.41116 1.7166 1.522 175.1 0.512 176.2 0.46317 1.7192 1.630 185.8 0.619 189.7 0.51218 1.7143 1.732 203.4 0.584 201.9 0.56819 1.6899 1.835 211.2 0.715 213.6 0.63320 1.6690 1.938 228.6 0.688 224.1 0.70921 1.6561 2.041 255.8 0.535 235.1 0.77122 1.6458 2.143 242.8 0.899 246.1 0.83523 1.6276 2.246 263.8 0.819 256.8 0.89924 1.6009 2.350 277.7 0.848 266.7 0.97125 1.5867 2.453 284.1 0.949 276.6 1.03726 1.5529 2.557 307.0 0.874 285.8 1.11327 1.5280 2.661 305.2 1.049 294.6 1.18528 1.4928 2.765 318.5 1.064 302.9 1.26129 1.4599 2.870 314.4 1.244 310.9 1.33530 1.4265 2.975 322.2 1.307 316.6 1.41231 1.3963 3.080 335.2 1.329 325.3 1.48932 1.3705 3.184 341.3 1.406 332.3 1.55933 1.3300 3.289 334.7 1.579 339.7 1.62734 1.2771 3.396 340.4 1.649 345.0 1.71035 1.2371 3.501 348.0 1.706 349.1 1.792Power–Law FitJ = C(Da) nUnloading Compliance J Ic : 154 kJ/m 2 (25 Data)Coeff. C : 275 kJ/m 2 Exponent n : 0.54 Fit Coeff. R : 0.866DC Potential Method J Ic : 159 kJ/m 2 (19 Data)Coeff. C : 268 kJ/m 2 Exponent n : 0.49 Fit Coeff. R : 0.99771
2.52.0Test JR-30288°CSpecimen L2-ENonirradiatedLoad (kN)1.51.00.5Measured ExtensionLoading–Pin Displacement0.00 0.5 1 1.5 2 2.5 3 3.5 4Displacement (mm)Figure A-13.1.Load-vs.-loadline displacement curve for specimen L2–E<strong>of</strong> nonirradiated Type 304 SS tested at 288°CFigure A-13.2. <strong>Fracture</strong> surface <strong>of</strong> specimen L2–E tested at 288°C72
Table A-14. Test data for specimen C19–A <strong>of</strong> irradiated Type 304 SS tested at 288°CTest Number : JRI–21 Test Temp. : 288°CMaterial Type : Type 304 SS Heat Number : C19Aging Temp. : – Aging Time : –Irradiation Temp. : 288°C Fluence : 0.3 x 10 21 n/cm 2Thickness : 6.50 mm Net Thickness : 5.85 mmWidth : 12.00 mm Flow Stress : 618.0 MPaModulus E : 175 GPa Effective Flow Stress : 478.8 MPaInitial <strong>Crack</strong> : 7.45 mm Init. a/W : 0.62 (Measured)Final <strong>Crack</strong> : 8.84 mm Final a/W : 0.74 (Measured)Final <strong>Crack</strong> : 8.32 mm Final a/W : 0.69 (Compliance)Load Deflection Unloading Compliance DC Potential MethodNo. (kN) (mm) J (kJ/m 2 ) Da (mm) J (kJ/m 2 ) Da (mm)0 0.088 0.0001 2.618 1.094 204.8 0.000 204.3 0.1072 2.637 1.194 226.8 0.000 226.0 0.1183 2.658 1.295 249.3 0.000 248.1 0.1304 2.673 1.395 271.4 0.000 270.1 0.1405 2.687 1.497 294.4 0.000 292.7 0.1536 2.702 1.597 316.8 0.000 314.9 0.1647 2.701 1.699 339.5 0.000 337.1 0.1798 2.706 1.802 356.2 0.068 360.2 0.1889 2.705 1.902 372.4 0.132 382.8 0.19610 2.708 2.004 405.3 0.044 405.0 0.21311 2.705 2.104 427.5 0.050 430.1 0.22712 2.698 2.207 438.3 0.152 453.5 0.23213 2.680 2.310 461.9 0.149 475.0 0.25114 2.666 2.414 486.0 0.147 487.4 0.33615 2.645 2.516 507.6 0.158 499.7 0.41516 2.613 2.619 522.2 0.215 510.7 0.50217 2.589 2.723 545.4 0.215 521.8 0.58718 2.562 2.827 566.4 0.227 531.2 0.68119 2.526 2.931 585.2 0.252 544.1 0.74820 2.460 3.037 570.7 0.467 555.4 0.82921 2.425 3.143 580.0 0.541 565.2 0.91322 2.395 3.246 587.8 0.623 575.7 0.98723 2.354 3.351 608.1 0.639 586.4 1.06224 2.332 3.454 637.1 0.607 595.9 1.13825 2.267 3.561 633.3 0.741 604.7 1.22026 2.218 3.666 652.0 0.757 611.3 1.30727 2.166 3.771 649.6 0.874 617.3 1.393Power–Law FitJ = C(Da) nUnloading Compliance J Ic : 599 kJ/m 2 (15 Data)Coeff. C : 661 kJ/m 2 Exponent n : 0..15 Fit Coeff. R : 0.834DC Potential Method J Ic : 507 kJ/m 2 (17 Data)Coeff. C : 579 kJ/m 2 Exponent n : 0.17 Fit Coeff. R : 0.97573
4.03.53.0Test JRI-21288°CSpecimen C19–A0.3 x 10 21 n cm –2Load (kN)2.52.01.51.00.5Measured ExtensionLoading–Pin Displacement0.00 0.5 1 1.5 2 2.5 3 3.5 4Displacement (mm)Figure A-14.1Load-vs.-loadline displacement curve for specimenC19–A <strong>of</strong> irradiated Type 304 SS tested at 288°CFigure A-14.2 <strong>Fracture</strong> surface <strong>of</strong> specimen C19–A tested at 288°C74
Table A-15. Test data for specimen C19–B <strong>of</strong> irradiated Type 304 SS tested at 288°CTest Number : JRI–23 Test Temp. : 288°CMaterial Type : Type 304 SS Heat Number : C19Aging Temp. : – Aging Time : –Irradiation Temp. : 288°C Fluence : 0.9 x 10 21 n/cm 2Thickness : 6.50 mm Net Thickness : 5.85 mmWidth : 12.00 mm Flow Stress : 759.5 MPaModulus E : 175 GPa Effective Flow Stress : 549.5 MPaInitial <strong>Crack</strong> : 7.36 mm Init. a/W : 0.61 (Measured)Final <strong>Crack</strong> : 9.40 mm Final a/W : 0.78 (Measured)Final <strong>Crack</strong> : 9.01 mm Final a/W : 0.75 (Compliance)Load Deflection Unloading Compliance DC Potential MethodNo. (kN) (mm) J (kJ/m 2 ) Da (mm) J (kJ/m 2 ) Da (mm)0 0.088 0.0001 1.971 0.125 9.7 -0.014 9.8 0.0042 2.630 0.176 19.2 -0.376 19.1 0.0073 3.185 0.236 26.7 -0.041 33.1 0.0104 3.544 0.311 52.4 0.055 53.7 0.0205 3.643 0.404 78.0 0.081 80.5 0.0306 3.636 0.519 110.5 0.159 114.3 0.0437 3.589 0.624 142.0 0.119 144.7 0.0558 3.527 0.729 172.2 0.155 174.6 0.0679 3.469 0.836 205.8 0.095 204.6 0.08010 3.426 0.941 233.9 0.143 233.5 0.09111 3.341 1.047 259.4 0.199 262.3 0.10112 3.266 1.153 281.3 0.294 285.4 0.21013 3.195 1.259 309.3 0.296 304.8 0.30914 3.124 1.366 335.0 0.334 324.7 0.39715 3.058 1.472 357.7 0.390 344.5 0.47916 2.959 1.581 384.2 0.405 363.8 0.56617 2.880 1.689 404.9 0.467 381.4 0.65718 2.793 1.796 416.2 0.590 397.9 0.74619 2.709 1.903 440.3 0.599 413.7 0.83220 2.647 2.009 461.1 0.640 428.7 0.91821 2.539 2.169 486.0 0.730 452.1 1.04022 2.431 2.329 508.4 0.819 471.2 1.16923 2.284 2.491 524.1 0.941 487.7 1.30124 2.184 2.649 538.6 1.048 503.1 1.41625 2.060 2.811 550.1 1.167 515.4 1.55026 1.951 2.970 552.7 1.318 522.6 1.69427 1.834 3.131 559.7 1.436 529.4 1.82328 1.743 3.290 569.4 1.534 537.1 1.93929 1.657 3.449 574.7 1.647 546.4 2.041Power–Law FitJ = C(Da) nUnloading Compliance J Ic : 368 kJ/m 2 (16 Data)Coeff. C : 513 kJ/m 2 Exponent n : 0.33 Fit Coeff. R : 0.948DC Potential Method J Ic : 313 kJ/m 2 (17 Data)Coeff. C : 442 kJ/m 2 Exponent n : 0.32 Fit Coeff. R : 0.99675
4.03.5Test JRI-23288°CLoad (kN)3.02.52.01.51.0Specimen C19–B0.9 x 10 21 n cm -20.5Measured ExtensionLoading–Pin Displacement0.00 0.5 1 1.5 2 2.5 3 3.5 4Displacement (mm)Figure A-15.1Load-vs.-loadline displacement curve for specimenC19–B <strong>of</strong> irradiated Type 304 SS tested at 288°CFigure A-15.2 <strong>Fracture</strong> surface <strong>of</strong> specimen C19–B tested at 288°C76
Table A-16. Test data for specimen C19–C <strong>of</strong> irradiated Type 304 SS tested at 288°CTest Number : JRI–33 Test Temp. : 288°CMaterial Type : Type 304 SS Heat Number : C19Aging Temp. : – Aging Time : –Irradiation Temp. : 288°C Fluence : 2.0 x 10 21 n/cm 2Thickness : 6.50 mm Net Thickness : 5.85 mmWidth : 12.00 mm Flow Stress : 794.0 MPaModulus E : 175 GPa Effective Flow Stress : 566.8 MPaInitial <strong>Crack</strong> : 7.38 mm Init. a/W : 0.61 (Measured)Final <strong>Crack</strong> : 9.20 mm Final a/W : 0.77 (Measured)Final <strong>Crack</strong> : 9.13 mm Final a/W : 0.76 (Compliance)Load Deflection Unloading Compliance DC Potential MethodNo. (kN) (mm) J (kJ/m 2 ) Da (mm) J (kJ/m 2 ) Da (mm)0 0.089 0.0001 0.621 0.040 1.1 -0.2542 0.930 0.061 2.1 -0.0113 1.251 0.082 4.3 0.0474 1.586 0.106 7.3 -0.0345 1.911 0.129 10.3 -0.0786 2.234 0.156 14.3 -0.1037 2.543 0.182 19.2 -0.3818 2.839 0.210 23.2 -0.3889 3.108 0.240 29.1 -0.25310 3.352 0.273 35.0 -0.17611 3.540 0.310 42.9 -0.09012 3.668 0.350 52.3 -0.04413 3.718 0.397 64.4 0.03814 3.691 0.449 78.8 0.00315 3.627 0.504 96.1 0.00616 3.546 0.558 110.7 0.07217 3.412 0.668 140.4 0.10218 3.232 0.781 168.7 0.16819 3.070 0.893 190.6 0.31120 2.926 1.004 212.8 0.38721 2.746 1.118 228.3 0.57522 2.569 1.232 239.9 0.76223 2.426 1.343 248.2 0.95624 2.294 1.453 256.6 1.12225 2.166 1.564 269.5 1.23026 2.073 1.672 280.5 1.35127 1.963 1.780 297.9 1.44528 1.871 1.889 306.0 1.52329 1.795 1.997 318.9 1.59930 1.700 2.105 329.9 1.68031 1.625 2.212 340.0 1.757Power–Law FitJ = C(Da) nUnloading Compliance J Ic : 188 kJ/m 2 (15 Data)Coeff. C : 268 kJ/m 2 Exponent n : 0.28 Fit Coeff. R : 0.967DC Potential Method (information could not be determined)77
5.04.0Test JR-32288°CSpecimen C19-C2 x 10 21 n cm -2Load (kN)3.02.01.0Measured ExtensionLoading–Pin Displacement0.00 0.5 1 1.5 2 2.5 3Displacement (mm)Figure A-16.1Load-vs.-loadline displacement curve for specimenC19–C <strong>of</strong> irradiated Type 304 SS tested at 288°CFigure A-16.2 <strong>Fracture</strong> surface <strong>of</strong> specimen C19–C tested at 288°C78
Table A-17. Test data for specimen C16–A <strong>of</strong> irradiated Type 316 SS tested at 288°CTest Number : JR–26 Test Temp. : 288°CMaterial Type : Type 316 SS Heat Number : C16Aging Temp. : – Aging Time : –Irradiation Temp. : 288°C Fluence : 0.9 x 10 21 n/cm 2Thickness : 6.50 mm Net Thickness : 5.85 mmWidth : 12.00 mm Flow Stress : 590.0 MPaModulus E : 175 GPa Effective Flow Stress : 463.0 MPaInitial <strong>Crack</strong> : 7.28 mm Init. a/W : 0.61 (Measured)Final <strong>Crack</strong> : 8.73 mm Final a/W : 0.73 (Measured)Final <strong>Crack</strong> : 8.36 mm Final a/W : 0.70 (Compliance)Load Deflection Unloading Compliance DC Potential MethodNo. (kN) (mm) J (kJ/m 2 ) Da (mm) J (kJ/m 2 ) Da (mm)0 0.089 0.0001 2.527 0.212 33.3 0.054 26.6 0.0152 2.702 0.275 42.4 0.066 39.8 0.0193 2.755 0.347 59.3 0.004 55.6 0.0264 2.785 0.421 74.5 0.024 72.0 0.0335 2.807 0.496 89.8 0.097 88.7 0.0396 2.810 0.572 106.4 0.099 105.4 0.0477 2.812 0.649 123.1 0.136 122.8 0.0548 2.821 0.725 141.0 0.117 139.8 0.0629 2.832 0.801 159.6 0.097 156.9 0.07010 2.818 0.880 176.6 0.126 174.5 0.07711 2.823 0.955 191.1 0.184 191.4 0.08412 2.821 1.031 207.2 0.202 208.3 0.09113 2.800 1.136 230.7 0.217 230.0 0.13914 2.805 1.236 255.9 0.189 249.9 0.18315 2.784 1.338 279.1 0.198 269.6 0.23416 2.785 1.441 294.0 0.310 289.0 0.29017 2.770 1.544 313.2 0.356 307.9 0.34618 2.745 1.647 343.0 0.293 327.1 0.39719 2.720 1.751 354.0 0.430 345.8 0.45620 2.693 1.853 378.8 0.410 363.3 0.51521 2.655 1.957 402.9 0.413 380.8 0.57622 2.619 2.063 414.2 0.521 398.1 0.63823 2.573 2.169 430.2 0.580 414.7 0.70324 2.539 2.273 455.9 0.561 430.3 0.76725 2.512 2.378 479.9 0.561 445.4 0.83426 2.480 2.482 498.3 0.595 461.4 0.88827 2.444 2.588 513.3 0.648 477.9 0.94128 2.393 2.693 512.5 0.796 493.9 0.99429 2.351 2.797 532.4 0.807 506.3 1.05130 2.292 2.904 550.9 0.836 521.0 1.11131 2.230 3.010 560.4 0.911 532.4 1.18832 2.180 3.117 568.0 0.989 543.1 1.26033 2.128 3.223 584.6 1.016 554.5 1.32534 2.081 3.328 596.2 1.068 565.4 1.39035 2.040 3.429 613.3 1.086 575.4 1.453Power–Law FitJ = C(Da) nUnloading Compliance J Ic : 353 kJ/m 2 (12 Data)Coeff. C : 607 kJ/m 2 Exponent n : 0.52 Fit Coeff. R : 0.848DC Potential Method J Ic : 299 kJ/m 2 (14 Data)Coeff. C : 490 kJ/m 2 Exponent n : 0.45 Fit Coeff. R : 0.99779
4.03.53.0Test JRI-26288°CSpecimen C16–A0.9 x 10 21 n cm -2Load (kN)2.52.01.51.00.5Measured ExtensionLoading–Pin Displacement0.00 0.5 1 1.5 2 2.5 3 3.5 4Displacement (mm)Figure A-17.1Load-vs.-loadline displacement curve for specimenC16–A <strong>of</strong> irradiated Type 316 SS tested at 288°CFigure A-17.2 <strong>Fracture</strong> surface <strong>of</strong> specimen C16–A tested at 288°C80
Table A-18. Test data for specimen L20–A <strong>of</strong> irradiated Type 304 SS tested at 288°CTest Number : JR–22 Test Temp. : 288°CMaterial Type : Type 304 SS Heat Number : L20Aging Temp. : – Aging Time : –Irradiation Temp. : 288°C Fluence : 0.3 x 10 21 n/cm 2Thickness : 6.50 mm Net Thickness : 5.85 mmWidth : 2.00 mm Flow Stress : 270.5 MPaModulus E : 175 GPaInitial <strong>Crack</strong> : 7.38 mm Init. a/W : 0.61 (Measured)Final <strong>Crack</strong> : 9.17 mm Final a/W : 0.76 (Measured)Final <strong>Crack</strong> : 8.08 mm Final a/W : 0.75 (Compliance)Load Deflection Unloading Compliance DC Potential MethodNo. (kN) (mm) J (kJ/m 2 ) Da (mm) J (kJ/m 2 ) Da (mm)0 0.089 0.0001 1.300 0.080 6.5 0.237 6.5 0.0062 1.453 0.169 18.9 0.152 17.1 0.0163 1.529 0.265 30.2 0.155 29.3 0.0284 1.596 0.361 43.7 0.126 41.9 0.0405 1.648 0.459 58.7 0.041 55.2 0.0546 1.685 0.556 72.5 0.015 68.9 0.0677 1.717 0.656 87.4 0.027 83.2 0.0808 1.741 0.756 101.7 0.040 97.7 0.0939 1.754 0.857 117.1 0.027 112.4 0.10710 1.769 0.958 130.1 0.082 127.1 0.11911 1.774 1.059 144.7 0.101 142.1 0.13212 1.780 1.160 159.9 0.104 157.0 0.14613 1.775 1.275 176.7 0.120 171.1 0.23414 1.759 1.379 191.6 0.136 181.6 0.33915 1.734 1.482 203.5 0.200 192.3 0.43216 1.708 1.586 214.2 0.277 201.9 0.54217 1.692 1.688 227.3 0.310 211.0 0.65118 1.666 1.793 238.6 0.372 220.9 0.74719 1.619 1.898 243.2 0.518 230.0 0.85020 1.580 2.001 252.5 0.593 237.2 0.97321 1.544 2.105 260.8 0.676 244.9 1.07522 1.504 2.209 265.5 0.798 253.0 1.17323 1.461 2.315 275.3 0.859 259.4 1.28924 1.411 2.470 283.6 1.006 270.8 1.42925 1.353 2.627 292.9 1.132 280.0 1.57726 1.280 2.785 299.8 1.271 286.5 1.74127 1.219 2.942 304.8 1.417 292.3 1.893Power–Law FitJ = C(Da) nUnloading Compliance J Ic : 237 kJ/m 2 (13 Data)Coeff. C : 283 kJ/m 2 Exponent n : 0.20 Fit Coeff. R : 0.988DC Potential Method J Ic : 186 kJ/m 2 (15 Data)Coeff. C : 243 kJ/m 2 Exponent n : 0.27 Fit Coeff. R : 0.99681
3.02.5Test JR-20288°CSpecimen L2-CNonirradiatedLoad (kN)2.01.51.00.5Measured ExtensionLoading–Pin Displacement0.00 0.5 1 1.5 2 2.5 3 3.5 4Displacement (mm)Figure A-18.1.Load-vs.-loadline displacement curve for specimenL20–A <strong>of</strong> irradiated Type 304 SS tested at 288°CFigure A-18.2. <strong>Fracture</strong> surface <strong>of</strong> specimen L20–A tested at 288°C82
Table A-19. Test data for specimen L20–B <strong>of</strong> irradiated Type 304 SS tested at 288°CTest Number : JR–24 Test Temp. : 288°CMaterial Type : Type 304 SS Heat Number : L20Aging Temp. : – Aging Time : –Irradiation Temp. : 288°C Fluence : 0.9 x 10 21 n/cm 2Thickness : 6.51 mm Net Thickness : 5.84 mmWidth : 11.98 mm Flow Stress : 270.5 MPaModulus E : 175 GPaInitial <strong>Crack</strong> : 7.38 mm Init. a/W : 0.61 (Measured)Final <strong>Crack</strong> : 9.17 mm Final a/W : 0.76 (Measured)Final <strong>Crack</strong> : 8.08 mm Final a/W : 0.75 (Compliance)Load Deflection Unloading Compliance DC Potential MethodNo. (kN) (mm) J (kJ/m 2 ) Da (mm) J (kJ/m 2 ) Da (mm)0 0.089 0.0001 1.300 0.080 6.5 0.237 6.5 0.0062 1.453 0.169 18.9 0.152 17.1 0.0163 1.529 0.265 30.2 0.155 29.3 0.0284 1.596 0.361 43.7 0.126 41.9 0.0405 1.648 0.459 58.7 0.041 55.2 0.0546 1.685 0.556 72.5 0.015 68.9 0.0677 1.717 0.656 87.4 0.027 83.2 0.0808 1.741 0.756 101.7 0.040 97.7 0.0939 1.754 0.857 117.1 0.027 112.4 0.10710 1.769 0.958 130.1 0.082 127.1 0.11911 1.774 1.059 144.7 0.101 142.1 0.13212 1.780 1.160 159.9 0.104 157.0 0.14613 1.775 1.275 176.7 0.120 171.1 0.23414 1.759 1.379 191.6 0.136 181.6 0.33915 1.734 1.482 203.5 0.200 192.3 0.43216 1.708 1.586 214.2 0.277 201.9 0.54217 1.692 1.688 227.3 0.310 211.0 0.65118 1.666 1.793 238.6 0.372 220.9 0.74719 1.619 1.898 243.2 0.518 230.0 0.85020 1.580 2.001 252.5 0.593 237.2 0.97321 1.544 2.105 260.8 0.676 244.9 1.07522 1.504 2.209 265.5 0.798 253.0 1.17323 1.461 2.315 275.3 0.859 259.4 1.28924 1.411 2.470 283.6 1.006 270.8 1.42925 1.353 2.627 292.9 1.132 280.0 1.57726 1.280 2.785 299.8 1.271 286.5 1.74127 1.219 2.942 304.8 1.417 292.3 1.893Power–Law FitJ = C(Da) nUnloading Compliance J Ic : 237 kJ/m 2 (13 Data)Coeff. C : 283 kJ/m 2 Exponent n : 0.20 Fit Coeff. R : 0.988DC Potential Method J Ic : 186 kJ/m 2 (15 Data)Coeff. C : 243 kJ/m 2 Exponent n : 0.27 Fit Coeff. R : 0.99683
3.02.5Test JR-20288°CSpecimen L2-CNonirradiatedLoad (kN)2.01.51.00.5Measured ExtensionLoading–Pin Displacement0.00 0.5 1 1.5 2 2.5 3 3.5 4Displacement (mm)Figure A-19.1.Load-vs.-loadline displacement curve for specimenL20–B <strong>of</strong> irradiated Type 304 SS tested at 288°CFigure A-19.2. <strong>Fracture</strong> surface <strong>of</strong> specimen L20–B tested at 288°C84
Table A-20. Test data for specimen L2–A <strong>of</strong> irradiated Type 304 SS tested at 288°CTest Number : JR–25 Test Temp. : 288°CMaterial Type : Type 304 SS Heat Number : L2Aging Temp. : – Aging Time : –Irradiation Temp. : 288°C Fluence : 0.9 x 10 21 n/cm 2Thickness : 6.51 mm Net Thickness : 5.84 mmWidth : 11.98 mm Flow Stress : 270.5 MPaModulus E : 175 GPaInitial <strong>Crack</strong> : 7.38 mm Init. a/W : 0.61 (Measured)Final <strong>Crack</strong> : 9.17 mm Final a/W : 0.76 (Measured)Final <strong>Crack</strong> : 8.08 mm Final a/W : 0.75 (Compliance)Load Deflection Unloading Compliance DC Potential MethodNo. (kN) (mm) J (kJ/m 2 ) Da (mm) J (kJ/m 2 ) Da (mm)0 0.089 0.0001 1.300 0.080 6.5 0.237 6.5 0.0062 1.453 0.169 18.9 0.152 17.1 0.0163 1.529 0.265 30.2 0.155 29.3 0.0284 1.596 0.361 43.7 0.126 41.9 0.0405 1.648 0.459 58.7 0.041 55.2 0.0546 1.685 0.556 72.5 0.015 68.9 0.0677 1.717 0.656 87.4 0.027 83.2 0.0808 1.741 0.756 101.7 0.040 97.7 0.0939 1.754 0.857 117.1 0.027 112.4 0.10710 1.769 0.958 130.1 0.082 127.1 0.11911 1.774 1.059 144.7 0.101 142.1 0.13212 1.780 1.160 159.9 0.104 157.0 0.14613 1.775 1.275 176.7 0.120 171.1 0.23414 1.759 1.379 191.6 0.136 181.6 0.33915 1.734 1.482 203.5 0.200 192.3 0.43216 1.708 1.586 214.2 0.277 201.9 0.54217 1.692 1.688 227.3 0.310 211.0 0.65118 1.666 1.793 238.6 0.372 220.9 0.74719 1.619 1.898 243.2 0.518 230.0 0.85020 1.580 2.001 252.5 0.593 237.2 0.97321 1.544 2.105 260.8 0.676 244.9 1.07522 1.504 2.209 265.5 0.798 253.0 1.17323 1.461 2.315 275.3 0.859 259.4 1.28924 1.411 2.470 283.6 1.006 270.8 1.42925 1.353 2.627 292.9 1.132 280.0 1.57726 1.280 2.785 299.8 1.271 286.5 1.74127 1.219 2.942 304.8 1.417 292.3 1.893Power–Law FitJ = C(Da) nUnloading Compliance J Ic : 237 kJ/m 2 (13 Data)Coeff. C : 283 kJ/m 2 Exponent n : 0.20 Fit Coeff. R : 0.988DC Potential Method J Ic : 186 kJ/m 2 (15 Data)Coeff. C : 243 kJ/m 2 Exponent n : 0.27 Fit Coeff. R : 0.99685
3.02.5Test JR-20288°CSpecimen L2-CNonirradiatedLoad (kN)2.01.51.00.5Measured ExtensionLoading–Pin Displacement0.00 0.5 1 1.5 2 2.5 3 3.5 4Displacement (mm)Figure A-20.1.Load-vs.-loadline displacement curve for specimen L2–A<strong>of</strong> irradiated Type 304 SS tested at 288°CFigure A-20.2. <strong>Fracture</strong> surface <strong>of</strong> specimen L2–A tested at 288°C86
NRC FORM 335(2–89)NRCM 1102,3201, 3202BIBLIOGRAPHIC DATA SHEET(See instructions on the reverse)2. TITLE AND SUBTITLE<strong>Fracture</strong> <strong>Toughness</strong> <strong>and</strong> <strong>Crack</strong> <strong>Growth</strong> <strong>Rates</strong> <strong>of</strong> <strong>Irradiated</strong><strong>Austenitic</strong> Stainless SteelsU. S. NUCLEAR REGULATORY COMMISSION1. REPORT NUMBER(Assigned by NRC. Add Vol., Supp., Rev.,<strong>and</strong> Addendum Numbers, if any.)NUREG/CR–6826ANL–03/223. DATE REPORT PUBLISHEDMONTHYEARAugust 20034. FIN OR GRANT NUMBERY63885. AUTHOR(S) 6. TYPE OF REPORTO. K. Chopra, E. E. Gruber, <strong>and</strong> W. J. ShackTechnical7. PERIOD COVERED (Inclusive Dates)8. PERFORMING ORGANIZATION – NAME AND ADDRESS (If NRC, provide Division, Office or Region, U.S. Nuclear Regulatory Commission, <strong>and</strong> mailing address; ifcontractor, provide name <strong>and</strong> mailing address.)Argonne National Laboratory9700 South Cass AvenueArgonne, IL 604399. SPONSORING ORGANIZATION – NAME AND ADDRESS (If NRC, type “Same as above”: if contractor, provide NRC Division, Office or Region, U.S. NuclearRegulatory Commission, <strong>and</strong> mailing address.)Division <strong>of</strong> Engineering TechnologyOffice <strong>of</strong> Nuclear Regulatory ResearchU.S. Nuclear Regulatory CommissionWashington, DC 20555–000110. SUPPLEMENTARY NOTESWilliam H. Cullen, Jr., <strong>and</strong> Carol E. Moyer, NRC Project Managers11. ABSTRACT (200 words or less)<strong>Austenitic</strong> stainless steels (SSs) are used extensively as structural alloys in the internal components <strong>of</strong> reactor pressurevessels because <strong>of</strong> their superior fracture toughness properties. However, exposure to high levels <strong>of</strong> neutron irradiation forextended periods leads to significant reduction in the fracture resistance <strong>of</strong> these steels. Experimental data are presented onfracture toughness <strong>and</strong> crack growth rates (CGRs) <strong>of</strong> austenitic SSs irradiated to fluence levels up to 2.0 x 10 21 n/cm 2 (E > 1MeV) (ª3.0 dpa) at ª288°C. <strong>Crack</strong> growth tests were conducted under cycling loading <strong>and</strong> long hold time trapezoidal loadingin simulated boiling water reactor (BWR) environments, <strong>and</strong> fracture toughness tests were conducted in air. Neutronirradiation at 288°C decreases the fracture toughness <strong>of</strong> the steels; the data from commercial heats fall within the scatterb<strong>and</strong> for the data obtained at higher temperatures. In addition, the results indicate significant enhancement <strong>of</strong> CGRs <strong>of</strong> theirradiated steels in normal water chemistry BWR environment; the CGRs for irradiated steels are a factor <strong>of</strong> ª5 higher thanthe disposition curve proposed for sensitized austenitic SSs. The rates decreased by more than an order <strong>of</strong> magnitude inlow–dissolved–oxygen BWR environment.12. KEY WORDS/DESCRIPTORS (List words or phrases that will assist researchers in locating this report.)<strong>Fracture</strong> <strong>Toughness</strong>J–R Curve<strong>Crack</strong> <strong>Growth</strong> RateNeutron IrradiationBWR EnvironmentDissolved Oxygen<strong>Austenitic</strong> Stainless Steels13. AVAILABILITY STATEMENTUnlimited14. SECURITY CLASSIFICATION(This Page)Unclassified(This Report)Unclassified15. NUMBER OF PAGES16.ICE PRNRC FORM 335 (2–89)