Standard deviation notes - Biology for Life
Standard deviation notes - Biology for Life
Standard deviation notes - Biology for Life

Create successful ePaper yourself
Turn your PDF publications into a flip-book with our unique Google optimized e-Paper software.
<strong>Standard</strong> Deviation!
Let's say we randomly select 9 men and 9 women andask their GPAs and get these data:MEN WOMEN0.90 1.502.00 3.001.40 3.002.00 2.503.00 3.002.00 3.003.00 4.004.00 3.003.70 2.00MEAN GPA FOR:2.44MEN: _____WOMEN:______ 2.78Can we conclude that the average GPAof ALL women at Skyline ishigher than the average of ALL men?
<strong>Standard</strong> Deviation• The standard <strong>deviation</strong> is a measurethe degree each data point in the set ofdata points varies (or deviates) fromthe mean• The wider the spread of scores, thelarger the standard <strong>deviation</strong>.
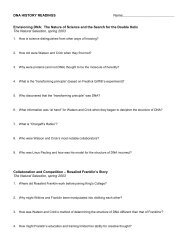
<strong>Standard</strong> Deviation• For data that has a normal distribution,68% of the data lies within onestandard <strong>deviation</strong> of the mean.One SD
How to calculate the standard <strong>deviation</strong>:1. Calculate the mean (M) of a set of dataMEAN GPA FOR:2.44MEN: _____WOMEN:______ 2.78
How to calculate the standard <strong>deviation</strong>:2. Subtract the meanfrom each point ofdata to determine(X-M)MENWOMEN-1.54 -1.28-0.44 0.22-1.04 0.22-0.44 -0.280.56 0.22-0.44 0.220.56 1.221.56 0.221.26 -0.780.90 – 2.44 = 1.50 – 2.78 =2.00 – 2.44 = 3.00 – 2.78 =1.40 – 2.44 = 3.00 – 2.78 =2.00 – 2.44 = 2.50 – 2.78 =3.00 – 2.44 = 3.00 – 2.78 =2.00 – 2.44 = 3.00 – 2.78 =3.00 – 2.44 = 4.00 – 2.78 =4.00 – 2.44 = 3.00 – 2.78 =3.70 – 2.44 = 2.00 – 2.78 =
How to calculate the standard <strong>deviation</strong>:3. Square each of the resulting numbers todetermine (X-M) 2 MENWOMEN(-1.54) 2 = 2.37 (-1.28) 2 = 1.64(-0.44) 2 = 0.19 (0.22) 2 = 0.05(-1.04) 2 = 1.08 (0.22) 2 = 0.05(-0.44) 2 = 0.19 (-0.28) 2 = 0.08(0.56) 2 = 0.31 (0.22) 2 = 0.05(-0.44) 2 = 0.19 (0.22) 2 = 0.05(0.56) 2 = 0.31 (1.22) 2 = 1.49(1.56) 2 = 2.43 (0.22) 2 = 0.05(1.26) 2 = 1.59 (-0.78) 2 = 0.61
How to calculate the standard <strong>deviation</strong>:4. Add the values from the previous steptogether to get ∑(X-M) 2 MEN WOMEN2.37 1.640.19 0.051.08 0.050.19 0.080.31 0.050.19 0.050.31 1.492.43 0.051.59 0.618.68 4.06
How to calculate the standard <strong>deviation</strong>:5. Calculate (n-1) by subtracting 1 fromyour sample size. Your sample size isthe total number of data points youcollected.N-1 <strong>for</strong> men = 9-1 = 8N-1 <strong>for</strong> women = 9-1 = 8
How to calculate the standard <strong>deviation</strong>:6. Divide the answer from ∑(X-M) 2 by theanswer from (n-1) to find ∑(X-M) 2Men8.68 / 8 =n-11.09Women4.06 / 8 =0.51
How to calculate the standard <strong>deviation</strong>:7. Calculate the square root of yourprevious answer to determine thestandard <strong>deviation</strong>Men√1.09 =Women√0.51 =1.040.71
This means that…• In men, 68% of all students sampled have aGPA that falls within 1.04 grade points of themean.– MEAN PLUS 1.04 = 3.49– MEAN MINUS 1.04 = 1.40• In women, 68% of all students sampled have aGPA that falls within 0.71 grade points of themean.– MEAN PLUS 0.71 = 3.49– MEAN MINUS 0.71 = 2.0768% of men havea GPA betweenthese values68% of women havea GPA betweenthese values
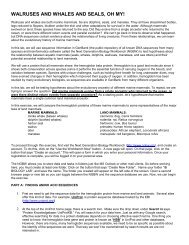
GPASo, are women smarter?Graph results to find out:Mean GPA of Men and Women at Skyline4.003.503.002.502.001.501.000.500.00MEN+ / - 1 SDMEAN GPAGenderWOMEN
GPASo, are women smarter?Graph results Since to find the SD out: bars overlap,we conclude that theGPA’s are probablyNOT significantly different,and that the difference inthe means is most likelydue to chance in thesampling population.4.003.503.002.502.001.501.000.500.00Mean GPA of Men and Women at SkylineMENGenderWOMEN
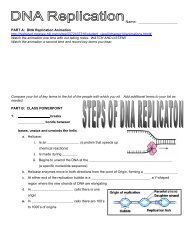
Since the SD bars DO NOT overlap, we concludethat the populations are probably significantlydifferent, and that the difference in the means ismost likely due to something MORE THANCHANCE.
Using Tools toCalculate <strong>Standard</strong> Deviation• Excel 2003• TI-83• Excel 2007 (doc)• TI-nspire (external link)
PRACTICEPROBLEMS