Simulation of creping pattern in tissue paper - Innventia.com
Simulation of creping pattern in tissue paper - Innventia.com
Simulation of creping pattern in tissue paper - Innventia.com

Create successful ePaper yourself
Turn your PDF publications into a flip-book with our unique Google optimized e-Paper software.
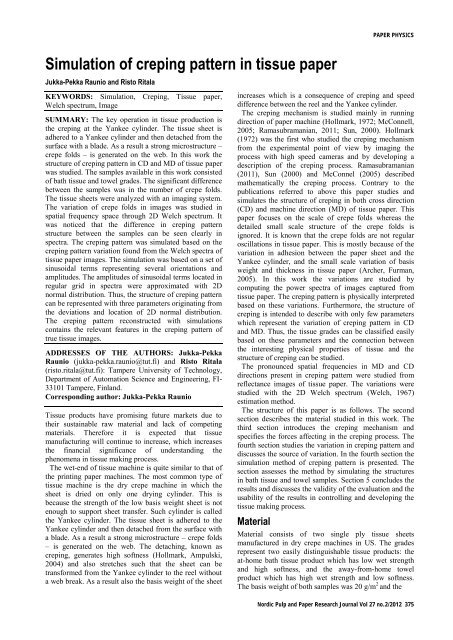
PAPER PHYSICS<strong>Simulation</strong> <strong>of</strong> <strong>crep<strong>in</strong>g</strong> <strong>pattern</strong> <strong>in</strong> <strong>tissue</strong> <strong>paper</strong>Jukka-Pekka Raunio and Risto RitalaKEYWORDS: <strong>Simulation</strong>, Crep<strong>in</strong>g, Tissue <strong>paper</strong>,Welch spectrum, ImageSUMMARY: The key operation <strong>in</strong> <strong>tissue</strong> production isthe <strong>crep<strong>in</strong>g</strong> at the Yankee cyl<strong>in</strong>der. The <strong>tissue</strong> sheet isadhered to a Yankee cyl<strong>in</strong>der and then detached from thesurface with a blade. As a result a strong microstructure –crepe folds – is generated on the web. In this work thestructure <strong>of</strong> <strong>crep<strong>in</strong>g</strong> <strong>pattern</strong> <strong>in</strong> CD and MD <strong>of</strong> <strong>tissue</strong> <strong>paper</strong>was studied. The samples available <strong>in</strong> this work consisted<strong>of</strong> bath <strong>tissue</strong> and towel grades. The significant differencebetween the samples was <strong>in</strong> the number <strong>of</strong> crepe folds.The <strong>tissue</strong> sheets were analyzed with an imag<strong>in</strong>g system.The variation <strong>of</strong> crepe folds <strong>in</strong> images was studied <strong>in</strong>spatial frequency space through 2D Welch spectrum. Itwas noticed that the difference <strong>in</strong> <strong>crep<strong>in</strong>g</strong> <strong>pattern</strong>structure between the samples can be seen clearly <strong>in</strong>spectra. The <strong>crep<strong>in</strong>g</strong> <strong>pattern</strong> was simulated based on the<strong>crep<strong>in</strong>g</strong> <strong>pattern</strong> variation found from the Welch spectra <strong>of</strong><strong>tissue</strong> <strong>paper</strong> images. The simulation was based on a set <strong>of</strong>s<strong>in</strong>usoidal terms represent<strong>in</strong>g several orientations andamplitudes. The amplitudes <strong>of</strong> s<strong>in</strong>usoidal terms located <strong>in</strong>regular grid <strong>in</strong> spectra were approximated with 2Dnormal distribution. Thus, the structure <strong>of</strong> <strong>crep<strong>in</strong>g</strong> <strong>pattern</strong>can be represented with three parameters orig<strong>in</strong>at<strong>in</strong>g fromthe deviations and location <strong>of</strong> 2D normal distribution.The <strong>crep<strong>in</strong>g</strong> <strong>pattern</strong> reconstructed with simulationsconta<strong>in</strong>s the relevant features <strong>in</strong> the <strong>crep<strong>in</strong>g</strong> <strong>pattern</strong> <strong>of</strong>true <strong>tissue</strong> images.ADDRESSES OF THE AUTHORS: Jukka-PekkaRaunio (jukka-pekka.raunio@tut.fi) and Risto Ritala(risto.ritala@tut.fi): Tampere University <strong>of</strong> Technology,Department <strong>of</strong> Automation Science and Eng<strong>in</strong>eer<strong>in</strong>g, FI-33101 Tampere, F<strong>in</strong>land.Correspond<strong>in</strong>g author: Jukka-Pekka RaunioTissue products have promis<strong>in</strong>g future markets due totheir susta<strong>in</strong>able raw material and lack <strong>of</strong> <strong>com</strong>pet<strong>in</strong>gmaterials. Therefore it is expected that <strong>tissue</strong>manufactur<strong>in</strong>g will cont<strong>in</strong>ue to <strong>in</strong>crease, which <strong>in</strong>creasesthe f<strong>in</strong>ancial significance <strong>of</strong> understand<strong>in</strong>g thephenomena <strong>in</strong> <strong>tissue</strong> mak<strong>in</strong>g process.The wet-end <strong>of</strong> <strong>tissue</strong> mach<strong>in</strong>e is quite similar to that <strong>of</strong>the pr<strong>in</strong>t<strong>in</strong>g <strong>paper</strong> mach<strong>in</strong>es. The most <strong>com</strong>mon type <strong>of</strong><strong>tissue</strong> mach<strong>in</strong>e is the dry crepe mach<strong>in</strong>e <strong>in</strong> which thesheet is dried on only one dry<strong>in</strong>g cyl<strong>in</strong>der. This isbecause the strength <strong>of</strong> the low basis weight sheet is notenough to support sheet transfer. Such cyl<strong>in</strong>der is calledthe Yankee cyl<strong>in</strong>der. The <strong>tissue</strong> sheet is adhered to theYankee cyl<strong>in</strong>der and then detached from the surface witha blade. As a result a strong microstructure – crepe folds– is generated on the web. The detach<strong>in</strong>g, known as<strong>crep<strong>in</strong>g</strong>, generates high s<strong>of</strong>tness (Hollmark, Ampulski,2004) and also stretches such that the sheet can betransformed from the Yankee cyl<strong>in</strong>der to the reel withouta web break. As a result also the basis weight <strong>of</strong> the sheet<strong>in</strong>creases which is a consequence <strong>of</strong> <strong>crep<strong>in</strong>g</strong> and speeddifference between the reel and the Yankee cyl<strong>in</strong>der.The <strong>crep<strong>in</strong>g</strong> mechanism is studied ma<strong>in</strong>ly <strong>in</strong> runn<strong>in</strong>gdirection <strong>of</strong> <strong>paper</strong> mach<strong>in</strong>e (Hollmark, 1972; McConnell,2005; Ramasubramanian, 2011; Sun, 2000). Hollmark(1972) was the first who studied the <strong>crep<strong>in</strong>g</strong> mechanismfrom the experimental po<strong>in</strong>t <strong>of</strong> view by imag<strong>in</strong>g theprocess with high speed cameras and by develop<strong>in</strong>g adescription <strong>of</strong> the <strong>crep<strong>in</strong>g</strong> process. Ramasubramanian(2011), Sun (2000) and McConnel (2005) describedmathematically the <strong>crep<strong>in</strong>g</strong> process. Contrary to thepublications referred to above this <strong>paper</strong> studies andsimulates the structure <strong>of</strong> <strong>crep<strong>in</strong>g</strong> <strong>in</strong> both cross direction(CD) and mach<strong>in</strong>e direction (MD) <strong>of</strong> <strong>tissue</strong> <strong>paper</strong>. This<strong>paper</strong> focuses on the scale <strong>of</strong> crepe folds whereas thedetailed small scale structure <strong>of</strong> the crepe folds isignored. It is known that the crepe folds are not regularoscillations <strong>in</strong> <strong>tissue</strong> <strong>paper</strong>. This is mostly because <strong>of</strong> thevariation <strong>in</strong> adhesion between the <strong>paper</strong> sheet and theYankee cyl<strong>in</strong>der, and the small scale variation <strong>of</strong> basisweight and thickness <strong>in</strong> <strong>tissue</strong> <strong>paper</strong> (Archer, Furman,2005). In this work the variations are studied by<strong>com</strong>put<strong>in</strong>g the power spectra <strong>of</strong> images captured from<strong>tissue</strong> <strong>paper</strong>. The <strong>crep<strong>in</strong>g</strong> <strong>pattern</strong> is physically <strong>in</strong>terpretedbased on these variations. Furthermore, the structure <strong>of</strong><strong>crep<strong>in</strong>g</strong> is <strong>in</strong>tended to describe with only few parameterswhich represent the variation <strong>of</strong> <strong>crep<strong>in</strong>g</strong> <strong>pattern</strong> <strong>in</strong> CDand MD. Thus, the <strong>tissue</strong> grades can be classified easilybased on these parameters and the connection betweenthe <strong>in</strong>terest<strong>in</strong>g physical properties <strong>of</strong> <strong>tissue</strong> and thestructure <strong>of</strong> <strong>crep<strong>in</strong>g</strong> can be studied.The pronounced spatial frequencies <strong>in</strong> MD and CDdirections present <strong>in</strong> <strong>crep<strong>in</strong>g</strong> <strong>pattern</strong> were studied fromreflectance images <strong>of</strong> <strong>tissue</strong> <strong>paper</strong>. The variations werestudied with the 2D Welch spectrum (Welch, 1967)estimation method.The structure <strong>of</strong> this <strong>paper</strong> is as follows. The secondsection describes the material studied <strong>in</strong> this work. Thethird section <strong>in</strong>troduces the <strong>crep<strong>in</strong>g</strong> mechanism andspecifies the forces affect<strong>in</strong>g <strong>in</strong> the <strong>crep<strong>in</strong>g</strong> process. Thefourth section studies the variation <strong>in</strong> <strong>crep<strong>in</strong>g</strong> <strong>pattern</strong> anddiscusses the source <strong>of</strong> variation. In the fourth section thesimulation method <strong>of</strong> <strong>crep<strong>in</strong>g</strong> <strong>pattern</strong> is presented. Thesection assesses the method by simulat<strong>in</strong>g the structures<strong>in</strong> bath <strong>tissue</strong> and towel samples. Section 5 concludes theresults and discusses the validity <strong>of</strong> the evaluation and theusability <strong>of</strong> the results <strong>in</strong> controll<strong>in</strong>g and develop<strong>in</strong>g the<strong>tissue</strong> mak<strong>in</strong>g process.MaterialMaterial consists <strong>of</strong> two s<strong>in</strong>gle ply <strong>tissue</strong> sheetsmanufactured <strong>in</strong> dry crepe mach<strong>in</strong>es <strong>in</strong> US. The gradesrepresent two easily dist<strong>in</strong>guishable <strong>tissue</strong> products: theat-home bath <strong>tissue</strong> product which has low wet strengthand high s<strong>of</strong>tness, and the away-from-home towelproduct which has high wet strength and low s<strong>of</strong>tness.The basis weight <strong>of</strong> both samples was 20 g/m 2 and theNordic Pulp and Paper Research Journal Vol 27 no.2/2012 375
PAPER PHYSICSFig 3. The propagation <strong>of</strong> <strong>crep<strong>in</strong>g</strong>.The Propagation <strong>of</strong> Crep<strong>in</strong>gThe form<strong>in</strong>g mechanism <strong>of</strong> crepe folds is the follow<strong>in</strong>g(Ramasubramanian, 2011; Hollmark, 1972). The <strong>tissue</strong>sheet starts to buckle when the sheet hits the blade. Thebuckl<strong>in</strong>g is the consequence <strong>of</strong> that the force whichpresses the sheet aga<strong>in</strong>st the blade over<strong>com</strong>es theadhesion which crossl<strong>in</strong>k the sheet and the Yankeecyl<strong>in</strong>der. The buckl<strong>in</strong>g cont<strong>in</strong>ues until the sheet collapses<strong>com</strong>pletely and forms the crepe fold. At this po<strong>in</strong>t theformed crepe fold moves over because <strong>of</strong> the pull<strong>in</strong>gforce <strong>of</strong> the mach<strong>in</strong>e reel and as a result the adhered sheetbeh<strong>in</strong>d the crepe fold moves towards blade. The adheredsheet starts to buckle and the entire cycle is repeated andas a result a <strong>crep<strong>in</strong>g</strong> <strong>pattern</strong> to the sheet is generated (seeFig.3).The adhesion, the angle between the surface <strong>of</strong> the bladeand the Yankee cyl<strong>in</strong>der, and the structure <strong>of</strong> the sheet(e.g. thickness, basis weight) determ<strong>in</strong>es the crack po<strong>in</strong>t(see Fig. 3, bottom right) <strong>in</strong> <strong>crep<strong>in</strong>g</strong> process. The crackpo<strong>in</strong>t is rather same <strong>in</strong> CD and MD but it can varyslightly as a function <strong>of</strong> time and <strong>in</strong> CD when theadhesion and the structure <strong>of</strong> the sheet vary <strong>in</strong> MD andCD.The basis weight, the <strong>crep<strong>in</strong>g</strong> ratio, and the anglebetween the Yankee cyl<strong>in</strong>der and the top surface <strong>of</strong> theblade were identical for bath <strong>tissue</strong> and towel samples.However, the properties such as s<strong>of</strong>tness and wet strengthdiffer between the samples. The differences are due to theadhesion difference and the other differences such as theproperties <strong>of</strong> fibers and the moisture <strong>of</strong> the sheet <strong>in</strong><strong>crep<strong>in</strong>g</strong> process. The differences <strong>of</strong> <strong>crep<strong>in</strong>g</strong> <strong>pattern</strong>sbetween the samples are studied <strong>in</strong> next chapter to detecthow the vary<strong>in</strong>g variables <strong>in</strong> <strong>tissue</strong> mak<strong>in</strong>g process affectto structure <strong>of</strong> <strong>crep<strong>in</strong>g</strong> <strong>pattern</strong>.Variation <strong>of</strong> <strong>crep<strong>in</strong>g</strong> <strong>pattern</strong> <strong>in</strong> <strong>tissue</strong> samplesThe variation <strong>of</strong> the length and the width <strong>of</strong> the crepefolds and the distance <strong>of</strong> the crepe folds can be studiedthrough wave numbers. Wave describes <strong>in</strong> this work theamount <strong>of</strong> crepe folds <strong>in</strong> mm, <strong>in</strong> units 1/mm. The wavenumber variation <strong>in</strong> CD and MD <strong>of</strong> <strong>tissue</strong> images wereanalyzed with 2D power spectrum (Lim, 1990). The 2Dpower spectrum describes the squared amplitude <strong>of</strong> eachs<strong>in</strong>usoidal with a wave number and orientation found <strong>in</strong>the image and hence the spectrum provides thedistribution <strong>of</strong> variance over wave numbers andorientations. Power spectrum is the absolute value <strong>of</strong>Fourier transform squared. The spectrum was <strong>com</strong>putedwith the Welch method, which attenuates the effect <strong>of</strong>measurement noise by calculat<strong>in</strong>g the spectrum as anaverage over several, possibly overlapp<strong>in</strong>g spectrumsamples (Welch, 1967). Each Fourier transform wasw<strong>in</strong>dowed with the Hamm<strong>in</strong>g w<strong>in</strong>dow (Lim, 1990)before the <strong>com</strong>putation <strong>of</strong> Welch spectrum. W<strong>in</strong>dow<strong>in</strong>gdecreases the spectral side lobes <strong>in</strong> the f<strong>in</strong>ite-sampleFourier transform. The Welch spectrum is symmetricalwith respect to both CD and MD direction axes.Therefore, the high variations orig<strong>in</strong>at<strong>in</strong>g from <strong>crep<strong>in</strong>g</strong>structure <strong>in</strong> spectra repeat themselves twice.The spectra <strong>of</strong> <strong>tissue</strong> sheets were <strong>com</strong>puted from 10images sampled over entire mach<strong>in</strong>e width <strong>of</strong> the web.The general behavior <strong>of</strong> <strong>crep<strong>in</strong>g</strong> <strong>pattern</strong> was found byaverag<strong>in</strong>g the spectra. Fig.4 shows averaged Welchspectra <strong>com</strong>puted from the bath <strong>tissue</strong> and towel sheets.The <strong>in</strong>tensities <strong>of</strong> Welch spectra are normalized to thevariance <strong>of</strong> <strong>tissue</strong> image which means that the sum <strong>of</strong>spectral values equals the variance <strong>of</strong> image pixelsvalues. The variables k CD and k MD describes the wavenumbers (=number <strong>of</strong> crepe folds <strong>in</strong> mm) respectively <strong>in</strong>CD and MD.It can be seen that the <strong>in</strong>tensity <strong>of</strong> Welch spectraconcentrate on certa<strong>in</strong> locations. The centers <strong>of</strong> high<strong>in</strong>tensity areas are due to the average <strong>crep<strong>in</strong>g</strong> <strong>pattern</strong> <strong>in</strong>the <strong>tissue</strong> samples whereas the spread <strong>of</strong> the areas is dueto the variation <strong>in</strong> the <strong>crep<strong>in</strong>g</strong> <strong>pattern</strong>. The width <strong>of</strong> thehigh <strong>in</strong>tensity area <strong>in</strong> k MD direction describes thevariation <strong>of</strong> crepe fold width <strong>in</strong> MD. The width <strong>of</strong> thehigh <strong>in</strong>tensity area <strong>in</strong> k CD describes the orientationvariation <strong>of</strong> crepe folds <strong>in</strong> <strong>tissue</strong> sheet.In bath <strong>tissue</strong> (Fig. 4, top) most <strong>of</strong> the variation isbetween the wave numbers 1 and 5 1/mm <strong>in</strong> k MDdirection correspond<strong>in</strong>g wavelengths 1 mm and 0.2 mm.The wave number <strong>of</strong> highest squared amplitude <strong>in</strong> MDwas 2.6 1/mm correspond<strong>in</strong>g to wavelength <strong>of</strong> 0.38 mm.On the contrary, the towel spectrum (Fig. 4, bottom)spreads widely to wave numbers between the 2 and 91/mm <strong>in</strong> k MD direction correspond<strong>in</strong>g wavelengths 0.5mm and 0.11 mm. The maximum number <strong>of</strong> crepe folds<strong>in</strong> MD was 4.7 crepe folds per mm correspond<strong>in</strong>g towavelength <strong>of</strong> 0.21 mm. In the towel spectrum (Fig.4,bottom) the high <strong>in</strong>tensity area is wider <strong>in</strong> k CD direction.However, the wide variation exist at large wave numbers<strong>in</strong> k MD direction. Therefore, the variation <strong>in</strong> theorientation <strong>of</strong> crepe folds is rather similar <strong>in</strong> both the<strong>tissue</strong> grades as can be seen more clearly when thespectra are transformed <strong>in</strong>to polar coord<strong>in</strong>ates (see Fig.5). In this representation wavenumbers are pairs <strong>of</strong> angleϕ and distance k from the orig<strong>in</strong>.The ma<strong>in</strong> difference between the samples was thevariation <strong>in</strong> the number <strong>of</strong> crepe folds which is probablydue to changes <strong>in</strong> adhesion between the sheet and theYankee cyl<strong>in</strong>der. The higher number <strong>of</strong> crepe folds <strong>in</strong>the towel can be seen clearly <strong>in</strong> the polar spectra as amore stretched high <strong>in</strong>tensity area <strong>in</strong> the k <strong>com</strong>pared tobath <strong>tissue</strong> grade. The squared amplitude <strong>of</strong> variation <strong>in</strong>Nordic Pulp and Paper Research Journal Vol 27 no.2/2012 377
k CD(1/mm)(rad)k CD(1/mm)PAPER PHYSICShigh <strong>in</strong>tensity area <strong>in</strong> the towel spectrum is lower by amagnitude <strong>com</strong>pared to that <strong>in</strong> bath <strong>tissue</strong>. Indeed, thetotal variation <strong>in</strong> towel image was roughly one third <strong>of</strong>that <strong>in</strong> bath <strong>tissue</strong> which is partly due to the heightdifference <strong>of</strong> crepe folds between the samples.Representation <strong>of</strong> <strong>crep<strong>in</strong>g</strong> <strong>pattern</strong>In this work the structure <strong>of</strong> <strong>crep<strong>in</strong>g</strong> was illustrated with aset <strong>of</strong> s<strong>in</strong>usoidal wave fronts. In ideal <strong>crep<strong>in</strong>g</strong> process the-10-8-6-4-20246810-10 -5 0 5 10k MD(1/mm)-10-8-6-4-20246810-10 -5 0 5 10k MD(1/mm)Fig 4. Welch spectra <strong>com</strong>puted from the bath <strong>tissue</strong> (top) andtowel (bottom) images. The grey level <strong>of</strong> spectrum shows thesquared amplitude <strong>of</strong> variation. The gray-scale to squaredamplitude conversion is given on the right. High <strong>in</strong>tensity areas<strong>in</strong> spectra are due to variation caused by the <strong>crep<strong>in</strong>g</strong> <strong>pattern</strong>.012x 10 -5Fig 5. Welch spectra <strong>of</strong> bath <strong>tissue</strong> (right) and towel (left)transformed to polar coord<strong>in</strong>ate system.654321x 10 -64.53.52.51.50.5330 5 10 0 5 10k ( 1/mm)k ( 1/mm)01254321<strong>crep<strong>in</strong>g</strong> <strong>pattern</strong> would be regular wave front hav<strong>in</strong>g novariation. Such <strong>crep<strong>in</strong>g</strong> <strong>pattern</strong>, assum<strong>in</strong>g that the <strong>crep<strong>in</strong>g</strong>is a s<strong>in</strong>usoidal wave front, would produce <strong>in</strong>f<strong>in</strong>itelynarrow wave number peak pair to the power spectrum,and <strong>in</strong> the case <strong>of</strong> non-s<strong>in</strong>usoidal wave front conta<strong>in</strong>harmonics <strong>of</strong> the peaks. However, the <strong>crep<strong>in</strong>g</strong> <strong>pattern</strong> isnot regular but both the orientation and planar size <strong>of</strong>crepe folds vary. Such variations broaden the narrowspectral peaks <strong>of</strong> regular structure caus<strong>in</strong>g the wide high<strong>in</strong>tensity area to power spectrum (see Fig. 4-5).<strong>Simulation</strong> <strong>of</strong> <strong>crep<strong>in</strong>g</strong> <strong>pattern</strong>Let x denote the po<strong>in</strong>t (x MD ,y CD ) <strong>in</strong> 2D spatial space and kthe po<strong>in</strong>t (k MD ,k CD ) <strong>in</strong> 2D dimensional wave numberspace. The Fourier transform <strong>of</strong> f(x) written as F(k),describes the amplitude, orientation and phase <strong>of</strong>s<strong>in</strong>usoidal terms so that when summ<strong>in</strong>g the s<strong>in</strong>usoidsreproduces f(x). In this work the <strong>crep<strong>in</strong>g</strong> <strong>pattern</strong> wassimulated by set <strong>of</strong> s<strong>in</strong>usoidal wave fronts whoseorientation and amplitude follow the simplifiedrepresentation <strong>of</strong> the 2D Welch spectra <strong>of</strong> <strong>tissue</strong> images.The simulation <strong>in</strong> general is obta<strong>in</strong>ed as followsCrep<strong>in</strong>gPattern x,W,H,k Ni1I(ki, k0, W,H)s<strong>in</strong>(2k0ix (i))where N is the number <strong>of</strong> s<strong>in</strong>usoidal terms chosen forsimulat<strong>in</strong>g the <strong>crep<strong>in</strong>g</strong> <strong>pattern</strong> and ϕ(i) is the phasefunction <strong>of</strong> the s<strong>in</strong>usoidal term. The phase function ϕ(i) ischosen uniformly distributed <strong>in</strong> [0, 360] as this is theonly distribution lead<strong>in</strong>g to translational <strong>in</strong>variance i.e.the <strong>pattern</strong> will not depend on the choice <strong>of</strong> worldcoord<strong>in</strong>ate orig<strong>in</strong>. The k i x can be denoted with polarcoord<strong>in</strong>ates as followsk x k cos x k s<strong>in</strong>y[2]iMDwhere k is the radial wavenumber <strong>of</strong> the s<strong>in</strong>usoidal term,θ its orientation (Sonka et al. 1998)..The distribution <strong>of</strong> the <strong>in</strong>tensities <strong>of</strong> s<strong>in</strong>usoidal terms <strong>in</strong>simulated <strong>crep<strong>in</strong>g</strong> <strong>pattern</strong> is a 2D normal distributionapproximat<strong>in</strong>g the high <strong>in</strong>tensity area <strong>in</strong> Welch spectra <strong>in</strong>Cartesian coord<strong>in</strong>ates. However, the <strong>in</strong>tensity distributioncan be approximated with other distributions as well. The<strong>in</strong>tensity function is obta<strong>in</strong>ed as followsI(k , k , W , H ) i1Texp( ( ki k0)22W0 , k2 0 H k k 2WMD0MD01CD( ki k0CD 2H,and)), whereThe standard deviations W and H determ<strong>in</strong>e the width <strong>of</strong>the <strong>in</strong>tensity function <strong>in</strong> k MD and k CD directions <strong>in</strong> powerspectrum. The W describes the width variation <strong>of</strong> crepefolds <strong>in</strong> MD and H describes the wav<strong>in</strong>ess and CD length<strong>of</strong> crepe folds. The orientation and the wave number <strong>of</strong>s<strong>in</strong>usoidal terms are adjusted such that they form a regulargrid <strong>in</strong> wave number space. The regular gridsimplifies generat<strong>in</strong>g <strong>of</strong> 2D <strong>in</strong>tensity function. The center[1][3]378 Nordic Pulp and Paper Research Journal Vol 27 no.2/2012
CD / mmy (mm)CD / mmk CD(1/mm)PAPER PHYSICS<strong>of</strong> the grid is k 0 denoted as (k CD0 ,k MD0 ) where k CD0 iszero and k MD0 is the average number <strong>of</strong> crepe folds <strong>in</strong>MD. The grid dimensions are four times W and H.F<strong>in</strong>ally, the s<strong>in</strong>usoidal terms described <strong>in</strong> the regular grid<strong>in</strong> the wave number space are weighted with the 2D normaldistribution. The s<strong>in</strong>usoidal term <strong>in</strong> the middle <strong>of</strong> thegrid has the highest amplitude. The regular grid visualizedon the Welch spectrum <strong>of</strong> bath <strong>tissue</strong> and the normaldistribution <strong>of</strong> <strong>in</strong>tensity function are shown <strong>in</strong> Fig 6.The simulation results are shown <strong>in</strong> Fig 7. The centerpo<strong>in</strong>t <strong>of</strong> s<strong>in</strong>usoidal terms which describes the averagenumber <strong>of</strong> crepe folds <strong>in</strong> MD was k MD =4 1/mm. Thestandard deviation W and H were varied respectivelybetween the 0.5-4 (1/mm) and between the 0.5-1.5(1/mm).It can be seen that simulated <strong>crep<strong>in</strong>g</strong> <strong>pattern</strong>s varysignificantly when the standard deviations <strong>in</strong> simulationare varied. The length <strong>of</strong> the crepe folds <strong>in</strong> CD is longwhen the H parameter is small (Fig. 6, top, left andright). On contrary, the length <strong>of</strong> the high amplitudecrepe folds is smaller when the H parameter is large (Fig.6, bottom, left and right). The large W (Fig. 6, top andbottom, right) disturbs the regularity <strong>in</strong> <strong>crep<strong>in</strong>g</strong> <strong>pattern</strong>.The simulation enables the creation <strong>of</strong> <strong>crep<strong>in</strong>g</strong> <strong>pattern</strong>swith arbitrary parameters. Furthermore, the <strong>crep<strong>in</strong>g</strong><strong>pattern</strong> <strong>in</strong> true <strong>tissue</strong> grades can be described with onlythree parameters; the standard deviations W and H andthe average number <strong>of</strong> crepe fold k MD0 .The assessment <strong>of</strong> simulation resultsThe simulation parameters H, W and k MD0 which describethe bath <strong>tissue</strong> and towel <strong>tissue</strong> grade mostadvantageously are searched. Po<strong>in</strong>twise l<strong>in</strong>ear correlationbetween the simulated image and the orig<strong>in</strong>al <strong>tissue</strong>image is not a useful similarity measure because <strong>of</strong> thephase difference between the <strong>crep<strong>in</strong>g</strong> <strong>pattern</strong>s. Thereforethe assessment is based on the distribution <strong>of</strong> wavenumber. The approximate shape <strong>of</strong> <strong>crep<strong>in</strong>g</strong> <strong>pattern</strong> <strong>in</strong>wave number space described with 2D normaldistribution is fitted to Welch spectrum <strong>of</strong> true <strong>tissue</strong>image. The fitt<strong>in</strong>g is done <strong>in</strong> Cartesian coord<strong>in</strong>ate system.The fitt<strong>in</strong>g ignores the phase and thus the similarity <strong>of</strong><strong>crep<strong>in</strong>g</strong> <strong>pattern</strong>s is mean<strong>in</strong>gful to study. The 2D normaldistribution was <strong>com</strong>pared to averaged Welch spectra(see Fig 4). Thus the general behavior <strong>of</strong> <strong>crep<strong>in</strong>g</strong> <strong>pattern</strong>was found.The similarity <strong>of</strong> Welch spectra <strong>of</strong> simulated <strong>crep<strong>in</strong>g</strong><strong>pattern</strong> and true <strong>tissue</strong> image was evaluated withKullback-Leibler divergence which is nonl<strong>in</strong>ear measure<strong>of</strong> the difference between the two probabilitydistributions (Bishop, 2006). The range for divergence isfrom zero to <strong>in</strong>f<strong>in</strong>ity where zero is the divergence forsame distributions. The equation <strong>of</strong> Kullback-Leiblerdivergence is shown <strong>in</strong> Eq 4:KLP(i)( P || Q) P(i) ln[4]i Q(i)where P and Q are the probability distributions whosedivergence is <strong>com</strong>puted. The Welch spectrum is not aprobability distribution but the spectrum values can benormalized <strong>in</strong> a way that the sum <strong>of</strong> the spectrum values-101-1-0.500.50.5 1 1.5 2 2.5 3 3.5 4 4.5k MD(1/mm)1-2 -1.5 -1 -0.5 0 0.5 1 1.5 2x (mm)Fig 6. The red crosses show the orientation and wave number<strong>of</strong> s<strong>in</strong>usoidal terms applied <strong>in</strong> simulation. The red crosses aredrawn on the Welch spectrum <strong>of</strong> the bath <strong>tissue</strong> and they forma regular grid (top). The figure shows a small portion <strong>of</strong> theWelch spectrum <strong>in</strong> Cartesian coord<strong>in</strong>ates. The shape <strong>of</strong> the<strong>in</strong>tensity function (bottom) determ<strong>in</strong>es the <strong>in</strong>tensity <strong>of</strong> eachs<strong>in</strong>usoidal term.-2-1012-2 0 2-2MD / mm-1012-2 0 2MD / mm2-2 0 2-2MD / mmFig 7. The simulated <strong>crep<strong>in</strong>g</strong> <strong>pattern</strong>s with various simulationparameters. Top, left: W = 0.5, H = 0.5. Top, right: W = 4, H =0.5. Bottom, left: W = 0.5, H = 1.5. Bottom, right: W = 4, H =1.5. The grey level shows the amplitude: black and white colormeans respectively low and high amplitude and grey mean zeroamplitude.is 1. Now the normalized spectrum describes theprobability <strong>of</strong> each wave number.The standard deviations W and H <strong>of</strong> the <strong>in</strong>tensityfunction and the center po<strong>in</strong>t k MD0 <strong>of</strong> regular grid wereoptimized by m<strong>in</strong>imiz<strong>in</strong>g the Kullback-Leiblerdivergence between the 2D normal distribution andWelch spectrum <strong>of</strong> orig<strong>in</strong>al <strong>tissue</strong> images. Theoptimization problem is not l<strong>in</strong>ear and the optimizationspace conta<strong>in</strong>s several local optima because <strong>of</strong> f<strong>in</strong>itenumber <strong>of</strong> s<strong>in</strong>usoidal terms. Therefore, the simulatedanneal<strong>in</strong>g method is applied which should converge toglobal optimum (Kirkpatrick et al. 1983).Fig. 7 shows the optimal 2D normal distribution and thereference Welch spectrum <strong>com</strong>puted from the image <strong>of</strong>bath <strong>tissue</strong> sample.-2-101-1012-2 0 2MD / mmNordic Pulp and Paper Research Journal Vol 27 no.2/2012 379
k CD(1/mm)CD / mmCD / mmPAPER PHYSICS-6-4-20246-5 0 5-5 0 5k MD(1/mm)Fig 8. Optimal 2D normal distribution (left) and Welch spectrum<strong>com</strong>puted from the bath <strong>tissue</strong> image (right).-2-1012-2 0 2-2 MD / mm-1012-2 0 2MD / mmFig 9. Optimal simulation <strong>of</strong> <strong>crep<strong>in</strong>g</strong> <strong>pattern</strong>s based on thevariation found from the bath <strong>tissue</strong> and towel samples.It can be seen that high <strong>in</strong>tensity areas <strong>in</strong> Welchspectrum <strong>of</strong> simulated image is not smooth. It is due tothe f<strong>in</strong>ite amount <strong>of</strong> s<strong>in</strong>usoidal terms <strong>in</strong> simulation. Fig 8shows optimal simulated <strong>crep<strong>in</strong>g</strong> <strong>pattern</strong>s and the orig<strong>in</strong>al<strong>tissue</strong> images <strong>of</strong> bath <strong>tissue</strong> and towel grades. Thesimulations reproduce sufficiently the structure <strong>of</strong>orig<strong>in</strong>al <strong>crep<strong>in</strong>g</strong> <strong>pattern</strong>s. The optimal parameters <strong>of</strong> bath<strong>tissue</strong> grade were W = 1.2, H = 0.8, and k MD0 =2.4 and W= 2.2, H = 1.2, and k MD0 =4.2 <strong>in</strong> towel grade.DiscussionAt present the structure <strong>of</strong> <strong>crep<strong>in</strong>g</strong> <strong>pattern</strong> is usuallydescribed with s<strong>in</strong>gle parameter which tells the averagenumber <strong>of</strong> crepe folds per unit length <strong>in</strong> MD (Archer atal. 2010, McConnell, 2004). However, <strong>in</strong> such methodseveral characteristics <strong>of</strong> <strong>crep<strong>in</strong>g</strong> <strong>pattern</strong> are ignored.We suggest that the <strong>crep<strong>in</strong>g</strong> <strong>pattern</strong> is bettercharacterized by k MD0 , W and H, the first be<strong>in</strong>g theaverage number <strong>of</strong> crepes and the latter two describ<strong>in</strong>gthe variability <strong>of</strong> the <strong>crep<strong>in</strong>g</strong> structure. The simulationssuggest that these three parameters adequately reproducethe features visible <strong>in</strong> orig<strong>in</strong>al <strong>crep<strong>in</strong>g</strong> <strong>pattern</strong>s.Therefore, for example <strong>in</strong> mill studies on the effectprocess conditions, the <strong>crep<strong>in</strong>g</strong> <strong>pattern</strong> structure data canefficiently be summarized with the three parameters. Thisalso serves as basis <strong>of</strong> understand<strong>in</strong>g the differences <strong>in</strong>functional properties <strong>of</strong> the <strong>tissue</strong>, result<strong>in</strong>g fromdifferences <strong>in</strong> the crepe structure. For <strong>in</strong>stance, it is-6-4-20246-2-1012-2 0 2-2MD / mm-1012-2 0 2MD / mmknown that the physical property <strong>of</strong> <strong>tissue</strong> such ass<strong>of</strong>tness is related to small scale <strong>crep<strong>in</strong>g</strong> structure and to<strong>crep<strong>in</strong>g</strong> <strong>pattern</strong> structure (Stitt, 2002). Thus, thecorrelation between the estimated parameters <strong>of</strong> <strong>crep<strong>in</strong>g</strong><strong>pattern</strong> and physical properties <strong>of</strong> <strong>tissue</strong> <strong>paper</strong> can bestudied.The optimal parameters <strong>of</strong> the simulation were studiedwith Kullback-Leibler divergence. The method isdeveloped for the estimation <strong>of</strong> divergence between theprobability distributions which can evaluate only positivevalues (larger than zero). The Welch spectrum wasconverted to probability distribution by normaliz<strong>in</strong>g thevariance to one. Kullback-Leibler distance between thespectra are studied and applied also <strong>in</strong> (Veldhuis,Klabbers 2003; Georgiou L<strong>in</strong>dqvist, 2003). It is possiblethat the Welch spectrum evaluates zero values and <strong>in</strong>such location the divergence is not determ<strong>in</strong>ed. However,the optimization was evaluated several times and theoptimum was rather same <strong>in</strong> iterations which <strong>in</strong>dicatedthat such disturbance is not relevant <strong>in</strong> this work.The divergence was <strong>com</strong>puted between the 2D normaldistribution and the averaged Welch spectrum <strong>com</strong>putedfrom the true <strong>tissue</strong> images. However, the phase<strong>in</strong>formation <strong>of</strong> <strong>crep<strong>in</strong>g</strong> <strong>pattern</strong> was ignored. Therefore,the divergence is not the absolute measure <strong>of</strong> thesimilarity between the <strong>crep<strong>in</strong>g</strong> <strong>pattern</strong>s.ConclusionThe <strong>crep<strong>in</strong>g</strong> is not a perfectly controlled process whichwould produce identical crepe folds to a regular <strong>pattern</strong>.The variations <strong>in</strong> <strong>crep<strong>in</strong>g</strong> structure are due to structurevariation <strong>in</strong> <strong>tissue</strong> sheet and due to adhesion variationsbetween the Yankee cyl<strong>in</strong>der and the sheet. The ma<strong>in</strong>difference between the samples was the variation <strong>in</strong> thenumber <strong>of</strong> crepe folds which is probably due todifference <strong>in</strong> adhesion. The difference <strong>in</strong> number <strong>of</strong> crepefolds can be seen more clearly when the spectra aretransformed <strong>in</strong>to polar coord<strong>in</strong>ates. Such representationalso reveals that the wav<strong>in</strong>ess <strong>of</strong> crepe folds and the crepelength <strong>in</strong> CD is rather same <strong>in</strong> both grades however be<strong>in</strong>gbit higher <strong>in</strong> towel grade.The structure <strong>of</strong> <strong>crep<strong>in</strong>g</strong> <strong>pattern</strong> was illustrated with aset <strong>of</strong> s<strong>in</strong>usoidal wave fronts. The distribution <strong>of</strong><strong>in</strong>tensities <strong>of</strong> s<strong>in</strong>usoidal terms was described with a 2Dnormal distribution which follows the shape <strong>of</strong> the high<strong>in</strong>tensity area <strong>in</strong> Welch spectrum caused by the <strong>crep<strong>in</strong>g</strong>.Such approximation enables the characterization <strong>of</strong> the<strong>crep<strong>in</strong>g</strong> <strong>pattern</strong> with three parameters the first be<strong>in</strong>g theaverage number <strong>of</strong> crepes and the latter two describ<strong>in</strong>gthe variability <strong>of</strong> the <strong>crep<strong>in</strong>g</strong> structure. Now, the structure<strong>of</strong> <strong>crep<strong>in</strong>g</strong> <strong>pattern</strong> can be represent<strong>in</strong>g <strong>com</strong>pactly by threenumbers and correlations between the physical properties<strong>of</strong> <strong>tissue</strong> and the structure <strong>of</strong> <strong>crep<strong>in</strong>g</strong> can be studied.The assessment <strong>of</strong> simulation results is based on thesimilarity between the 2D normal distribution and theaverage Welch spectrum <strong>com</strong>puted from <strong>tissue</strong> image.The similarity was <strong>com</strong>puted with Kullback-Leiblerdivergence. The optimal parameters <strong>of</strong> simulation weresearched and simulated <strong>crep<strong>in</strong>g</strong> <strong>pattern</strong> suggest that thesethree parameters adequately reproduce the featuresvisible <strong>in</strong> orig<strong>in</strong>al <strong>crep<strong>in</strong>g</strong> <strong>pattern</strong>s.380 Nordic Pulp and Paper Research Journal Vol 27 no.2/2012