- Page 1:
WatchGuard ® System ManagerUser Gu
- Page 4 and 5:
Installation Topics ...............
- Page 6 and 7:
Restoring a Firebox backup image ..
- Page 8 and 9:
Setting Blocked Sites .............
- Page 10 and 11:
Exporting Reports .................
- Page 12 and 13:
Configuring a Gateway .............
- Page 14 and 15:
Configuring GAV engine settings ...
- Page 16 and 17:
MSSQL-Monitor .....................
- Page 18 and 19:
xviiiWatchGuard System Manager
- Page 20 and 21:
Fireware Features and ToolsYour org
- Page 22 and 23:
WatchGuard System Manager (WSM) Use
- Page 24 and 25:
WatchGuard System Manager (WSM) Use
- Page 26 and 27:
WatchGuard System Manager (WSM) Use
- Page 28 and 29:
Installing WatchGuard System Manage
- Page 30 and 31:
Installing WatchGuard System Manage
- Page 32 and 33:
Quick Setup Wizardtion, you must ha
- Page 34 and 35:
Putting the Firebox into Operation
- Page 36 and 37:
Starting WatchGuard System ManagerT
- Page 38 and 39:
Upgrading to a New Version of Firew
- Page 40 and 41:
Installation Topics• High Availab
- Page 42 and 43:
LiveSecurity Service Broadcastslear
- Page 44 and 45:
WatchGuard Users ForumAdvanced FAQs
- Page 46 and 47:
Product Documentation• Netscape N
- Page 48 and 49:
Training and Certification30 WatchG
- Page 50 and 51:
Firebox System Manager Menus and To
- Page 52 and 53:
Seeing Basic Firebox and Network St
- Page 54 and 55:
Seeing Basic Firebox and Network St
- Page 56 and 57:
Monitoring Firebox TrafficMonitorin
- Page 58 and 59:
Clearing the ARP CacheLearning more
- Page 60 and 61:
Using the Performance Console2 From
- Page 62 and 63:
Using the Performance ConsoleWorkin
- Page 64 and 65:
Viewing Number of Connections by Po
- Page 66 and 67:
Viewing Information About Firebox S
- Page 68 and 69:
Viewing Information About Firebox S
- Page 70 and 71:
Viewing Information About Firebox S
- Page 72 and 73:
Using HostWatchWhile the top part o
- Page 74 and 75:
Using HostWatchPausing the HostWatc
- Page 76 and 77:
Working with Licenses3 Below Option
- Page 78 and 79:
Working with Licenses2 Expand Licen
- Page 80 and 81:
Setting a Friendly Name and Time Zo
- Page 82 and 83:
Changing the Firebox Passphrases10
- Page 84 and 85:
Recovering a FireboxTo manually res
- Page 86 and 87:
Recovering a Firebox68 WatchGuard S
- Page 88 and 89:
Opening a Configuration Fileto a se
- Page 90 and 91:
About Firebox Backup ImagesSaving a
- Page 92 and 93:
Working with AliasesAlias names are
- Page 94 and 95:
Using Global SettingsEnable TOS for
- Page 96 and 97:
Managing a Firebox from a Remote Lo
- Page 98 and 99:
Managing a Firebox from a Remote Lo
- Page 100 and 101:
Setting Up the Log ServerSetting Up
- Page 102 and 103:
Setting up the Firebox for a Design
- Page 104 and 105:
Setting Global Logging and Notifica
- Page 106 and 107:
Setting Global Logging and Notifica
- Page 108 and 109:
Types of Log MessagesTypes of Log M
- Page 110 and 111:
LogViewer SettingsLogViewer Setting
- Page 112 and 113:
Using LogViewerSearching in LogView
- Page 114 and 115:
Using LogViewerTo convert a log fil
- Page 116 and 117:
Changing Firebox Interface IP Addre
- Page 118 and 119:
Changing Firebox Interface IP Addre
- Page 120 and 121:
About Multiple WAN Support3 Under H
- Page 122 and 123:
About Multiple WAN SupportConfiguri
- Page 124 and 125:
Adding Secondary NetworksIf your Fi
- Page 126 and 127:
Configuring Dynamic DNSMake sure th
- Page 128 and 129:
Configuring RoutesFor more informat
- Page 130 and 131:
Configuring Related Hostsfor that I
- Page 132 and 133:
Using Dynamic NATUsing Dynamic NATD
- Page 134 and 135:
Using 1-to-1 NAT4 Click OK. Save th
- Page 136 and 137:
Using 1-to-1 NATa VPN tunnel is con
- Page 138 and 139:
Configuring Static NAT for a Policy
- Page 140 and 141:
How User Authentication Worksvent a
- Page 142 and 143:
Configuring the Firebox as an Authe
- Page 144 and 145:
Configuring the Firebox as an Authe
- Page 146 and 147:
Configuring SecurID Authentication6
- Page 148 and 149:
Configuring LDAP Authentication3 In
- Page 150 and 151:
Configuring a Policy with User Auth
- Page 152 and 153:
Configuring a Policy with User Auth
- Page 154 and 155:
Using Default Packet Handling Optio
- Page 156 and 157:
Setting Blocked Sitesconfigure the
- Page 158 and 159:
Setting Blocked SitesUsing an exter
- Page 160 and 161:
Blocking PortsBlocking PortsYou can
- Page 162 and 163:
Blocking Ports144 WatchGuard System
- Page 164 and 165: Adding Policies• Attacks that use
- Page 166 and 167: Adding Policies4 Click Add.The New
- Page 168 and 169: Configuring Policy Properties- ESP-
- Page 170 and 171: Configuring Policy Properties2 To a
- Page 172 and 173: Configuring Policy PropertiesRepeat
- Page 174 and 175: Configuring Policy PropertiesSettin
- Page 176 and 177: Setting Policy Precedence2 Traffic
- Page 178 and 179: Setting Policy Precedence160 WatchG
- Page 180 and 181: Defining RulesThe fields you use fo
- Page 182 and 183: Customizing Logging and Notificatio
- Page 184 and 185: Configuring the SMTP ProxyConfiguri
- Page 186 and 187: Configuring the SMTP Proxyand 8-bit
- Page 188 and 189: Configuring the SMTP ProxyDefining
- Page 190 and 191: Configuring the FTP Proxy2 For info
- Page 192 and 193: Configuring the HTTP ProxyConfiguri
- Page 194 and 195: Configuring the HTTP ProxyBrowsers
- Page 196 and 197: Configuring the HTTP ProxyThis rule
- Page 198 and 199: Configuring the DNS ProxyConfigurin
- Page 200 and 201: Configuring the DNS ProxyAdding a n
- Page 202 and 203: Configuring the TCP Proxy184 WatchG
- Page 204 and 205: Creating and Editing ReportsStartin
- Page 206 and 207: Setting Report Properties“yesterd
- Page 208 and 209: Exporting ReportsSetting report pro
- Page 210 and 211: Using Report FiltersExcludeTo make
- Page 212 and 213: Report Sections and Consolidated Se
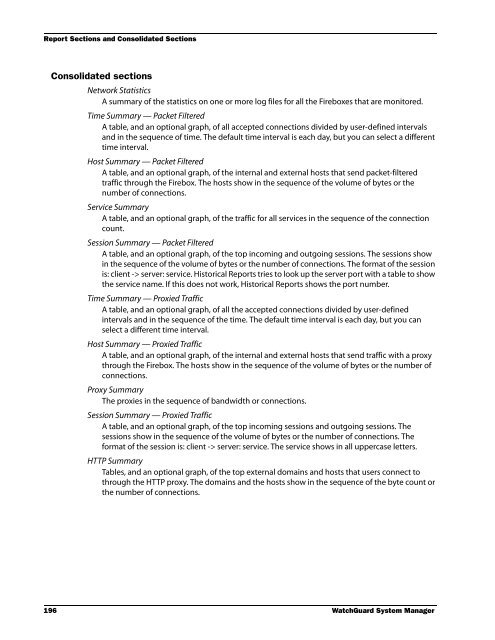
- Page 216 and 217: WatchGuard Management Server Passph
- Page 218 and 219: Changing the Management Server Conf
- Page 220 and 221: Configuring the Certificate Authori
- Page 222 and 223: Backing up or Restoring the Managem
- Page 224 and 225: Moving the WatchGuard Management Se
- Page 226 and 227: Managing Devices with the Managemen
- Page 228 and 229: Managing Devices with the Managemen
- Page 230 and 231: Managing Devices with the Managemen
- Page 232 and 233: Adding Devices to the Management Se
- Page 234 and 235: Using the Device Management Page17
- Page 236 and 237: Using the Device Management PageCon
- Page 238 and 239: Monitoring VPNsAdding a Firebox VPN
- Page 240 and 241: PKI in a WatchGuard VPNPKI in a Wat
- Page 242 and 243: Managing the Certificate Authority2
- Page 244 and 245: Tunneling ProtocolsVirtual private
- Page 246 and 247: IP Addressingsecurity of the networ
- Page 248 and 249: Network TopologyThis topology is th
- Page 250 and 251: WatchGuard VPN SolutionsSplit tunne
- Page 252 and 253: VPN Scenarios• You make tunnels b
- Page 254 and 255: VPN ScenariosSmall Company Using Ex
- Page 256 and 257: Adding VPN Resourcesapplies a VPN r
- Page 258 and 259: Making Tunnels Between Devices3 To
- Page 260 and 261: Removing Tunnels and Devices2 Expan
- Page 262 and 263: Configuring a GatewayTo configure t
- Page 264 and 265:
Making a Manual Tunnel18 When you c
- Page 266 and 267:
Making a Manual Tunnel7 From the Ty
- Page 268 and 269:
Making a Tunnel Policy2 Make the ch
- Page 270 and 271:
Setting up Outgoing Dynamic NAT thr
- Page 272 and 273:
Working with Devices on a Managemen
- Page 274 and 275:
Working with Devices on a Managemen
- Page 276 and 277:
Working with Devices on a Managemen
- Page 278 and 279:
Scheduling Firebox X Edge Firmware
- Page 280 and 281:
Using the Firebox X Edge Management
- Page 282 and 283:
Using the Firebox X Edge Management
- Page 284 and 285:
Using the Firebox SOHO 6 Management
- Page 286 and 287:
Creating and Applying Edge Configur
- Page 288 and 289:
Creating and Applying Edge Configur
- Page 290 and 291:
Creating and Applying Edge Configur
- Page 292 and 293:
Managing Firebox X Edge Network Set
- Page 294 and 295:
Using AliasesNaming aliases on the
- Page 296 and 297:
Using Aliases3 Click Aliases.The al
- Page 298 and 299:
Configuring WINS and DNS Servers•
- Page 300 and 301:
Adding New Users to the PPTP_Users
- Page 302 and 303:
Preparing the Client Computers- To:
- Page 304 and 305:
Creating and Connecting a PPTP RUVP
- Page 306 and 307:
Creating and Connecting a PPTP RUVP
- Page 308 and 309:
Getting Started with WebBlocker4 In
- Page 310 and 311:
Activating WebBlocker4 Click Next.5
- Page 312 and 313:
Configuring WebBlocker2 Select the
- Page 314 and 315:
Configuring WebBlocker3 Click the A
- Page 316 and 317:
Scheduling a WebBlocker Action298 W
- Page 318 and 319:
Installing the Software Licensespam
- Page 320 and 321:
Activating spamBlocker3 From Policy
- Page 322 and 323:
Creating Rules for Bulk and Suspect
- Page 324 and 325:
Customizing spamBlocker Using Multi
- Page 326 and 327:
Installing the Software LicensesIns
- Page 328 and 329:
Configuring Gateway AntiVirusConfig
- Page 330 and 331:
Configuring Gateway AntiVirus2 To s
- Page 332 and 333:
Activating Intrusion Prevention (IP
- Page 334 and 335:
Configuring Intrusion PreventionCon
- Page 336 and 337:
Configuring Intrusion Prevention2 S
- Page 338 and 339:
Configuring Intrusion PreventionCon
- Page 340 and 341:
Getting Intrusion Prevention Servic
- Page 342 and 343:
Creating QoS Actionsmanagement syst
- Page 344 and 345:
Dynamic RoutingDynamic RoutingA rou
- Page 346 and 347:
Using RIPSection Command Descriptio
- Page 348 and 349:
Using RIP2 In the New Policy Proper
- Page 350 and 351:
Using OSPF2 In the New Policy Prope
- Page 352 and 353:
Using OSPFSection Command Descripti
- Page 354 and 355:
Using OSPF4 Click Import to import
- Page 356 and 357:
Using BGPRegion Registry Name Web S
- Page 358 and 359:
Using BGPConfiguring Fireware Pro t
- Page 360 and 361:
Using BGP342 WatchGuard System Mana
- Page 362 and 363:
Selecting a Primary High Availabili
- Page 364 and 365:
Configuring HA for Firebox X (non e
- Page 366 and 367:
Upgrading Software in an HA Configu
- Page 368 and 369:
(B) To use the SOFTWARE PRODUCT on
- Page 370 and 371:
RENEWAL/UPGRADE REQUEST WILL NOT BE
- Page 372 and 373:
conditions of use by WatchGuard of
- Page 374 and 375:
LicensesDATA, OR PROFITS; OR BUSINE
- Page 376 and 377:
Licenses"Derivative Works" shall me
- Page 378 and 379:
LicensesANY DIRECT, INDIRECT, INCID
- Page 380 and 381:
Licenses2. You may modify your copy
- Page 382 and 383:
Licenses8. You may not copy, modify
- Page 384 and 385:
LicensesYou may charge a fee for th
- Page 386 and 387:
LicensesINCLUDING, BUT NOT LIMITED
- Page 388 and 389:
Licenses1.2. "Compilation" means a
- Page 390 and 391:
LicensesTHE VRT CERTIFIED RULES AND
- Page 392 and 393:
LicensesNoteAll other trademarks or
- Page 394 and 395:
Default File LocationsFile TypeHelp
- Page 396 and 397:
Default File Locations378 WatchGuar
- Page 398 and 399:
Packet Filter PoliciesAOLThe Americ
- Page 400 and 401:
Packet Filter PoliciesCharacteristi
- Page 402 and 403:
Packet Filter PoliciesCharacteristi
- Page 404 and 405:
Packet Filter PoliciesIRCInternet R
- Page 406 and 407:
Packet Filter PoliciesCharacteristi
- Page 408 and 409:
Packet Filter PoliciesPPTPPPTP is a
- Page 410 and 411:
Packet Filter PoliciesSecurIDRSA Se
- Page 412 and 413:
Packet Filter PoliciesCharacteristi
- Page 414 and 415:
Packet Filter Policies• Port Numb
- Page 416 and 417:
Packet Filter PoliciesWG-SmallOffic
- Page 418 and 419:
Proxied Policiesmessages to flow fr
- Page 420 and 421:
about SYN flood setting 137address
- Page 422 and 423:
Domain Name System. See DNSDon’t
- Page 424 and 425:
selecting for tunnel 247Gateways di
- Page 426 and 427:
icon on toolbar for 4installing on
- Page 428 and 429:
Perfect Forward Secrecy 248Performa
- Page 430 and 431:
Secondary Networks dialog box 107Se
- Page 432:
Wand strong passwords 227and WatchG


