Disaster information management system in Taiwan
Disaster information management system in Taiwan
Disaster information management system in Taiwan

Create successful ePaper yourself
Turn your PDF publications into a flip-book with our unique Google optimized e-Paper software.
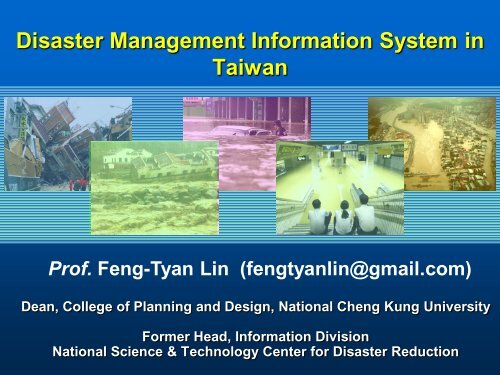
<strong>Disaster</strong> Management Information System <strong>in</strong><strong>Taiwan</strong>Prof. Feng-Tyan L<strong>in</strong> (fengtyanl<strong>in</strong>@gmail.com)Dean, College of Plann<strong>in</strong>g and Design, National Cheng Kung UniversityFormer Head, Information DivisionNational Science & Technology Center for <strong>Disaster</strong> Reduction
Contents• Foreword and Background• Organization• Decision Support System for Early Warn<strong>in</strong>g• Risk Map• Resilient Community• Future works
Basic Concepts• Susta<strong>in</strong>ability is an attribute of dynamic, adaptive<strong>system</strong>s that are able to flourish and grow <strong>in</strong> theface of uncerta<strong>in</strong>ty and constant change.• Natural hazards are major threats tosusta<strong>in</strong>ability. They are hard to predict andbecome even worse while global climate changes.• <strong>Disaster</strong> <strong>management</strong> is one of the key issues forachiev<strong>in</strong>g susta<strong>in</strong>ability, which will require<strong>in</strong>novation, foresight, and effective partnershipsamong researchers, governments, corporations,citizens, and other groups.
Basic Information of <strong>Taiwan</strong>•Geographic features•400 km from north to south•145 km from east to west•Area: 36,000 Km 2 over 70% <strong>in</strong>slopeland•Population (<strong>in</strong> June,2006)•22,900,00 <strong>in</strong> total, 67.70% <strong>in</strong>urban areas•Density: 633/ Km 2 , only lowerthan Bangladesh (1023 Km 2 ),higher than Japan (338 Km 2 )•Tectonic Conjunctions:•Philipp<strong>in</strong>e Sea plate•Euro-Asia Plate•High risk of tropical cyclones•3.6 typhoons/year
Summary of <strong>Disaster</strong> Events and PotentialRisks recent years <strong>in</strong> <strong>Taiwan</strong><strong>Disaster</strong>Surround<strong>in</strong>gs‣Urbanization‣ Large-Scale‣Social vulnerable groups‣ Higher-Reoccurrence‣Environmental‣ DiversityDegradation‣ ComplexityVulnerability ‣Global Climate Change• In 2005, the report entitled “Natural <strong>Disaster</strong> Hotspots – AGlobal Risk Analysis” issued by World Bank <strong>in</strong>dicated:“<strong>Taiwan</strong> might be the most vulnerable to natural hazards onEarth, with 73 % of land and population exposed to three ormore hazards”
<strong>Taiwan</strong> Suffers More than Others<strong>Taiwan</strong>Source: World Bank, 2005
Typhoon <strong>Disaster</strong>s <strong>in</strong> <strong>Taiwan</strong>Total loss due to natural disasters (1958-2001)Earthquake8.0%Flood17.4%Other3.3%Typhoon71.4%72% natural hazard damage is causedby typhoon <strong>in</strong> <strong>Taiwan</strong>
Economic Losses of Typhoon <strong>in</strong> <strong>Taiwan</strong>• In average, there are 3.6 typhoons touched down <strong>in</strong><strong>Taiwan</strong> every year• In 2001, 8 typhoons attacked <strong>Taiwan</strong>• In 2004, 6 typhoons swept <strong>Taiwan</strong>• In 2005, 3 category-4 typhoons hit <strong>Taiwan</strong>Typhoon Death InjureAgri.Loss($US M)(A)Constr.Loss($US M)(B)Total($US M)(A+B)Chebi 30 124 22.3 0.7 23.0Trami 5 - 2.2 4.9 7.1Toraji 214 188 235.7 170.6 406.4Typhoon tracks <strong>in</strong> 2001Nari 104 265 126.5 56.7 183.1Utor 1 6 2.9 7.6 10.5Total 354 583 389.6 240.5 630.1
Debris flows and urban flood<strong>in</strong>g have become the most severe hazards<strong>in</strong> <strong>Taiwan</strong> dur<strong>in</strong>g typhoon seasons.Taipei MRT
Organization
Organization Framework ofCurrent <strong>Disaster</strong> Management <strong>in</strong> <strong>Taiwan</strong>Central <strong>Disaster</strong> Prevention& Preparedness CouncilNCDRNational Science councilCivil DefenseOther Counties andTownshipsTechnicalAdvisoryCommitteeCentral <strong>Disaster</strong>Prevention &Response CommitteeDuty M<strong>in</strong>istriesNationalEmergenceOperationsCenterM<strong>in</strong>istry of the Interior, M<strong>in</strong>istry of EconomicAffairs, M<strong>in</strong>istries of Communications, Council ofAgriculture, Environment ProtectionAdm<strong>in</strong>istration, etcCounty County Level <strong>Disaster</strong> Level Prevention <strong>Disaster</strong>& Response Council and DEPCSEmergencyResponseTeam ofM<strong>in</strong>istriesSpecial SAR team andTra<strong>in</strong><strong>in</strong>g CenterSAR teamDepartment of Defense (assistance)NGOs andCommunicationOrganizationTownship Level <strong>Disaster</strong>Prevention & ResponseCouncil and DEPCS
CentralEmergencyOperationCenter
Information flow to the CEOC, <strong>Taiwan</strong>
Information flow to local DMIS
Decision Support Systemfor Early Warn<strong>in</strong>g
• A Decision Support System for Early Warn<strong>in</strong>g (DSSEW)was developed by NCDR for typhoon hazards.• The DSSEW is designed to <strong>in</strong>tegrate the real-timemonitor<strong>in</strong>g data, the dynamic hazard models and Web-GIStechnology to provide disaster <strong>management</strong> decisionsupport tools for early warn<strong>in</strong>g.• The <strong>in</strong>put data of this <strong>system</strong> <strong>in</strong>cludes:• the basic maps• the real-time <strong><strong>in</strong>formation</strong> of typhoon and ra<strong>in</strong>fall issued by theCentral Weather Bureau• the real-time water <strong><strong>in</strong>formation</strong> form the Water ResourcesAgency• the hazard maps <strong>in</strong>dicat<strong>in</strong>g areas of potential landslide, debrisflow and flood<strong>in</strong>g made by NCDR herself• The results of analysis and warn<strong>in</strong>g messages are f<strong>in</strong>allydelivered to the Central Emergency Operations Center(CEOC) and help the commander to make the rightdecisions <strong>in</strong> disaster preparedness and response phases.
Basic MapsRa<strong>in</strong>fall forecast<strong>in</strong>g byCLIPPER modelRa<strong>in</strong>fall forecast<strong>in</strong>g byQPE-SUMS radar <strong>system</strong>Warn<strong>in</strong>g MessageBroadcast<strong>in</strong>gTyphoon PathPredictionInundationPotential MapsReal-Time Water Informationof rivers by Web-ServicesTechnologyAutomatic Estimationof Inundation AreaAnalysis andDecision Mak<strong>in</strong>gDebris Flow andlandslide<strong><strong>in</strong>formation</strong>Automatic Estimation of thepotential areas of DebrisFlows and LandslideManagement of <strong>Disaster</strong>InvestigationCentral Warn<strong>in</strong>gDeclarationNEOC
Function Modules of DSSEWInputInformation forPost-<strong>Disaster</strong> RecoveryBasic MapsHazards MapsReal-Time InformationRa<strong>in</strong>fall Monitor<strong>in</strong>gQPE-SUMS Radar SystemWater InformationCommon Platform forData Shar<strong>in</strong>g<strong>Disaster</strong> Analysis and System IntegrationDataWarehouseMetadataEstablishmentDataStandardizationDataVisualizationManagementOf Softwareand HardwareIntegrated with QPE-SUMSRadar SystemAutomatic Estimation ofInundation AreasAutomatic Estimation of DebrisFlow and Landslide AreasIntegrated with TELES SystemRisk AssessmentRisk Analysis of Toxic SubstanceRelease<strong>Disaster</strong> InvestigationInformation SystemMeteorology DivisionFlood and Drought<strong>Disaster</strong>s Reduction DivisionSlopeland<strong>Disaster</strong> Reduction DivisionEarthquake<strong>Disaster</strong> Reduction DivisionSocio-Economic System DivisionTechnology and Manmade<strong>Disaster</strong>s Reduction DivisionInformation DivisionWeb-GIS (GUI Interface)OutputRa<strong>in</strong>fallForecast<strong>in</strong>gInundationPotentialDebris FlowPotentialDamageAssessmentEarthquakePotentialToxic RiskPotential<strong>Disaster</strong>InvestigationGovernmentalAgencies andNGOsInformationfor EarlyWarn<strong>in</strong>gDecision MakersWEBGISS<strong>in</strong>gle SignonUsers
The System Network of DSSEWBasicDBMetadataDB<strong>Disaster</strong>DBExpertsDB<strong>Disaster</strong> DB<strong>Disaster</strong>Modules<strong>Disaster</strong>KnowledgeDBHTTP, Java, ActiveXWeb APIs, CGI, COM,XML, GML,Web Services (SOAP,UDDI, WSDL)GRIDNetworkProtocolTerm<strong>in</strong>alsUsersInternetDatabaseSystemGISServer<strong>Disaster</strong>ManagementserverNetworkserver<strong>Disaster</strong> ManagementInformation SystemWirelessSystemManagerPost-<strong>Disaster</strong><strong>in</strong>vestigation SystemAnalysts/Decision makers
The Framework Of Common Platform For<strong>Disaster</strong> Information Shar<strong>in</strong>g and ExchangeData Collection ToolsInfo Common PlatformNational Information Center for <strong>Disaster</strong> Reduction<strong>Disaster</strong>DatabaseMetadataDatabase<strong>Disaster</strong>KnowledgeBaseExpertsDatabase<strong>Disaster</strong>OperationsDamageAssessmentRisk Analysise-GovernmentCommon PlatformE-<strong>Taiwan</strong>Common PlatformOtherCommon PlatformXML, GMLNetworkTechnologyCommon PlatformWeb ServicesOS ServicesOpen Netwrok Protocal(SMTP,SOAP, …)XML, GMLXML, GMLXML, GMLMonitor<strong>in</strong>gResponse &Early Warn<strong>in</strong>gPlann<strong>in</strong>ge &ManagementRevovery &Reconstrution…DatabaseCentral Gov.DatabaseE-Ch<strong>in</strong>eseTaipeiDatabaseNCDRDatabaseNGISDatabaseLocal Gov.DatabaseOtherDatabaseInfo. SystemsCentral Gov.Info. SystemsE-Ch<strong>in</strong>ese TaipeiInfo. SystemsNCDRInfo. SystemsLocal Gov.Info. Systems
What is DSSEW do<strong>in</strong>g ?PresentationEmergency responsestrategiessuggestionHazardresponseprocessMonitorRa<strong>in</strong>fall dataClimate forecast modelAnalysisPredict slope landdisaster locationPredict <strong>in</strong>undationdisaster location
MonitorMonitor Real time dataWarn <strong>in</strong>stantlyTyphoon forecastdataRa<strong>in</strong> gauge dataClimate forecast modelSend Warn<strong>in</strong>gmessageRiver and reservoirstatusRadar estimate ra<strong>in</strong>fall•collects the typhoon <strong><strong>in</strong>formation</strong>•estimate of its future track
Severe Weather Early Warn<strong>in</strong>g and Monitor<strong>in</strong>gSatellitesUpper airsound<strong>in</strong>gRegional ModelRadar NetworkData analysisStorm analysisStorm track<strong>in</strong>gRa<strong>in</strong>fall estimateHistorical case...Surface stationsAuto ra<strong>in</strong>-gaugeLighten<strong>in</strong>g observations
Climate forecast modelForecast slope land areara<strong>in</strong>fall by WRF(WeatherResearch & Forecast<strong>in</strong>g model)Forecast Bas<strong>in</strong> ra<strong>in</strong>fall by WRF
The User Interface for the Ra<strong>in</strong>fall DistributionRa<strong>in</strong> gauge ra<strong>in</strong>fall orderThe accumulated ra<strong>in</strong>fall is calculated as the GISlayer
Send warn<strong>in</strong>g message to cell phonesDynamicRa<strong>in</strong>falldatabaseCalculateaccumulate 1、3hours ra<strong>in</strong>fall ofeach ra<strong>in</strong> gaugeRa<strong>in</strong>fall warn<strong>in</strong>g ruleTwo adjacent ra<strong>in</strong> gaugeexceed 40mm/hrS<strong>in</strong>gle ra<strong>in</strong> gaugeexceed 100mm/hrMake message listSend message(May) 27 04:10Taitung county DaRan town NanTianaccumulate 1 hour ra<strong>in</strong>fall 43mmTaitung county DaRan town Shoukaaccumulate 1 hour ra<strong>in</strong>fall 45mm
AnalysisStatic basic dataReal timehazard dataBasic map dataPredict slope landdisaster locationPotential <strong>in</strong>undationdataReveal hazard locationPotential debris flowdataPredict <strong>in</strong>undationdisaster location
Real Time Ra<strong>in</strong>fallDataTyphoon PathPredictionMeteorologicalmodelsflood areasDatabaseCaseRetrievalDetailmeteorological mapLandslideDatabaseReal-timeflood<strong>in</strong>g areaPotential floodarea predictionPotential landslidearea predictionLandslide disasterresponse <strong>system</strong>Socio-economicLosses predictionTransportation<strong>system</strong>National<strong>Disaster</strong> Response Center
The Inundation Potential Maps <strong>in</strong> <strong>Taiwan</strong>• The flood and droughtmitigation research grouphad f<strong>in</strong>ished the island-wide<strong>in</strong>undation potential maps <strong>in</strong>2001.• For floodpla<strong>in</strong> <strong>management</strong>s• For flood mitigations• Incorporation with socialeconomic<strong><strong>in</strong>formation</strong>Taipei CityDepth : m0.50 - 1.501.50 - 2.502.50 - 3.503.50+Kaohsiung City
Select<strong>in</strong>g Potential Inundation AreasRiverCounty boundaryTownship boundaryHighwayMajor roadReal-time Ra<strong>in</strong>fall Records+Flood PotentialRa<strong>in</strong>fall Forecast<strong>in</strong>gHighest (avg. depth > 1.5 m)Higher (avg. depth 1.0m – 1.5m)High (avg. depth 0.5m – 1.0 m)Automatically selects the <strong>in</strong>undation potential layers every 10 m<strong>in</strong>utes32
Forecast<strong>in</strong>g of the Inundation Potential AreasBe modified manually via the user <strong>in</strong>terface of DSSER33
Potential Streams of Debris FlowGeology Zon<strong>in</strong>g of 1420Potential Hazard StreamsAutomatically identifies the potential areas of debris flow and landslide every one hour34
Issues the Warn<strong>in</strong>g and Security for the Counties ofthe Slopeland <strong>Disaster</strong> VulnerabilityMeteorological dataRa<strong>in</strong>fall distributionForecast ra<strong>in</strong>fall distributionThresholdSlopeland disaster thresholdForecast disaster locations<strong>Disaster</strong> location of the sametyphoon track<strong>in</strong>g before vs.ra<strong>in</strong>fall distributionSlopeland disaster VulnerabilityForecast traffic <strong>in</strong>terruptionlocationNoAccumulative ra<strong>in</strong>fall R(unit: mm)Averaged ra<strong>in</strong>fall <strong>in</strong>tensityI avg = R/D (unit: mm/hr)Start of a ra<strong>in</strong>fall event (t 1)(unit: hr)Current time (t 2)(unit: hr)Ra<strong>in</strong>fall duration D = t 2-t 1(unit: hr)I avg> I cYesDebris flow threshold l<strong>in</strong>eI c = 115.47D I -0.8c(unit: mm/hr)Display streams and regions over threshold <strong>in</strong> WebGISJudgments of regions prone to debris flowWarn<strong>in</strong>g of debris flow prone areas
The User Interface for the Forecast<strong>in</strong>g ofthe Slopeland <strong>Disaster</strong> Locations
PresentationImage and3D land form dataDecision mak<strong>in</strong>gCentralEmergencyOperationsCenterInformationdashboardResponse andarrange resource3D demonstration
Early Warn<strong>in</strong>g System for Decision MakerTyphoon Forecast<strong>in</strong>gRouteDistribution of Ra<strong>in</strong>fallRa<strong>in</strong>fall PeriodInundationPotential areasLandslidePotential areasSuggestion38
Risk Map
Climate-Related Inundation Risk MapRisk (R) = Hazard (H) x Vulnerability (V)R = Risk <strong>in</strong>dexH = Natural hazardsra<strong>in</strong>fall, <strong>in</strong>undation, land subsidenceV = Social vulnerabilitypopulation, age, <strong>in</strong>come, education, mortality
countytownship<strong>in</strong>dexRisk Indexra<strong>in</strong>fall<strong>in</strong>undationLandsubsidenceSocialVulneability屏 東 縣 林 邊 鄉 103.25 4.20 3.46 2.20 3.90 1.15台 南 縣 永 康 市 96.90 3.64 2.40 2.08 3.08 2.54雲 林 縣 大 埤 鄉 86.45 2.46 2.79 3.27 4.15 1.16屏 東 縣 東 港 鎮 85.54 4.06 3.75 1.62 3.74 1.37雲 林 縣 褒 忠 鄉 84.97 2.52 2.29 4.19 4.04 1.11高 雄 市 三 民 區 84.56 4.31 2.11 1.29 2.76 3.61雲 林 縣 台 西 鄉 83.69 2.59 2.72 2.79 4.27 1.20彰 化 縣 大 城 鄉 78.36 2.67 1.48 5.00 4.46 1.14雲 林 縣 四 湖 鄉 76.82 2.73 2.48 2.73 4.39 1.20雲 林 縣 崙 背 鄉 76.39 2.80 2.05 3.87 4.04 1.20population
Mitigation Strategiesra<strong>in</strong>fall <strong>in</strong>undation LandsubsidenceSocialvulnerabilitypopulation彰 雲 嘉 沿 海地 區(coastalarea)高 雄 台 南 都會 區(metropolitanarea)○ + + + -+ ○ - - +高 屏 沿 海 區(coastalarea)+ + - + -Different areas need different mitigation strategies
Overlaid withnational constructionprojects
Resilient Community
》 The limitation of government’s capability》The importance of community capabilityCENTRALGOV.COUNTY GOV.TOWNSHIP GOV.COMMUNITY》 The Hyogo Framework for Action 2005-2015“build<strong>in</strong>g disaster resilient community”
FROM RESISTANCE TO RESILIENCECommunity-Based <strong>Disaster</strong> Management Plan1.The Chi-Chi Earthquake Community Recovery2.Community Empowerment for <strong>Disaster</strong> ManagementWith “bottom up” participation of public sectors,experts and community-based organizations toimprove pre-disaster plann<strong>in</strong>g, facilitat<strong>in</strong>gpreparedness and emergency responsecapability.
CBDM PLAN《Participatory Process》
》Field survey
schoolCommunity meet<strong>in</strong>gchurchPeople to people
A Full-scale Exercise of Evacuation
Community-based recovery—Tau-Mi Village
Future works
Future works (1/2)• Susta<strong>in</strong>able city-regions should be built up for empower<strong>in</strong>gcommunity resilience.• Human factors should be further studied and elaborated.Communications and <strong>in</strong>terpretations among researchers,governmental officers, NGOs, NPOs, local communities, andgeneral citizens, should be greatly improved.• Urban space should be <strong>in</strong>novatively re-structured.Resolutions should be sought to balance economic growthand disaster risks.• Information <strong>system</strong> is an essential component for disasterreduction and emergency <strong>management</strong>. The disaster<strong>management</strong> <strong><strong>in</strong>formation</strong> <strong>system</strong> should be graduallyupgraded to a real decision support <strong>system</strong>, where more<strong>in</strong>telligent reason<strong>in</strong>g and prediction models should be<strong>in</strong>stalled together. Bi-directional emergency <strong><strong>in</strong>formation</strong>exchange and check mechanism should be built up.
Future works (2/2)• Many organizations, <strong>in</strong>clud<strong>in</strong>g fire, weather, water,and soil agencies, <strong>in</strong> different levels of governments<strong>in</strong> <strong>Taiwan</strong> have had their own emergency <strong><strong>in</strong>formation</strong><strong>management</strong> <strong>system</strong>s. The further step for hav<strong>in</strong>g an<strong>in</strong>tegrated DSSEW is to tightly work with the NGISprogram, team up the <strong><strong>in</strong>formation</strong> divisions ofassociate research centers, establish a datawarehouse as a common platform with an XML/GMLbaseddata exchange standards, and jo<strong>in</strong><strong>in</strong>ternational cooperation projects.• It is highly expected that we will have a moresuccessful emergency response and disasterreduction <strong>system</strong> if we are able to fully employ thepowerful capability of computer <strong>system</strong>s, web-basedtechnology, and telecommunications devices.
Thank youfor your attention!!!