- Page 2 and 3:
National Mineral PolicyReport of th
- Page 4 and 5:
ContentsAcronyms...................
- Page 6 and 7:
Annexure 5: Using the GRI Guideline
- Page 8 and 9:
GDP gross domestic productGIS Geogr
- Page 10 and 11:
UNFCUSVATWCUUnited Nations Framewor
- Page 12 and 13:
Introduction1. The Government of In
- Page 14 and 15:
issues relate to fund raising by pr
- Page 16 and 17:
termination of MLs, lowering of cei
- Page 18 and 19:
• In the case of large mining ope
- Page 20 and 21:
investment. The work done by GSI co
- Page 22 and 23:
mainly for minerals of base metals
- Page 24 and 25:
1.21 This situation has changed dra
- Page 26 and 27:
absent. A study by the United Natio
- Page 28 and 29:
example, a mining major may outsour
- Page 30 and 31:
would otherwise remain unexploited
- Page 32 and 33:
the policy environment must continu
- Page 34 and 35:
‘A thrust is to be given to explo
- Page 36 and 37:
In reviewing the MMDR Act, it is ne
- Page 38 and 39:
permissible activities in order to
- Page 40 and 41:
(i)(ii)(iii)(iv)The current two-tie
- Page 42 and 43:
per plan should be significantly hi
- Page 44 and 45:
Duration of Concessions1.48 In the
- Page 46 and 47:
10,000 sq. km in a state. This has
- Page 48 and 49:
(ii)(iii)(iv)The maximum total area
- Page 50 and 51:
e obviated if the lease deed is exh
- Page 52 and 53:
elinquishment of areas by the lesse
- Page 54 and 55:
to give priority to the prior appli
- Page 56 and 57:
(v)(vi)(vii)Rules should be prescri
- Page 58 and 59:
esponsible for all rights, liabilit
- Page 60 and 61:
ut also the revenue generated from
- Page 62 and 63:
government at the Secretariat. A le
- Page 64 and 65:
Secretary. If the Directorate is in
- Page 66 and 67:
(i) All applications for mineral co
- Page 68 and 69:
application. A similar website shou
- Page 70 and 71:
concerned State Government (or othe
- Page 72 and 73:
Further, Rule 7D of the MCR specifi
- Page 74 and 75:
mission mode through, inter alia, t
- Page 76 and 77:
Chapter 3Forest Conservation and En
- Page 78 and 79:
conservation. There are trade-offs
- Page 80 and 81:
ICMM AND SDF3.8 The ICMM membership
- Page 82 and 83:
higher level. The basic approach is
- Page 84 and 85:
(i) To minimize displacement and to
- Page 86 and 87:
affected PAPs in the mining operati
- Page 88 and 89:
that a well-regulated and responsib
- Page 90 and 91:
(iii)Notwithstanding the above, sur
- Page 92 and 93:
egard, all ‘forest’ land must b
- Page 94 and 95:
Figure 3.1: Procedure for Processin
- Page 96 and 97:
should be authorised to grant or re
- Page 98 and 99:
formulation and appraisal of the EI
- Page 100 and 101:
3.41 Recognising the need to make t
- Page 102 and 103:
Figure 3.3: Public Hearing/NOC from
- Page 104 and 105:
Chapter 4Infrastructure Needs and F
- Page 106 and 107:
4.5 Logistics is the key to access
- Page 108 and 109:
Table 4.1: Mineral Production in In
- Page 110 and 111: necessary, therefore, that in infra
- Page 112 and 113: to the ports of Haldia and Paradip
- Page 114 and 115: Connectivity of Major Ports, brough
- Page 116 and 117: (iv)(v)(vi)(vii)At Visakhapatnam Po
- Page 118 and 119: was of the opinion that while the m
- Page 120 and 121: such an arrangement, the Ministry o
- Page 122 and 123: developed, controlled, and run by s
- Page 124 and 125: subject to overt and covert restric
- Page 126 and 127: consideration to the end use of the
- Page 128 and 129: (iii)parameters laid down in existi
- Page 130 and 131: Chapter 6Augmenting State Revenues(
- Page 132 and 133: the value addition question conside
- Page 134 and 135: In a system of ad valorem rates of
- Page 136 and 137: must provide revenues sufficient to
- Page 138 and 139: Box 6.1: Methods of Valuation of Ro
- Page 140 and 141: Another point to be borne in mind b
- Page 142 and 143: ailable, cognisable criminal offenc
- Page 144 and 145: e worked out. This should be string
- Page 146 and 147: 7.3 Considering the high-risk natur
- Page 148 and 149: Table 7.2: Minimum Listing Requirem
- Page 150 and 151: (ii)(iii)only. Such funds have not
- Page 152 and 153: addition, the minimum post-issue fa
- Page 154 and 155: and hence this ore should be conser
- Page 156 and 157: miners distort the market for their
- Page 158 and 159: 7.22 The current law does not make
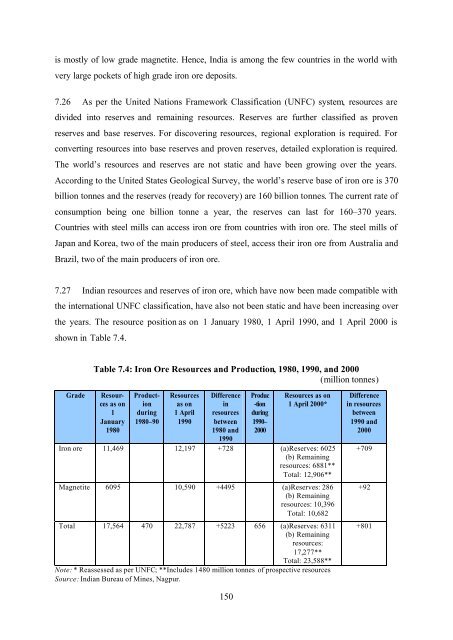
- Page 162 and 163: Most magnetite findings are entirel
- Page 164 and 165: in UK 206 kg, and in China it grew
- Page 166 and 167: metres. The use of down hole drill
- Page 168 and 169: 7.42 Despite the fact that SME mini
- Page 170 and 171: also be a consideration. However, t
- Page 172 and 173: price, reduce profitability, and pu
- Page 174 and 175: IMPACT ON DOMESTIC IRON ORE PRICES
- Page 176 and 177: 7.58 Export of iron ore fines on a
- Page 178 and 179: POLICY ON BEACH SAND MINERALS7.64 B
- Page 180 and 181: not contain more than 0.1 per cent
- Page 182 and 183: 7.73 On 18 January 2006, the DAE no
- Page 184 and 185: with the Centre is mainly to ensure
- Page 186 and 187: India enterprise) reported that the
- Page 188 and 189: chloride process pigment technology
- Page 190 and 191: are disposed of in the mined-out ar
- Page 192 and 193: directed to ensure that the AERB/AM
- Page 194 and 195: would have to be carefully drafted
- Page 196 and 197: ‘In coordination with the Geologi
- Page 198 and 199: Exploration Licences• The current
- Page 200 and 201: • The fees should be significantl
- Page 202 and 203: surveys have been undertaken, the P
- Page 204 and 205: automatic until the exhaustion of t
- Page 206 and 207: y stating in the MMDR Act that a pr
- Page 208 and 209: departmental representative for sec
- Page 210 and 211:
therefore (under Rule 63A), pass su
- Page 212 and 213:
• Section 12(1) of the MMDR Act s
- Page 214 and 215:
o The lessee should not be asked to
- Page 216 and 217:
again and the State Mines Departmen
- Page 218 and 219:
• As in the past, no environmenta
- Page 220 and 221:
oad and rail, and lack of long-term
- Page 222 and 223:
government to the applicants who ar
- Page 224 and 225:
next three-year period as well. In
- Page 226 and 227:
• Rates of dead rent should be ra
- Page 228 and 229:
measure to provide a level playing
- Page 230 and 231:
• In respect of three titanium be
- Page 232 and 233:
No-I&M-25(3)/2005Government of Indi
- Page 234 and 235:
No-I&M-25(3)/2005Planning Commissio
- Page 236 and 237:
‘Efforts would also be made to gr
- Page 238 and 239:
ecommending amendments to the Act a
- Page 240 and 241:
etained as a Prescribed Substance u
- Page 242 and 243:
OthersShri Arvind VarmaEx-Secretary
- Page 244 and 245:
16. Reserve Bank of India17. M/s Ji
- Page 246 and 247:
the RP holders in areas beyond 25 s
- Page 248 and 249:
Appendix ERecommendations of the Ex
- Page 250 and 251:
(1) Provide proximate and strategic
- Page 252 and 253:
technology to enter the Indian stee
- Page 254 and 255:
Cross-country Comparison of Mining
- Page 256 and 257:
Appendix F (cont.)Country Mining La
- Page 258 and 259:
Cross-country Comparison of Mining
- Page 260 and 261:
Appendix G (cont.)Country Mining le
- Page 262 and 263:
CountryAppendix H (Cont.)Environmen
- Page 264 and 265:
AustraliaIndonesia 9 4 Not specifie
- Page 266 and 267:
Annexure 1 (cont.)Geologicalenviron
- Page 268 and 269:
operations are undertaken over a fa
- Page 270 and 271:
B. After Rule 54 of the Mineral Con
- Page 272 and 273:
the Central Government to entertain
- Page 274 and 275:
applications, could exercise the ju
- Page 276 and 277:
We most humbly request that the abo
- Page 278 and 279:
Annexure 4The 2002Sustainability Re
- Page 280 and 281:
While unique in its coverage and pr
- Page 282 and 283:
• facilitate comparability• add
- Page 284 and 285:
AssuranceJust as investors look to
- Page 286 and 287:
The Guidelines are structured in fi
- Page 288 and 289:
There are many aspects relevant for
- Page 290 and 291:
- Issues in which community partici
- Page 292 and 293:
Annexure 7Royalty Accruals on Miner
- Page 294 and 295:
Sl.No.MineralAnnexure 8 (cont.)2003
- Page 296 and 297:
Annexure 91 THE SECOND SCHEDULE 1(S
- Page 298 and 299:
(v) Group V Coals:(a) Non-Coking Co
- Page 300 and 301:
23. Iron Ore:(i) Lumps:(a) with 65
- Page 302 and 303:
45. Tin Five per cent of London Met
- Page 304 and 305:
International Comparison of Royalty
- Page 306 and 307:
Production, Consumption, Exports, a


