regenerated humic acids obtained by the air oxidation of south ...
regenerated humic acids obtained by the air oxidation of south ...
regenerated humic acids obtained by the air oxidation of south ...

Create successful ePaper yourself
Turn your PDF publications into a flip-book with our unique Google optimized e-Paper software.
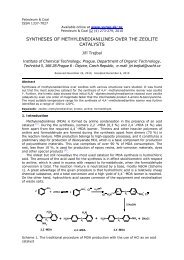
Zdeněk Cihlář, Jiří Kučerík/Petroleum & Coal 52 (4) 254-260, 2010 257shown in Figure 1. It can be seen two (or three) pronounced separated peaks generallyattributed to <strong>the</strong> <strong>the</strong>rmo-oxidative degradation <strong>of</strong> labile (~250–440 o C) and stable (~445–510 o C)<strong>humic</strong> <strong>acids</strong> constituents. The resulting heat is proportional to <strong>the</strong> peak area and it is aresult <strong>of</strong> both degradation and recombination reactions [26] .Table 2 The summary <strong>of</strong> results <strong>obtained</strong> from DSC and TGA (*recalculated for dry part).TGA results Δm [%]Samples Combustion heat [kJ g –1 ] moisture content 1. step* 2. step* ash content*HA 11.3 6.65 77.8 21.1 1.09RHA 1 10.8 6.44 75.9 23.5 0.58RHA 2 10.7 6.61 70.0 29.2 0.78RHA 3 10.3 6.82 75.6 23.8 0.62RHA 4 11.4 7.87 73.3 25.6 1.18RHA 5 12.7 7.44 75.5 23.4 1.10RHA 6 11.8 7.23 79.9 18.9 1.24RHA 7 11.7 7.16 80.5 18.5 1.00As can be seen in Figure 2 all <strong>the</strong> <strong>humic</strong> samples gave similar DSC records. Never<strong>the</strong>less,some differences appeared comparing <strong>the</strong> degradation onsets, peak temperatures andpeak area (proportional to combustion heat). It seems that increased amount <strong>of</strong> labileparts as detected <strong>by</strong> TGA caused <strong>the</strong> increase in <strong>the</strong> DSC peaks areas (Figure 2). It canbe seen that <strong>the</strong> peak area around 250–400 o C increased confirming <strong>the</strong> results from TGA.However, it is noteworthy, that <strong>the</strong> peak increase from 400–500 o C occurred as well, but,this region is attributed to <strong>the</strong> degradation <strong>of</strong> stable part which was, according to TGAresults, partly decomposed <strong>by</strong> regeneration. Therefore, it implies that <strong>the</strong> processes in<strong>the</strong> first step are mostly exo<strong>the</strong>rmal recombination <strong>of</strong> labile part than its degradation.Fig. 1. DSC record <strong>of</strong> <strong>the</strong>rmooxidativedegradation <strong>of</strong> RHA 4Fig. 2. DSC record <strong>of</strong> <strong>the</strong>rmooxidativedegradation <strong>of</strong> samples RHA 4–7Fig. 3 shows a typical TGA record including <strong>the</strong> first derivative (DTG). In all samples,<strong>the</strong> progressive mass loss which occurred up to 125 o C was caused mainly due to <strong>the</strong> loss<strong>of</strong> adsorbed water. In general, <strong>the</strong> first derivative <strong>of</strong> <strong>the</strong>rmogravimetric curves showedtwo degradation rate peaks. One peak occurred between 300 and 440 o C and is associatedwith a mass loss from 70 to 80 % <strong>of</strong> <strong>the</strong> total sample mass. A second peak occurredbetween 480 and 520 o C and gave 18 to 30% <strong>of</strong> mass loss. Thermogravimetric resultsconformed results <strong>obtained</strong> <strong>by</strong> DSC measurements.The parameters <strong>obtained</strong> from <strong>the</strong> DTG, TGA and DSC measurements are summarizedin Table 2. HA analyzed in this paper were intensively purified <strong>by</strong> HCl and HF to reduce<strong>the</strong> ash content. As it can be seen, <strong>the</strong> ash content was relatively low, in all cases it wasdetermined about 1%. Moisture content was determined in <strong>the</strong> interval from 6.6 to 7.9%.It seems that <strong>the</strong> greater moisture content had samples prepared in <strong>the</strong> static reactor(RHA 4–7). This increase can be associated with <strong>the</strong> physical and chemical changes in<strong>humic</strong> samples as a result <strong>of</strong> structure alteration which occurred in <strong>the</strong> course <strong>of</strong> <strong>oxidation</strong>periods. TGA measurement <strong>of</strong> <strong>humic</strong> samples fur<strong>the</strong>r showed two mass loss steps. Thefirst step can be related to decomposition <strong>of</strong> labile parts and <strong>the</strong> second one to <strong>the</strong> stableparts <strong>of</strong> <strong>humic</strong> <strong>acids</strong>. Comparison <strong>of</strong> <strong>the</strong> values from samples prepared in <strong>the</strong> static reactor
Zdeněk Cihlář, Jiří Kučerík/Petroleum & Coal 52 (4) 254-260, 2010 258(RHA 4–7) indicates an increase in labile component content and simultaneously a decrease<strong>of</strong> stable fraction. Evidently, during <strong>oxidation</strong> <strong>the</strong> partial decomposition <strong>of</strong> stable <strong>humic</strong>part occurred and <strong>the</strong>refore <strong>the</strong> RHA extracted from oxidized lignite contained larger pool<strong>of</strong> labile molecules. Fur<strong>the</strong>r decomposition is <strong>the</strong>n easier which can be related to <strong>the</strong> change<strong>of</strong> stabile/labile parts ratio. Never<strong>the</strong>less, <strong>the</strong>se results are not confirmed <strong>by</strong> DSC measurement.Total heat evolved was <strong>obtained</strong> <strong>by</strong> <strong>the</strong> DSC peak integration (Fig. 1). The largest value<strong>of</strong> 12.7 kJ g –1 was observed for sample RHA 5. In this case, no significant correlation wasobserved.Fig. 3. TGA and DTG record <strong>of</strong> RHA 4Fig 4. Dependence <strong>of</strong> <strong>the</strong> loss <strong>of</strong> mass in <strong>the</strong>first step <strong>of</strong> RHA 4–7 on <strong>the</strong> time <strong>of</strong> <strong>oxidation</strong>Figure 4 shows <strong>the</strong> correlation between <strong>the</strong> mass loss <strong>of</strong> <strong>humic</strong> <strong>acids</strong> in <strong>the</strong> first stepand <strong>the</strong> time <strong>of</strong> respective lignite <strong>oxidation</strong>. It seems that amount <strong>of</strong> mass decompositionin <strong>the</strong> TGA first step increases with <strong>the</strong> time <strong>of</strong> <strong>oxidation</strong>. Increasing <strong>of</strong> labile parts in RHAis also confirmed <strong>by</strong> DSC measurement as mentioned above. As it can be seen <strong>the</strong> increasereaches <strong>the</strong> limit which implies that at approximately 240 hours <strong>of</strong> <strong>oxidation</strong> <strong>the</strong> lignitestructure was completely changed a no fur<strong>the</strong>r conversion can be <strong>obtained</strong> <strong>by</strong> extendedperiod <strong>of</strong> <strong>oxidation</strong>. Apparently, that statement is valid only for conditions used in thiswork, i.e. for South Moravian lignite and <strong>oxidation</strong> <strong>by</strong> <strong>air</strong> at 85 o C.3.2 Moisture uptakeSome differences in chemical character among samples have already been revealedusing FTIR which indicated a small increase in <strong>the</strong> number <strong>of</strong> ester bonds in RHA [15] . Results<strong>of</strong> HPSEC showed <strong>the</strong> increase in <strong>the</strong> apparent molecular weight with increasing time <strong>of</strong>lignite <strong>oxidation</strong> <strong>of</strong> respective samples prepared in <strong>the</strong> fluid reactor [15] . Thermal analysistechniques such as DSC and TGA confirmed <strong>the</strong> difference in physical structure. In orderto evaluate <strong>the</strong> changes in detail, <strong>the</strong> capacity <strong>of</strong> surface area to uptake moisture was testedusing moisturizing container.Table 3 Moisture content in RHA samplesSample Δm – moisture content [%]HA 12.9RHA 1 12.9RHA 2 11.8RHA 3 13.5RHA 4 10.0RHA 5 10.8RHA 6 11.2RHA 7 13.1Fig. 5. Evaporation <strong>of</strong> moisture from samplesRHA 4–7Fig 5 shows selected TGA curves, which resulted from <strong>the</strong> evaporation <strong>of</strong> moisture adsorbedon <strong>the</strong> surface <strong>of</strong> samples RHA 4–7, placed into <strong>the</strong> moisturizing chamber for 21 days. As
Zdeněk Cihlář, Jiří Kučerík/Petroleum & Coal 52 (4) 254-260, 2010 259it can be seen all <strong>the</strong> records gave similar curve shapes which imply similar mechanisms<strong>of</strong> moisture release. Water content was determined as a mass loss recorded up to 125 o C.The results regarding <strong>the</strong> determination <strong>of</strong> moisture content in RHA samples are summarizedin Table 3. Amount <strong>of</strong> evaporated moisture was determined in <strong>the</strong> range from 10 to 13%.In fact, water content increases with increasing time <strong>of</strong> lignite <strong>oxidation</strong>. The evaporation<strong>of</strong> water molecules from RHA is governed <strong>by</strong> <strong>the</strong> strength <strong>of</strong> polar groups on <strong>the</strong> surface<strong>of</strong> <strong>humic</strong> material. The greatest rate <strong>of</strong> evaporation occurred at <strong>the</strong> beginning <strong>of</strong> <strong>the</strong> experimentwhere <strong>the</strong> records had steepest slopes, while at approximately 100 o C <strong>the</strong> kinetics decreasedand at between 150 and 200 o C degradation started.As could be seen, moisture content was higher in samples which were prepared at lowertemperatures and also increased at longer period <strong>of</strong> <strong>oxidation</strong> at 85 o C. This trend corroboratewith yield <strong>of</strong> <strong>humic</strong> substances extracted from oxidized and parental lignite publishedrecently [15] and can be probably attributed to <strong>the</strong> content <strong>of</strong> COOH and phenolic OH groupsin <strong>humic</strong> material.4. ConclusionThermal analysis was used to study properties <strong>of</strong> <strong>humic</strong> <strong>acids</strong> and RHA produced fromlignite oxidized <strong>by</strong> <strong>air</strong> under different conditions. The influence <strong>of</strong> <strong>the</strong>se conditions on moistureuptake and <strong>the</strong>rmal stability were studied. Our recent results indicated an increase in number<strong>of</strong> ester bonds in RHA [15] . Fur<strong>the</strong>r, <strong>by</strong> means <strong>of</strong> HPSEC it was demonstrated <strong>the</strong> increasein <strong>the</strong> apparent molecular weight with increasing time <strong>of</strong> <strong>oxidation</strong> for samples preparedin static and <strong>the</strong> fluid reactor.It has been verified that higher temperature during <strong>the</strong> <strong>oxidation</strong> supports <strong>the</strong> production<strong>of</strong> more “cross-linked” RHA. Moisture content in samples placed into <strong>the</strong> moisturizingchamber for 21 days (relative humidity is 100%) increased with increasing time <strong>of</strong> parentallignite <strong>oxidation</strong>. Comparison <strong>of</strong> <strong>the</strong> TGA values from samples prepared in <strong>the</strong> static reactor(RHA 4–7) indicates an increase <strong>of</strong> labile component content, and, simultaneously, adecrease <strong>of</strong> a stable fraction. The increase reached <strong>the</strong> limit which implies that at approximatelyafter 240 hours <strong>of</strong> <strong>oxidation</strong> <strong>the</strong> structure was completely altered a no fur<strong>the</strong>r transformation<strong>of</strong> <strong>humic</strong> matter took place <strong>by</strong> fur<strong>the</strong>r <strong>oxidation</strong> (for conditions used in this work, <strong>oxidation</strong> <strong>by</strong><strong>air</strong> at 85 o C). No significant correlation was observed for samples extracted from ligniteoxidized in fluid reactor. Increasing content <strong>of</strong> labile pool in RHA was also confirmed <strong>by</strong> aDSC measurement.AcknowledgementsThe work was financially supported <strong>by</strong> <strong>the</strong> project MSM 0021630501.References[1] Stevenson, F.J.: Humus Chemistry. Genesis, Composition, reactions. John Wileyand Sons, Inc., NY. 2nd edition. 1994.[2] Simón, M., Garcia, I., Gil, C., Polo, A. M.: Geoderma. 1994, 61, 119.[3] Rashid, M. A.: Geochemistry <strong>of</strong> Marine Humic Compounds. Springer-Verlag. NY, 1985.[4] Thurman, E. M.: Organic Geochemistry <strong>of</strong> natural Waters. Dordrecht, BostonHingham. Massachusetts, 1985.[5] Schulten, H. R., Schnitzer, M.: Naturwissenschaften. 1995, 82, 487.[6] Aiken, G. R., McKnight, D. M., Wershaw, R. L., McCarthy, P.: Humic substances inSoil, Sediments and Water: geochemistry, isolation and characterization. Wiley,NY. 1985.[7] Klavins, M.: Aquatic Humic Substances: Characterization, Structure and Genesis,Riga, LU. 1998, 286.[8] Piccolo, A.: Adv. Agron. 2002, 75, p. 57.[9] Piccolo, A.: Humic substances in terrestrial ecosystems. Elsevier, Amsterdam, 1996, 225.[10] Stevenson, F. J., Cole, M. A.: The cycles <strong>of</strong> soils, 2nd edition, Wiley, NY, 1999.[11] Hayes, M. H. B., Clapp, C. E.: Soil Science. 2001, 166, 723.[12] Rausa, R., Girardi, E., Calemna, V.: In Humic Substances in <strong>the</strong> Global Envinronmentand Implications on Human Health (N. Senesi and T.M. Miano eds). 1994, Elsevier.[13] Van Krevelen D. W.: Coal: Typology – Physics – Chemistry – Constitution. Elsevier, 1981.[14] Calemna, V., Rausa, R., Girardi, E.: Proc. <strong>of</strong> <strong>the</strong> Int. Conf. on Coal Sci., Tokyo, Japan,1989, 232.[15] Kučerik, J., Cihlář, Z., Vlčková, Z., Drastík, M.: Petroleum and Coal. 2008, 50 (3), 49[16] Kučerík, J., Kovář, J., Pekař, M.: J. Therm. Anal. Cal. 2004, 76, 55.
Zdeněk Cihlář, Jiří Kučerík/Petroleum & Coal 52 (4) 254-260, 2010 260[17] Benites, V. de Mello., Kučerík, J., Madari, B. E.: Chemické listy. 2005, 99, 123.[18] Ioselis, P., Rubinsztain, Y., Ikan, R., Aizenshtai, Z., Frenkel, M.:Org. Geochem.1985, 8 (95), 101.[19] Válková, D., Kislinger, J., Pekař, M., Kučerík, J.: J. Therm. Anal. Cal. 2007, 89 (3), 957.[20] Hurrass, J., Schaumann, G. E.: Soil Sci. Soc. Am. J., 2007, 71, pp. 280-288.[21] Kučerík, J., Kovář, J., Pekař, M, Šimon, P.: Naturwissenschaften. 2005, 92, 336.[22] Siewert, C.: Investigation <strong>of</strong> <strong>the</strong> <strong>the</strong>rmal and biological stability <strong>of</strong> soil organic matter.Shaker-Verlag, Aachen, 2001.[23] Simpson, A. J., Burdon, J., Graham, C. L., Hayes, M. H. B.: Humic substances,peats and sludges. The Royal Society <strong>of</strong> Chemistry, Cambridge, UK, 1997, 83.[24] Saiz-Jimenez C.: Environ. Sci. Technol. 1994, 28, 1773.[25] Campanella, L., Tomassetti, M.: Thermochimica Acta. 1990, 170, 67.[26] Trompowsky, P. M., Benites, V. M., Madari, B. E., Pimenta, A. S., Hockaday, W. C.,Hatcher, P. G.: Org. Geochem. 2005, 36, 1480.