is 'malaysia truly asia'? forecasting tourism demand from asean ...
is 'malaysia truly asia'? forecasting tourism demand from asean ...
is 'malaysia truly asia'? forecasting tourism demand from asean ...

You also want an ePaper? Increase the reach of your titles
YUMPU automatically turns print PDFs into web optimized ePapers that Google loves.
TOURISMOS: AN INTERNATIONAL MULTIDISCIPLINARY JOURNAL OF TOURISMVolume 7, Number 1, Spring-Summer 2012, pp. 367-381UDC: 338.48+640(050)IS ‘MALAYSIA TRULY ASIA’?FORECASTING TOURISM DEMAND FROM ASEANUSING SARIMA APPROACHLoganathan Nanthakumar 1Universiti Malaysia TerengganuThirunaukarasu SubramaniamUniversity of MalayaMori KogidUniversiti Malaysia SabahMalaysia <strong>is</strong> well-known for her ‘blue’ and ‘green’ tour<strong>is</strong>m attractions. Malaysiangovernment launched several tour<strong>is</strong>m programs to encourage and attractinternational tour<strong>is</strong>t arrivals into Malaysia. Th<strong>is</strong> study therefore attempts toforecast the tour<strong>is</strong>m <strong>demand</strong> for Malaysia <strong>from</strong> ASEAN countries. The literatureon <strong>forecasting</strong> tour<strong>is</strong>m <strong>demand</strong> <strong>is</strong> huge compr<strong>is</strong>ing various types of empiricalanalys<strong>is</strong>. Some of the researchers applied cross-sectional data, but most of thetour<strong>is</strong>m <strong>demand</strong> <strong>forecasting</strong> used pure time-series analytical models. One of theimportant time-series modelling used in tour<strong>is</strong>m <strong>forecasting</strong> <strong>is</strong> ARIMA modelling.Th<strong>is</strong> study employs quarterly time series data of ASEAN tour<strong>is</strong>t arrivals toMalaysia for the period <strong>from</strong> 1995:Q1 to 2009:Q4 to forecast future tour<strong>is</strong>m<strong>demand</strong> for Malaysia. The <strong>forecasting</strong> performance <strong>is</strong> based on seasonal ARIMAmodel. The findings of th<strong>is</strong> study revealed that seasonality model does not offerany valuable insights or provide reliable forecasts on tour<strong>is</strong>m <strong>demand</strong> forMalaysia by ASEAN countries. Th<strong>is</strong> scenario occurs because of the fact that‘Malaysia <strong>is</strong> Truly Asia’.Keywords: one-period-ahead <strong>forecasting</strong>, SARIMA, ASEANJEL Classification: L83, M1, O1INTRODUCTIONMalaysia <strong>is</strong> one of Asia’s most popular tour<strong>is</strong>t destinations. Manystudies were undertaken to assess international tour<strong>is</strong>t perceptions of© University of the Aegean. Print ISSN: 1790-8418, Online ISSN: 1792-6521367
Loganathan Nanthakumar, Thirunaukarasu Subramaniam & Mori KogidMalaysia as a tour<strong>is</strong>t destination. Lower real exchange rate and politicalstability made Malaysia as an affordable tour<strong>is</strong>t destination. Malaysia <strong>is</strong>also well known for its ‘green tour<strong>is</strong>m’ with attractive tropicalenvironment; ‘blue tour<strong>is</strong>m’ with beautiful beaches and <strong>is</strong>lands; h<strong>is</strong>toricaland culinary attraction; diverse culture; diverse ethnic food (see forexample Josiam, Sohail & Monteiro, 2007); world-class hotels andresorts; and excellent shopping places. East Asia, which include Japan,Korea, China and Taiwan, including ASEAN (Association of SoutheastAsian Nations) countries are Malaysia’s major tour<strong>is</strong>t market, with amarket share of 75% of the overall international tour<strong>is</strong>t arrivals toMalaysia in 2010. Singapore, Indonesia and Thailand are three majortour<strong>is</strong>m source markets for Malaysia, with a total share of 60% <strong>from</strong> thetotal international tour<strong>is</strong>t arrivals to Malaysia in 2010. Th<strong>is</strong> phenomenaconcurs with ‘Malaysia <strong>is</strong> Truly Asia’ tagline promoted by Tour<strong>is</strong>mMalaysia. In spite of the phenomenal growth in inbound tour<strong>is</strong>m <strong>from</strong>ASEAN region, little research has been undertaken on these markets toevaluate their contributions to Malaysia’s inbound tour<strong>is</strong>m industry. Theinternational tour<strong>is</strong>m can be estimated in terms of the number ofinternational tour<strong>is</strong>t arrivals. Meanwhile, domestic tour<strong>is</strong>m generally <strong>is</strong>not considered for most of empirical analys<strong>is</strong> purposes. The WorldTour<strong>is</strong>m Organization predicted that there will be 1.6 billion internationaltour<strong>is</strong>t arrivals worldwide by 2020 and that these tour<strong>is</strong>ts are alsoexpected to spend over two trillion US dollars (WTO Report, 2010).Thus, the d<strong>is</strong>cussion of th<strong>is</strong> paper <strong>is</strong> organ<strong>is</strong>ed as follows. The secondsection of th<strong>is</strong> paper will d<strong>is</strong>cuss the selected literature review. The thirdsection focuses on methodology used. The fourth section touches onempirical findings and the final section concludes.LITERATURE REVIEWAlong with the phenomenal growth in <strong>demand</strong> for tour<strong>is</strong>m worldwideover the past two decades, there <strong>is</strong> also a growing interest in tour<strong>is</strong>mresearch. The literature on modelling and <strong>forecasting</strong> tour<strong>is</strong>m <strong>demand</strong> <strong>is</strong>numerous with various type of empirical analys<strong>is</strong>. Some of theresearchers applied cross-sectional data, but most of tour<strong>is</strong>m <strong>demand</strong><strong>forecasting</strong> used pure time-series analytical models. One of the importanttime-series modelling used in <strong>forecasting</strong> tour<strong>is</strong>m <strong>demand</strong> <strong>is</strong> ARIMAmodelling, which <strong>is</strong> specified based on standard Box-Jenkins method, afamous modelling approach in <strong>forecasting</strong> <strong>demand</strong>. Many studies haveapplied th<strong>is</strong> methodology, such as Chu (2008a), Lee, Song and Mjelde(2008), Coshall (2009), Wong et al. (2007), Akal (2004), Preez and Witt368
TOURISMOS: AN INTERNATIONAL MULTIDISCIPLINARY JOURNAL OF TOURISMVolume 7, Number 1, Spring-Summer 2012, pp. 367-381UDC: 338.48+640(050)(2003); and Kulendran and Witt (2001). The ARIMA model <strong>is</strong> proven tobe reliable in modelling and tour<strong>is</strong>m <strong>demand</strong> <strong>forecasting</strong> with monthlyand quarterly time-series. Wong et al. (2007) used four types of models,namely seasonal auto-regressive integrated moving average model(SARIMA), auto-regressive d<strong>is</strong>tributed lag model (ADLM), errorcorrection model (ECM) and vector-autoregressive model (VAR) toforecast tour<strong>is</strong>m <strong>demand</strong> for Hong Kong by residents <strong>from</strong> ten majororigin countries. The empirical results of the study shows that forecastcombinations do not always outperform the best single forecasts whichhave been used frequently in previous studies. Therefore, combination ofempirical models can reduce the r<strong>is</strong>k of <strong>forecasting</strong> failure in practice. Forexample, Coshall (2009) used univariate time series approach, combiningthe ARIMA, volatility and smoothing models to forecast UnitedKingdom’s <strong>demand</strong> for international tour<strong>is</strong>m. Generally, <strong>from</strong> th<strong>is</strong> studywe can conclude that the ARIMA volatility models tend to overestimate<strong>demand</strong>, and the smoothing models are inclined to underestimate thenumber of future tour<strong>is</strong>t arrivals.Chu (2008a) modified ARIMA modelling to fractionally integratedautoregressive moving average (ARFIMA) in <strong>forecasting</strong> tour<strong>is</strong>m<strong>demand</strong>. Th<strong>is</strong> ARFIMA model <strong>is</strong> ARMA based methods. Three types ofunivariate models were applied in the study with some modification inARMA model to become ARAR and ARFIMA model. The main purposeof th<strong>is</strong> study <strong>is</strong> to investigate the ARMA based models and its usefulnessas a forecast generating mechan<strong>is</strong>m for tour<strong>is</strong>m <strong>demand</strong> for nine majortour<strong>is</strong>t destinations in the Asia-Pacific region. Th<strong>is</strong> study <strong>is</strong> different <strong>from</strong>other tour<strong>is</strong>m <strong>forecasting</strong> studies publ<strong>is</strong>hed earlier, because we canidentify the ARMA based models behaviour and the difference betweenARFIMA models with other ARMA based models. Again, Chu (2008b)studied the ARIMA based model using ARAR algorithm model in orderto analyze and forecast tour<strong>is</strong>m <strong>demand</strong> for Asia-Pacific region usingmonthly and quarterly data. Th<strong>is</strong> study reveals that the performancebetween forecasts generated by monthly and quarterly data <strong>is</strong> similar.Besides <strong>forecasting</strong> tour<strong>is</strong>t arrivals, prediction of tour<strong>is</strong>m revenue can alsobe done using empirical modelling. Akal (2004) used autoregressiveintegrated moving average cause-effect (ARMAX) modelling to forecastinternational tour<strong>is</strong>m <strong>demand</strong> for Turkey. The ARMAX model <strong>is</strong> actuallyderived <strong>from</strong> the ARIMA approaches. The forecast estimations are animportant benchmark for Turkey’s government to strengthen the tour<strong>is</strong>msector in order to transform it into a major contributing sector foreconomic development in the future.369
Loganathan Nanthakumar, Thirunaukarasu Subramaniam & Mori KogidSong, Wong and Chon (2003) introduced general-to-specificmodelling approach to forecast international tour<strong>is</strong>t arrivals <strong>from</strong> 16major countries to Hong Kong for the period <strong>from</strong> 2001 to 2008. Thespecification of econometric model used <strong>is</strong> known as auto-regressived<strong>is</strong>tributed lag model (ADLM). Th<strong>is</strong> study shows that, several importantfactors that determine the <strong>demand</strong> for Hong Kong tour<strong>is</strong>m include thecost of tour<strong>is</strong>m in Hong Kong, the economic scenario in the origincountries, the costs of tour<strong>is</strong>m in the competing destinations and the‘word of mouth’ effect. Again, ADLM measurement of tour<strong>is</strong>m<strong>forecasting</strong> <strong>is</strong> suitable for multivariate modelling and by using th<strong>is</strong>method we are able to determine various factors that cause tour<strong>is</strong>t arrivalsin the future. Greenidge (2001) used structural time-series modelling(STM) to evaluate tour<strong>is</strong>m <strong>demand</strong> <strong>forecasting</strong> in Barbados. STMmodelling has its own strength, where time-varying components can beincorporated in the regression equation to capture the movement of tour<strong>is</strong>tarrivals using explanatory variables. Besides using basic structuralmodelling (BSM), STM model <strong>is</strong> also able to include general structuralmodelling (GSM) with seasonal effect. Loganathan, Ibrahim and Harun(2008) on the other hand, used standard Johansen-Juselius co-integrationmethod to study the importance of the tour<strong>is</strong>m industry in enhancing tradeperformance and economic development in Malaysia. Thus, these studiesprovide valuable insights into the stylized facts of tour<strong>is</strong>m behaviour andprovide reliable out-of-sample forecasts of tour<strong>is</strong>m <strong>demand</strong>.Athanasopoulos and Hyndman (2008) modelled Australian domestictour<strong>is</strong>m <strong>demand</strong> using regression model, exponential smoothing viainnovations state space model and innovations state space model withexogenous variables. Cross-sectional data was applied in th<strong>is</strong> study, andthe data was collected using computer-ass<strong>is</strong>ted telephone interviews <strong>from</strong>120,000 Australians aged 15 years and above. All the models used in thestudy highlighted the impact of world events on Australian domestictour<strong>is</strong>m. Such events are the increase in business travel immediately afterthe Sydney Olympic in the year 2000 and the significant increase inv<strong>is</strong>iting relatives and friends after the 2002 Bali bombings. Oneinteresting aspect that can be found <strong>from</strong> th<strong>is</strong> study <strong>is</strong> that, all threestat<strong>is</strong>tical models used in th<strong>is</strong> study outperform the Tour<strong>is</strong>m ForecastCommittee (TFC) results for short-term <strong>demand</strong> of Australian domestictour<strong>is</strong>m. Meanwhile, the long-term forecasts results <strong>from</strong> th<strong>is</strong> study alsoindicate that the TFC forecasts may be too optim<strong>is</strong>tic. Finally, <strong>from</strong> theforecasts outputs, th<strong>is</strong> study found that the Australian domestic tour<strong>is</strong>m <strong>is</strong>on the declining stage. Psillak<strong>is</strong>, Panagopoulos and Kanellopoulos (2009)forecasted tour<strong>is</strong>m <strong>demand</strong> in accommodation industry in Greece using370
TOURISMOS: AN INTERNATIONAL MULTIDISCIPLINARY JOURNAL OF TOURISMVolume 7, Number 1, Spring-Summer 2012, pp. 367-381UDC: 338.48+640(050)implemented <strong>forecasting</strong> model and Box-Jenkins approach. Bothapproaches used in th<strong>is</strong> study have its own strength, where the forecastedvalues indicate expected value of the predictor of a future time seriesvalue. Botti et al. (2007) also used a simple econometric model to studythe <strong>demand</strong> for tour<strong>is</strong>m in France, and concluded that tour<strong>is</strong>m <strong>demand</strong> inFrance <strong>is</strong> dependent on available income and relative prices.Unlike most of the tour<strong>is</strong>m <strong>forecasting</strong> studies d<strong>is</strong>cussed earlier,<strong>forecasting</strong> expo <strong>demand</strong> involves both qualitative technique andquantitative <strong>forecasting</strong> models (Lee, Song & Mjelde, 2008). The mainreason to use both techniques <strong>is</strong> because of the limitation of dataavailability. Combining quantitative technique with willingness-to-v<strong>is</strong>it(WTV) surveys, the number of v<strong>is</strong>itors expected to v<strong>is</strong>it internationaltour<strong>is</strong>m expo to be held in Korea in 2012 <strong>is</strong> predicted. Preez and Witt(2003) compared two types of methods to analyze tour<strong>is</strong>m <strong>forecasting</strong>. Intheir study, univariate and multivariate modelling were used separately toforecast tour<strong>is</strong>m <strong>demand</strong> <strong>from</strong> four European countries to Seychelles. Thefindings of the study revealed that the univariate <strong>forecasting</strong> modelsoutperform compare to multivariate models. The empirical result showsthat ARIMA estimation exhibits better <strong>forecasting</strong> performance thanunivariate and multivariate state space modelling. According to Kim andWong (2006), the volatility in tour<strong>is</strong>m <strong>demand</strong> data can be influenced bythe effects of new shocks such as economic cr<strong>is</strong>es, natural d<strong>is</strong>aster or war.In tour<strong>is</strong>m literature, modelling the volatility in tour<strong>is</strong>m <strong>demand</strong> <strong>is</strong>important because it can capture the occurrence of unexpected events.Volatility of tour<strong>is</strong>m <strong>demand</strong> <strong>is</strong> modelled using conditional volatilitymodels, and the models that appears in tour<strong>is</strong>m literature are univariategeneralized autoregressive conditional heterokedasticity (GARCH),univariate asymmetric GARCH, vector autoregressive moving averageGARCH (VARMA-GARCH); and VARMA asymmetry GARCH(VARMA-AGARCH) models (Chan, Lim & McAleer (2005); Kim &Wong (2006); Shareef & McAleer (2005); Shareef & McAleer (2007).In middle of 1990s, dynamic specification such as vector autoregressivemodel (VAR), error correction model (ECM) andautoregressive d<strong>is</strong>tributed lag model (ADLM) began to appear in thetour<strong>is</strong>m literature. VAR model <strong>is</strong> able to accommodate various types ofindependent variables to determine tour<strong>is</strong>t arrivals and <strong>from</strong> there we areable to forecast future tour<strong>is</strong>t arrivals. Besides that, VAR model enablesinnovative use of impulse response analys<strong>is</strong> in tour<strong>is</strong>m context, besidesproviding results on co-integrating analys<strong>is</strong> and <strong>forecasting</strong>. Song andWitt (2004) used VAR model to forecast international tour<strong>is</strong>t flows toMacau for the period <strong>from</strong> 2003 to 2008. The forecast generated by VAR371
Loganathan Nanthakumar, Thirunaukarasu Subramaniam & Mori Kogidmodels suggest that Macau will face increasing tour<strong>is</strong>m <strong>demand</strong> byresidents <strong>from</strong> mainland China. The ECM model had also been used tomeasure tour<strong>is</strong>m <strong>forecasting</strong> but in the recent past, ECM model had beenmodified into vector error correction model (VECM) which can test andimpose weak exogeneity restrictions. Bonham, Gangnes and Zhau (2008)used VECM technique to identify reasonable long-run equilibriumrelationship and took into account Diebold-Mariano tests to demonstratesat<strong>is</strong>factory <strong>forecasting</strong> performance for Hawaii. Beyond the <strong>forecasting</strong>approach used in terms of tour<strong>is</strong>m <strong>demand</strong>, Akal (2010) investigated theeconomic implications of international tour<strong>is</strong>m on Turk<strong>is</strong>h economy. Theincreasing flows of international tour<strong>is</strong>t according to the author will havemany economic implications. In Turkey for instance, the dynamic flowsof international tour<strong>is</strong>ts have increased accommodation facilities; createnew employment in the tour<strong>is</strong>m related industry; increased foreign directinvestment in tour<strong>is</strong>m related industry; and foreign currency has becomemajor source of Turk<strong>is</strong>h economy.The main purpose of th<strong>is</strong> study <strong>is</strong> to provide a much morecomprehensive examination on tour<strong>is</strong>m <strong>forecasting</strong> using seasonalARIMA modelling. However, ex<strong>is</strong>ting literature on <strong>forecasting</strong>international tour<strong>is</strong>m <strong>demand</strong> for Malaysia so far had not adoptedseasonal auto-regressive integrated moving average (SARIMA)modelling. Therefore, th<strong>is</strong> paper intends to fill th<strong>is</strong> gap.DATA AND MODEL SPECIFICATIONData for th<strong>is</strong> study was collected <strong>from</strong> Malaysia tour<strong>is</strong>m arrivalsdataset provided by the Min<strong>is</strong>try of Tour<strong>is</strong>m Malaysia. The time-seriesdata used in th<strong>is</strong> study <strong>is</strong> quarterly data and it covers a period <strong>from</strong>1995:Q1 to 2009:Q4. Th<strong>is</strong> study focuses on the <strong>demand</strong> for tour<strong>is</strong>m inMalaysia <strong>from</strong> ASEAN countries and forecast 4 quarters ahead, which <strong>is</strong>2010:Q1 to 2010:Q4. In th<strong>is</strong> study, we used seasonal ARIMA models toforecast one-period ahead of the series by applying Box-Jenkinsapproach. An ARIMA model <strong>is</strong> a generalization of an ARMA model.These models are fitted to time-series data either to better understand thedata or to predict future points in the series (Chu, 2008a). The model <strong>is</strong>generally referred to as an ARIMA(p,d,q) 4 model where p,d and q areintegers greater than or equal to zero and refers to the order of theautoregressive, integrated and moving average aspects. In th<strong>is</strong> study weapplied Augmented Dickey-Fuller (ADF) and Phillip-Perron (PP)stationary tests to identify the level d in time series of international tour<strong>is</strong>t372
TOURISMOS: AN INTERNATIONAL MULTIDISCIPLINARY JOURNAL OF TOURISMVolume 7, Number 1, Spring-Summer 2012, pp. 367-381UDC: 338.48+640(050)arrivals to Malaysia. The resulting univariate time series model can bewritten as follows:Φ p (L)y t = Φ q (L)ε t , t= p+1, p+2, ..... n (1)with;Φ p (L) = 1- Φ 1L - .....- Φ p L pΦ q (L) = 1- Φ 1L - ..... - Φ q L q (2)Where, the last notational conventional <strong>is</strong> chosen such that the modelin (1) amounts to the following regression model:Y t = Φ 1 y t-1 + .....+ Φ p y t-p + ε t + φ 1 ε t-1 + ..... + φ q ε t-q (3)Therefore, th<strong>is</strong> model <strong>is</strong> called an autoregressive moving averagemodel of order (p,q), or briefly ARMA(p,q). When the y t series replaceddby ∆ 1 yt, we say that y t <strong>is</strong> described by an autoregressive integratedmoving average model of order (p,d,q), or briefly ARIMA(p,d,q). Th<strong>is</strong>can be expressed as Box-Jenkins approach. The autocorrelation functions(ACF) of a time series y t can be define as ρ k = γk/ γ0. Where γ k <strong>is</strong> the korder of auto-covariance of y t , that <strong>is</strong>γk[( y − µ )( y − µ )]= E , k =…..-2,-1,0,1,2….,n (4)tt−kGiven equation (3), it can be seen that autocorrelation holds whenρ 0 =1, ρ -k =ρ k and that -1
Loganathan Nanthakumar, Thirunaukarasu Subramaniam & Mori KogidForecasting SARIMA processes <strong>is</strong> completely analogous to the<strong>forecasting</strong> of ARIMA processes. Th<strong>is</strong> can be expressed asARIMA(p,d,q)4 for quarterly data. Where, ‘p’ indicates the order ofautoregressive operator; ‘d’ are the differences; and ‘q’ are the orders ofmoving average operator of non-seasonal and seasonal componentsrespectively. The first two steps in identifying SARIMA models for a dataset are to find ‘d’ and to create the differenced observations:ytd s D( 1−B) ( 1−B ) X t= (7)In th<strong>is</strong> study we used one-period-ahead <strong>forecasting</strong> using seasonalARIMA modelling. In order to forecast SARIMA model, the meanabsolute percentage error (MAPE) <strong>is</strong> a useful measure to compare theaccuracy of forecasts between different <strong>forecasting</strong> models since itmeasures relative performance. If an error <strong>is</strong> divided by the correspondingobserved value, we have a percentage error. In many empirical studies itappears that, models that tend to do best for within-sample data do notnecessarily forecast better in out-of-the sample. There <strong>is</strong> no strict rule forthat, but empirical experience suggests that it would be better to selectseveral models based on the Akaike Information Criterion (AIC) andevaluate these on the forecasted data. The last evaluation can be based onroot mean square error (RMSE). The RMSE can be expressed as follows:⎡m⎤2RMSE = ( 1−m) ⎢∑( ŷ n + h − yn+h ) ⎥(8)⎢⎣h=1⎥⎦Meanwhile, in previous literatures, mean absolute percentage error(MAPE) was used to determine suitable models. It worth mentioning, thatMAPE <strong>is</strong> not very useful for very small observation (Franses, 1998). TheMAPE can be expressed as follows:⎡m⎤MAPE = ( 1−m) ⎢∑( ŷn+h − yn+h )/yn+h ⎥(9)⎢⎣h=1⎥⎦Therefore, ARIMA-SARIMA model selection in th<strong>is</strong> study <strong>is</strong> basedon AIC forecast evolution results, especially referring to the minimumvalue of RMSE and MAPE.374
TOURISMOS: AN INTERNATIONAL MULTIDISCIPLINARY JOURNAL OF TOURISMVolume 7, Number 1, Spring-Summer 2012, pp. 367-381UDC: 338.48+640(050)EMPIRICAL RESULTSTable 1 summarizes the outcome of the ADF (Augmented Dickey-Fuller) and PP (Phillip-Perron) tests on ASEAN tour<strong>is</strong>t arrivals toMalaysia. The null hypothes<strong>is</strong> tested <strong>is</strong> that the variable underinvestigation has a unit root against the alternative that it does not. Thelag-length <strong>is</strong> chosen using the AIC after testing for first and higher orderserial correlation in the residuals. In Table 1, the null hypothes<strong>is</strong> cannotbe rejected by both ADF and PP tests. However, after applying the firstdifference, both ADF and PP tests reject the null hypothes<strong>is</strong>. As the data<strong>is</strong> found to be stationary after performing ADF and PP tests in firstdifferences, no further tests was performed. In th<strong>is</strong> study we applystationary tests with trend effects. Therefore, the null hypothes<strong>is</strong> <strong>is</strong>rejected in both ADF and PP tests at I(0):Table 1 Stationary Test with Trend for ASEAN Tour<strong>is</strong>t ArrivalLevel: I(0) First Difference: I(1)ADF test (τ)PP test (Z τ )-1.096 (0)-0.732 [13]-9.686 (0)*-11.094 [13]*Note: Lag length in ( ) and Newey-West value using Bartlett kernel in [ ]Aster<strong>is</strong>ks (*) denote stat<strong>is</strong>tically significant at 1% significance levelsOnce stationarity <strong>is</strong> establ<strong>is</strong>hed, examination of the autocorrelationfunction plot (ACF) and partial autocorrelation function (PACF) plot overseveral quarterly lags suggests that autoregressive (AR) and movingaverage (MA) terms should be included in the ARIMA model. Therefore,we used ACF and PACF for tour<strong>is</strong>t arrivals to Malaysia and choose thecombination of ARIMA(p,d,q) to obtain the most suitable SARIMAmodel for th<strong>is</strong> study. The standard procedure for identification,estimation, diagnostic checking and over fitting in a Box-Jenkins analys<strong>is</strong>of time series was performed. The estimation method involved maximumlikelihood parameter estimation to obtain initial estimates and thenunconditional least-squares estimation to obtain final estimates. It <strong>is</strong> afairly common occurrence that differencing a time series introducesmoving average terms into the resulting ARIMA model. Two criteriacommonly applied to select between time series models are the AIC andSBC (Schwarz Bayesian Criteria). Both criteria evaluate the fit versus thenumber of parameters and in th<strong>is</strong> study we used AIC as the main criteriato choose the best combination of ARIMA model. Table 2 indicatesdiagnostic correlogram with ACF and PACF for ARMA(2,2).375
Loganathan Nanthakumar, Thirunaukarasu Subramaniam & Mori Kogid376Table 2 Regression Results and Diagnostic Tests for SARIMAModelsModelsSARIMA(1,1,1)Season-ISeason-IISeason-IIIAR(1)MA(1)AIC valueSARIMA(1,1,2)Season-ISeason-IISeason-IIIAR(1)MA(1)MA(2)AIC valueARIMA(2,1,2)Season-ISeason-IISeason-IIIAR(1)AR(2)MA(1)MA(2)AIC valueCoefficient0.08 (0.24)-0.03 (0.64)0.08 (0.21)0.74 (0.00)*-0.99 (0.00)*-0.680.09 (0.21)-0.02 (0.68)0.09 (0.22)0.81 (0.00)*-1.13 (0.00)*0.14 (0.45)-0.640.08 (0.39)-0.02 (0.68)0.08 (0.40)-0.14 (0.56)0.56 (0.00)*-0.24 (0.38)-0.74 (0.01)*-0.68ARCH-LMTest (a)3.91(0.05)2.21(0.14)1.11(0.29)H o : No serial H o :correlation (b) NormalityTest (c)0.93(0.40)1.12(0.33)1.48(0.24)23.63(0.00)*31.99(0.00)*42.14(0.00)*Note: (a), (b) and (c) indicates Autoregressive conditional heteroscedasticity (ARCH) LMtest, Breusch-Godfrey (BG) serial correlation test and Jarque-Bera (JB) normalitytest. Figures in ( ) indicates probability values. Aster<strong>is</strong>ks (*) denote stat<strong>is</strong>ticallysignificant at 1% significance levels. Season-1 (April-June), Season-2 (July-September), Season-3 (October-December)The flow of ACF and PACF shows the autoregressive effects withfirst difference of the h<strong>is</strong>torical data. Table 2 indicates AIC values and thedec<strong>is</strong>ion to select the most suitable model <strong>is</strong> by comparing the value ofAIC to the ARIMA models used in th<strong>is</strong> study. The smaller the value ofAIC, the better <strong>is</strong> the fit in the ARIMA model used. ThereforeARIMA(2,1,2) <strong>is</strong> relevant because the value of AIC <strong>is</strong> smaller comparedto ARIMA models. Besides that, diagnostics tests are applied in th<strong>is</strong> studyto determine whether the estimated models deviate <strong>from</strong> the assumptions
TOURISMOS: AN INTERNATIONAL MULTIDISCIPLINARY JOURNAL OF TOURISMVolume 7, Number 1, Spring-Summer 2012, pp. 367-381UDC: 338.48+640(050)of standard linear regression model. Further, we tested for autoregressiveconditional heteroscedasticity (ARCH), serial correlation using Breusch-Godfrey (BG) test; and normality using Jarque-Bera (JB) test. Ascorrelogram of squared residuals <strong>from</strong> ARMA(2,2) shows autocorrelationpattern in squared residuals which could be attributed to volatilityclustering, to test the presence of ARCH effect, we compute ARCH-LMtest.The results in Table 2 do not indicate any ARCH effects in all modelsestimated. The Breusch-Godfrey (BG) test of serial correlation indicatesthat serial correlation hypothes<strong>is</strong> cannot be rejected in all three SARIMAmodels. Meanwhile, normality test using Jarque-Bera (JB) indicates thatnormality in the errors <strong>is</strong> rejected in all SARIMA models. Th<strong>is</strong> indicatesthat all three models are not normally d<strong>is</strong>tributed because of someseasonal effects. One interesting results that can be derived <strong>from</strong> Table 2<strong>is</strong> that, although seasonal effects have been taken into account in everySARIMA models, the results does not d<strong>is</strong>play any significant seasonaldummy effects, either positively or negatively.To choose suitable SARIMA model for th<strong>is</strong> study, we use theinequality coefficients technique. The inequality coefficient ofSARIMA(2,1,2) model are marginally smaller than those of theSARIMA(1,1,1) and SARIMA(1,1,2). Therefore ARIMA(2,1,2) <strong>is</strong> thebest SARIMA model for th<strong>is</strong> study. For one-step-ahead <strong>forecasting</strong> which<strong>is</strong> applied in th<strong>is</strong> study, the MA(2) model <strong>is</strong> found to be the best becausethe values of RMSE and MAPE are the lowest as in Table 3 below.Table 3 Summary of Forecast Evolutions of SARIMA ModelsSARIMA ModelsInequality Coefficient SARIMA(1,1,1)SARIMA(1,1,2)SARIMA(2,1,2)RMSE 0.17 0.17 0.16MAE 0.13 0.13 0.12MAPE 302.39 311.97 292.88Theil Coefficient 0.71 0.70 0.68It <strong>is</strong> clear that the dummy variables which represent seasonalityeffects do not give any clear evidence for ASEAN tour<strong>is</strong>t arrivals toMalaysia. Therefore, in order to forecast ASEAN tour<strong>is</strong>t arrivals usingone-period-ahead approach, th<strong>is</strong> study used only ARIMA(2,1,2) modelwithout any seasonal effect to identify the autoregressive (AR) andmoving average (MA) effects. The ARIMA(2,1,2) model that had been377
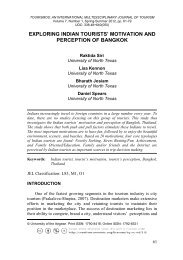
Loganathan Nanthakumar, Thirunaukarasu Subramaniam & Mori Kogidestimated for the sample period can be described as shown in thefollowing equation with standard errors and t-values of the coefficientsgiven in parentheses. Estimated AR(2) and MA(2) are found to besignificant at 1%. It <strong>is</strong> clear that the AR(2) and MA(2) components aresignificant without any seasonal dummies because the dummy variablesdo not determine ASEAN tour<strong>is</strong>t arrivals to Malaysia:∆lnTour t = 0.02 - 0.22∆lnTour t-1 + 0.68∆lnTour<strong>is</strong>t t-2 - 0.08ɛ t-1 - 0.91 ɛ t-2t-stat (7.74)* (-1.79) (5.93)* (-0.84) (-9.77)*It worth mentioning that once we accept ARIMA(2,1,2) as a suitablemodel for th<strong>is</strong> study, the model <strong>is</strong> used for <strong>forecasting</strong> purpose. Weapplied ARIMA(2,1,1) to forecast one-period ahead using h<strong>is</strong>torical data1995:Q1 to 2009:Q4 and forecast the short-term period 2010:Q1 to2010:Q4 of tour<strong>is</strong>t arrivals to Malaysia. Figure 4 shows the forecastedASEAN tour<strong>is</strong>t arrivals to Malaysia using ARIMA(2,1,2) with one-periodahead <strong>forecasting</strong> method. Usage of quarterly data with short term<strong>forecasting</strong>, one-period-ahead procedure provides a slightly better forecastfor Malaysia.70000600005000040000300002000010000018.08018.15223.49639.21222.27415.75616.65266.19128.55122.85418.91417.838Jan Feb Mac Apr May Jun July Aug Sept Oct Nov DecLower (95%) Forecasted Upper (95%)378Figure 5 One-Period Ahead Forecasted ASEAN Tour<strong>is</strong>t Arrival(2010:Q1- 2010:Q4)CONCLUSION
TOURISMOS: AN INTERNATIONAL MULTIDISCIPLINARY JOURNAL OF TOURISMVolume 7, Number 1, Spring-Summer 2012, pp. 367-381UDC: 338.48+640(050)To conclude, th<strong>is</strong> study found that SARIMA(2,1,2) <strong>is</strong> not able tocapture seasonality effects in predicting ASEAN tour<strong>is</strong>t arrivals toMalaysia because seasonality does not have an effect on the numbers ofASEAN tour<strong>is</strong>t arrivals to Malaysia and there <strong>is</strong> only autoregressive andmoving average effects that appeared using ARIMA(2,1,2). The empirical<strong>forecasting</strong> method used in th<strong>is</strong> study produces best fit ARIMA andSARIMA model and <strong>from</strong> a planning perspective th<strong>is</strong> should be a majorresearch theme in the study of international tour<strong>is</strong>m <strong>demand</strong>. Further,incorporation of forecasts into dec<strong>is</strong>ion making processes would ass<strong>is</strong>tdevelopment and investment strategies in tour<strong>is</strong>m industry in the future.REFERENCESAkal, M. (2004). Forecasting Turkey’s tour<strong>is</strong>m revenues by ARMAX model.Tour<strong>is</strong>m Management, Vol. 25, No.5, pp.565-580.Akal, M. (2010). Economic implications of international tour<strong>is</strong>m on Turk<strong>is</strong>heconomy. TOURISMOS, Vol. 5, No.1, pp.131-152.Botti, L., Peypoch, N., Randriamboar<strong>is</strong>on, R. & Solonandrasana, B. (2007). Aneconometric model of tour<strong>is</strong>m <strong>demand</strong> in France. TOURISMOS, Vol. 2,No.1, pp.115-126.Athanasopoulos, G. & Hyndman, R.J. (2008). Modeling and <strong>forecasting</strong>Australian domestic tour<strong>is</strong>m. Tour<strong>is</strong>m Management, Vol. 29, pp.19-31.Bonham, C., Gangnes, B. & Zhau, T. (2008). Modeling tour<strong>is</strong>m: a fully identifiedVECM approach. International Journal of Forecasting, Vol. 25, No.3,pp.531-549.Chan, F., Lim, C. & McAleer, M. (2005). Modeling multivariate internationaltour<strong>is</strong>m <strong>demand</strong> and volatility. Tour<strong>is</strong>m Management, Vol. 26, No.3,pp.459-471.Chu, F.L. (2008a). Forecasting tour<strong>is</strong>m <strong>demand</strong> with ARMA-based methods.Tour<strong>is</strong>m Management, Vol. 30, No.2, pp.740-751.Chu, F.L. (2008b). Analyzing and <strong>forecasting</strong> tour<strong>is</strong>m <strong>demand</strong> with ARARalgorithm. Tour<strong>is</strong>m Management, Vol. 29, No.6, pp.1185-1196.Coshall, J.T. (2009). Combining volatility and smoothing forecasts of UK <strong>demand</strong>for international tour<strong>is</strong>m. Tour<strong>is</strong>m Management, Vol. 30, No.4, pp.495-511.Franses, P.H. (1998). Time-series models for business and economic <strong>forecasting</strong>.United Kingdom, Cambridge University Press.Greenidge, K. (2001). Forecasting tour<strong>is</strong>m <strong>demand</strong>. An STM approach. Annals ofTour<strong>is</strong>m Research, Vol. 28, No.1, pp.8-112.Josiam, M.B., Sohail, M.S. & Monteiro A.P. (2007). Curry cu<strong>is</strong>ine: Perceptions ofIndian restaurants in Malaysia. TOURISMOS, Vol. 2, No.2, pp.25-37.379
Loganathan Nanthakumar, Thirunaukarasu Subramaniam & Mori KogidKim, J.H. & Wong, K.F. (2006). Effects of news shocks on inbound tour<strong>is</strong>ts<strong>demand</strong> volatility in Korea. Journal of Travel Research, Vol. 44, No.4,pp.457-466.Kulendran, N. & Witt, S. F. (2001). Cointegration versus least squares regression.Annals of Tour<strong>is</strong>m Research, Vol. 28, No.2, pp.291-311.Lee, C.K., Song, H.J. & Mjelde, J.W. (2008). The <strong>forecasting</strong> of internationalexpo tour<strong>is</strong>m using quantitative and qualitative techniques. Tour<strong>is</strong>mManagement, Vol. 29, No.6, pp.1084-1098.Loganathan, N., Ibrahim, Y. & Harun, M. (2008). Tour<strong>is</strong>m development policy,strategic alliances and impact of consumer price index on tour<strong>is</strong>t arrivals:the case of Malaysia. TOURISMOS, Vol. 3, No.1, pp.83-98.Psillak<strong>is</strong>, Z., Panagopoulos, A. & Kanellopoulos, D. (2009). Low cost inferential<strong>forecasting</strong> and tour<strong>is</strong>m <strong>demand</strong> in accommodation industry.TOURISMOS, Vol. 4, No.2, pp.47-68.Preez, J. & Witt, S.F. (2003). Univariate versus multivariate time series<strong>forecasting</strong>: an application to international tour<strong>is</strong>m <strong>demand</strong>. InternationalJournal of Forecasting, Vol. 19, No.3, pp.435-451.Shareef, R. & McAleer, M. (2005). Modeling international tour<strong>is</strong>m <strong>demand</strong> andvolatility in small <strong>is</strong>land tour<strong>is</strong>m economics. International Journal ofTour<strong>is</strong>m Research, Vol. 7, No.6, pp.313-333.Shareef, R. & McAleer, M. (2007). Modeling the uncertainty in monthlyinternational tour<strong>is</strong>t arrivals to the Maldives. Tour<strong>is</strong>m Management, Vol.28, No.1, pp.23-45.Song, H., Wong, K.F. & Chon, K.S. (2003). Modeling and <strong>forecasting</strong> the <strong>demand</strong>for Hong Kong Tour<strong>is</strong>m. Hospitality Management, Vol. 22, pp.435-451.Wong, K., Song, H., Witt, S.F. & Wu, D.C. (2007). Tour<strong>is</strong>m <strong>forecasting</strong>: tocombine or not to combine? Tour<strong>is</strong>m Management, Vol. 28, pp.1068-1078.World Tour<strong>is</strong>m Organization (WTO). Http//:www.unwto.org.tr. Accessed the 1 stof October 2010, 10:15.SUBMITTED: JAN 2011REVISION SUBMITTED: MAY 2011ACCEPTED: JUN 2011REFEREED ANONYMOUSLYNanthakumar Loganathan (kumar@umt.edu.my) <strong>is</strong> a Senior Lecturer atDepartment of Economics, Faculty of Management and Economics,Universiti Malaysia Terengganu, 21030 Kuala Terengganu, Terengganu,Malaysia.380
TOURISMOS: AN INTERNATIONAL MULTIDISCIPLINARY JOURNAL OF TOURISMVolume 7, Number 1, Spring-Summer 2012, pp. 367-381UDC: 338.48+640(050)Thirunaukarasu Subramaniam (stkarasu@um.edu.my) <strong>is</strong> a SeniorLecturer at Department of Southeast Asian Studies, Faculty of Arts andSocial Sciences, University of Malaya, 50603 Kuala Lumpur, Malaysia.Mori Kogid (edy@ums.edu.my) <strong>is</strong> a Lecturer at School of Business andEconomics, Universiti Malaysia Sabah, 88400 Kota Kinabalu, Sabah,Malaysia.381