- Page 1:
Product GuideRevision AMcAfee Data
- Page 6 and 7:
ContentsFind host names in data at
- Page 8 and 9:
ContentsDelete views . . . . . . .
- Page 10 and 11:
ContentsTypical scenarios . . . . .
- Page 12 and 13:
Contents12 McAfee Data Loss Prevent
- Page 14 and 15:
PrefaceFind product documentationTi
- Page 16 and 17:
1McAfee DLP ManagerMcAfee DLP data
- Page 18 and 19:
2Using McAfee DLP MonitorHow data i
- Page 20 and 21:
2Using McAfee DLP MonitorTypical sc
- Page 22 and 23:
2Using McAfee DLP MonitorTypical sc
- Page 24 and 25:
2Using McAfee DLP MonitorTypical sc
- Page 26 and 27:
2Using McAfee DLP MonitorSearch bas
- Page 28 and 29:
2Using McAfee DLP MonitorUsing logi
- Page 30 and 31:
2Using McAfee DLP MonitorSupported
- Page 32 and 33:
2Using McAfee DLP MonitorSupported
- Page 34 and 35:
2Using McAfee DLP MonitorSupported
- Page 36 and 37:
2Using McAfee DLP MonitorSupported
- Page 38 and 39:
2Using McAfee DLP MonitorRules used
- Page 40 and 41:
2Using McAfee DLP MonitorFinding in
- Page 42 and 43:
2Using McAfee DLP MonitorFinding in
- Page 44 and 45:
2Using McAfee DLP MonitorUse concep
- Page 46 and 47:
2Using McAfee DLP MonitorFind data
- Page 48 and 49:
2Using McAfee DLP MonitorFind data
- Page 50 and 51:
2Using McAfee DLP MonitorFind data
- Page 52 and 53:
2Using McAfee DLP MonitorSearching
- Page 54 and 55:
2Using McAfee DLP MonitorSearching
- Page 56 and 57:
2Using McAfee DLP MonitorSearching
- Page 58 and 59:
2Using McAfee DLP MonitorSearching
- Page 60 and 61:
2Using McAfee DLP MonitorSearching
- Page 62 and 63:
2Using McAfee DLP MonitorSearching
- Page 64 and 65:
2Using McAfee DLP MonitorFinding do
- Page 66 and 67:
3Managing McAfee DLP PreventHow McA
- Page 68 and 69:
3Managing McAfee DLP PreventConfigu
- Page 70 and 71:
3Managing McAfee DLP PreventConfigu
- Page 72 and 73:
4Using McAfee DLP DiscoverTypical s
- Page 74 and 75:
4Using McAfee DLP DiscoverTypical s
- Page 76 and 77:
4Using McAfee DLP DiscoverRegisteri
- Page 78 and 79:
4Using McAfee DLP DiscoverRegisteri
- Page 80 and 81:
4Using McAfee DLP DiscoverCrawling
- Page 82 and 83:
4Using McAfee DLP DiscoverCrawling
- Page 84 and 85:
4Using McAfee DLP DiscoverCrawling
- Page 86 and 87:
4Using McAfee DLP DiscoverOptimizin
- Page 88 and 89:
4Using McAfee DLP DiscoverOptimizin
- Page 90 and 91:
4Using McAfee DLP DiscoverManaging
- Page 92 and 93:
4Using McAfee DLP DiscoverManaging
- Page 94 and 95:
4Using McAfee DLP DiscoverManaging
- Page 96 and 97:
4Using McAfee DLP DiscoverManaging
- Page 98 and 99:
4Using McAfee DLP DiscoverManaging
- Page 100 and 101:
4Using McAfee DLP DiscoverManaging
- Page 102 and 103:
4Using McAfee DLP DiscoverManaging
- Page 104 and 105:
4Using McAfee DLP DiscoverScan stat
- Page 106 and 107:
4Using McAfee DLP DiscoverManaging
- Page 108 and 109:
4Using McAfee DLP DiscoverSearch di
- Page 110 and 111:
4Using McAfee DLP DiscoverSearch di
- Page 112 and 113:
4Using McAfee DLP DiscoverSearch di
- Page 114 and 115:
4Using McAfee DLP DiscoverRemediati
- Page 116 and 117:
4Using McAfee DLP DiscoverRemediati
- Page 118 and 119:
4Using McAfee DLP DiscoverRemediati
- Page 120 and 121:
4Using McAfee DLP DiscoverRemediati
- Page 122 and 123:
4Using McAfee DLP DiscoverGetting s
- Page 124 and 125:
4Using McAfee DLP DiscoverGetting s
- Page 126 and 127: 4Using McAfee DLP DiscoverConfiguri
- Page 128 and 129: 4Using McAfee DLP DiscoverConfiguri
- Page 130 and 131: 5Integrating McAfee DLP EndpointTyp
- Page 132 and 133: 5Integrating McAfee DLP EndpointTyp
- Page 134 and 135: 5Integrating McAfee DLP EndpointTyp
- Page 136 and 137: 5Integrating McAfee DLP EndpointTyp
- Page 138 and 139: 5Integrating McAfee DLP EndpointVie
- Page 140 and 141: 5Integrating McAfee DLP EndpointCon
- Page 142 and 143: 5Integrating McAfee DLP EndpointUni
- Page 144 and 145: 5Integrating McAfee DLP EndpointUni
- Page 146 and 147: 5Integrating McAfee DLP EndpointUni
- Page 148 and 149: 5Integrating McAfee DLP EndpointTag
- Page 150 and 151: 5Integrating McAfee DLP EndpointTag
- Page 152 and 153: 5Integrating McAfee DLP EndpointTag
- Page 154 and 155: 5Integrating McAfee DLP EndpointTag
- Page 156 and 157: 5Integrating McAfee DLP EndpointTag
- Page 158 and 159: 5Integrating McAfee DLP EndpointTag
- Page 160 and 161: 5Integrating McAfee DLP EndpointCon
- Page 162 and 163: 5Integrating McAfee DLP EndpointCon
- Page 164 and 165: 5Integrating McAfee DLP EndpointCon
- Page 166 and 167: 5Integrating McAfee DLP EndpointCon
- Page 168 and 169: 5Integrating McAfee DLP EndpointCon
- Page 170 and 171: 5Integrating McAfee DLP EndpointCon
- Page 172 and 173: 6Managing the Home pageHow the Home
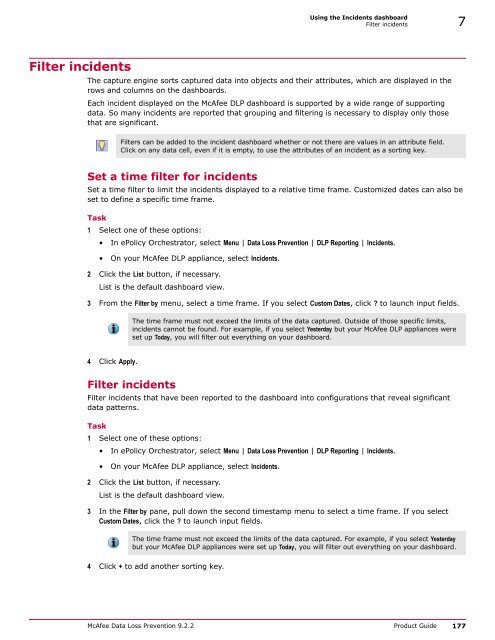
- Page 174 and 175: 7Using the Incidents dashboardTypic
- Page 178 and 179: 7Using the Incidents dashboardGetti
- Page 180 and 181: 7Using the Incidents dashboardGetti
- Page 182 and 183: 7Using the Incidents dashboardSet u
- Page 184 and 185: 7Using the Incidents dashboardGener
- Page 186 and 187: 7Using the Incidents dashboardCusto
- Page 188 and 189: 7Using the Incidents dashboardContr
- Page 190 and 191: 8Working with casesManage case perm
- Page 192 and 193: 8Working with casesAdd, delete, or
- Page 194 and 195: 8Working with casesModify casesYou
- Page 196 and 197: 8Working with casesCustomize cases3
- Page 198 and 199: 8Working with casesCustomize cases4
- Page 200 and 201: 9Managing policies and rulesHow pol
- Page 202 and 203: 9Managing policies and rulesTypical
- Page 204 and 205: 9Managing policies and rulesTypical
- Page 206 and 207: 9Managing policies and rulesManagin
- Page 208 and 209: 9Managing policies and rulesAdd, mo
- Page 210 and 211: 9Managing policies and rulesAdd, mo
- Page 212 and 213: 9Managing policies and rulesManage
- Page 214 and 215: 9Managing policies and rulesManage
- Page 216 and 217: 9Managing policies and rulesManage
- Page 218 and 219: 9Managing policies and rulesIdentif
- Page 220 and 221: 9Managing policies and rulesIdentif
- Page 222 and 223: 10Managing action rulesHow McAfee D
- Page 224 and 225: 10Managing action rulesAdd, modify,
- Page 226 and 227:
10Managing action rulesAdd, modify,
- Page 228 and 229:
10Managing action rulesAdd, modify,
- Page 230 and 231:
10Managing action rulesAdd, modify,
- Page 232 and 233:
11Managing conceptsTypical scenario
- Page 234 and 235:
11Managing conceptsAdd, apply, rest
- Page 236 and 237:
11Managing conceptsAdd, apply, rest
- Page 238 and 239:
11Managing conceptsAdd, apply, rest
- Page 240 and 241:
12Using templatesTypical scenariosT
- Page 242 and 243:
12Using templatesAdd, modify, and d
- Page 244 and 245:
12Using templatesAdd, modify, and d
- Page 246 and 247:
13Managing McAfee DLP systemsConfig
- Page 248 and 249:
13Managing McAfee DLP systemsConfig
- Page 250 and 251:
13Managing McAfee DLP systemsUsing
- Page 252 and 253:
13Managing McAfee DLP systemsUsing
- Page 254 and 255:
13Managing McAfee DLP systemsUsing
- Page 256 and 257:
13Managing McAfee DLP systemsUsing
- Page 258 and 259:
13Managing McAfee DLP systemsAdding
- Page 260 and 261:
13Managing McAfee DLP systemsAdding
- Page 262 and 263:
13Managing McAfee DLP systemsAdding
- Page 264 and 265:
13Managing McAfee DLP systemsAdding
- Page 266 and 267:
13Managing McAfee DLP systemsAdding
- Page 268 and 269:
13Managing McAfee DLP systemsAdding
- Page 270 and 271:
13Managing McAfee DLP systemsAdding
- Page 272 and 273:
13Managing McAfee DLP systemsUsing
- Page 274 and 275:
13Managing McAfee DLP systemsManagi
- Page 276 and 277:
13Managing McAfee DLP systemsManagi
- Page 278 and 279:
13Managing McAfee DLP systemsManagi
- Page 280 and 281:
13Managing McAfee DLP systemsTechni
- Page 282 and 283:
13Managing McAfee DLP systemsTechni
- Page 284 and 285:
14Disaster recovery backup and rest
- Page 286 and 287:
14Disaster recovery backup and rest
- Page 288 and 289:
14Disaster recovery backup and rest
- Page 290 and 291:
15Technical supportCreate a technic
- Page 292 and 293:
Indexdevice class (continued)status
- Page 294 and 295:
Indexuser groupscreating 275deletin