Preparation and LC/MS Analysis of Oligonucleotide ... - Phenomenex
Preparation and LC/MS Analysis of Oligonucleotide ... - Phenomenex
Preparation and LC/MS Analysis of Oligonucleotide ... - Phenomenex

Create successful ePaper yourself
Turn your PDF publications into a flip-book with our unique Google optimized e-Paper software.
MaterialsAll chemicals <strong>and</strong> reagents were purchased from SigmaChemicals (St. Louis, MO, USA) unless otherwise stated.<strong>Oligonucleotide</strong> samples were either purchased fromIntegrated DNA Technologies (Coralville, IA, USA) orgenerously provided by various industry <strong>and</strong> academicsources (ISIS: Carlsbad, CA, USA; USC <strong>Oligonucleotide</strong>Laboratory: Los Angeles, CA, USA). HP<strong>LC</strong> solventswere purchased from EMD (San Diego, CA, USA).Serum, plasma, <strong>and</strong> specific mouse organ tissues werepurchased from Bioreclamation (Liverpool, NY, USA).
Methods<strong>Oligonucleotide</strong>s were spiked into plasma <strong>and</strong> tissueto show the utility <strong>of</strong> the protocol. Equal aliquots <strong>of</strong> theClarity ® OTX loading buffer (<strong>Phenomenex</strong>, Torrance,CA, USA) <strong>and</strong> serum/plasma samples were mixedtogether prior to loading on the SPE cartridge. TheSPE isolation cartridge (Clarity OTX 100 mg/ 3 mL tube)was first “wetted” with methanol then equilibrated withClarity OTX equilibration buffer (10 mM Phosphate pH5.5) prior to sample loading. After sample loading thecartridge was rinsed twice with equilibration bufferfollowed by rinses with Clarity OTX wash buffer (10 mMPhosphate pH 5.5/ 50 % acetonitrile). The oligonucleotidewas eluted from the cartridge using elution buffer (100mM ammonium bicarbonate pH 8.0/ 40 % acetonitrile/10 % tetrahydr<strong>of</strong>uran). Samples can be either lyophilized orspeed vac evaporated before reconstitution for <strong>LC</strong> analysis.For tissue samples either proteinase K digestion (3 hours)or a combination <strong>of</strong> mechanical homogenization <strong>and</strong>digestion was used to break intercellular <strong>and</strong> extracellularmatrices prior to mixing with loading buffer.For <strong>LC</strong>-UV analysis samples were injected on an Agilent ®HP1100 HP<strong>LC</strong> (Palo Alto CA, USA) using a Clarity 3 µmOligo-RP ® or Clarity 2.6 µm Oligo-<strong>MS</strong> HP<strong>LC</strong> column(<strong>Phenomenex</strong>, Torrance, CA, USA). For <strong>LC</strong>/<strong>MS</strong> analysis,samples were either detected using a AB Sciex API3000 (AB Sciex, Foster City, CA, USA) at <strong>Phenomenex</strong>or analyzed at Novatia using a Novatia Oligo HTCS HP<strong>LC</strong>system (Monmouth Junction, NJ, USA) connected to aLTQ ® Orbitrap ® mass spectrometer (San Jose, CA, USA).<strong>Oligonucleotide</strong> ion spectra were reconstructed using theproMass ® s<strong>of</strong>tware (Novatia). A gradient separation methodusing an aqueous mobile phase A <strong>of</strong> 8 mM triethylamine/200 mM Hexafluoroisopropanol (pH 8.0) <strong>and</strong> organicmobile phase B <strong>of</strong> acetonitrile. Various gradients wereused depending on the column <strong>and</strong> instrument being usedas well as the specific oligonucleotide being analyzed.
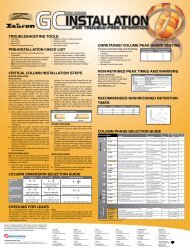
Figure 1. General Schematic for <strong>Oligonucleotide</strong>Isolation from Different Biological SamplesPlasmaSampleLoad (up to 1mL)1:1 Biological Fluid/Loading-Lysis bufferCartridgeEquilibrationSampleLoadWash 1Wash 2ElutionMethanol(1 mL)Equilibrationbuffer (1 mL)Load (up to 1 mL) 1:1tissue homogenate/Loading-Lysis bufferEquilibration buffer(1 ml)Salt removalSugar removalWash buffer (1 mL)Protein removalLipid removalElution buffer(0.5 mL)Oligo elutionTissueHomogenizationReconstitution100 mg liver tissue3 hr Protease K digestLiver TissueMechanicalHomogenizationMuscleor LungTissue<strong>LC</strong>/<strong>MS</strong><strong>Analysis</strong>
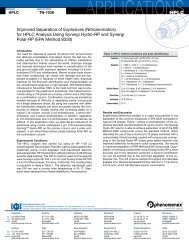
Figure 2. Recovery Studies from PlasmamAUArea: 53280Area: 532<strong>Oligonucleotide</strong> Extracted from From Plasma4000 5 10 15 20Area: 546mAUmin80Control <strong>Oligonucleotide</strong>Control <strong>Oligonucleotide</strong>Area: 5464000 5 10 15 20minFigure 2: Recovery <strong>and</strong> cleanup <strong>of</strong> a 27mer DNA phosphorothioate oligonucleotide from plasmausing the Clarity OTX protocol. <strong>Oligonucleotide</strong> was spiked into a plasma sample, extracted, <strong>and</strong>compared to a control. Recovery is estimated at 97 % with only minor plasma contaminants.
Figure 3. Linearity Studies from TissuemAU10010 μg oligo in 1 g liver tissue19merOligoInternalStd.50mAU100502 4 6 8100 µg oligo in 1 g liver tissueminmAU100502 4 6 8100 µg oligo <strong>and</strong> 100 µg internalst<strong>and</strong>ardmin2 4 6 8minFigure 3: UV chromatograms <strong>of</strong> oligonucleotide extracted from liver tissue using Clarity OTX. The19mer extracted phosphorothioate oligonucleotide was spiked with 10 µg <strong>of</strong> a oligonucleotideinternal st<strong>and</strong>ard before <strong>LC</strong>/<strong>MS</strong> analysis. The top two chromatograms represent different levels <strong>of</strong>the incubated P-S oligo. The bottom chromatogram is a external st<strong>and</strong>ard <strong>of</strong> equal amounts <strong>of</strong> the19mer oligo <strong>and</strong> internal st<strong>and</strong>ard. Note the high recovery <strong>of</strong> the oligonucleotide <strong>and</strong> low level <strong>of</strong>plasma contaminants from the incubated samples.
Figure 4. Clarity OTX: Speed-Vac Oligo Recovery19mermAU250200150100Control Oligo5.2965004.7230 2 4 6 8 10 12minmAU250200150100Near Dryness5.232504.66200 2 4 6 8 10 12minmAU250Speed Vac Dry200150100504.5405.206App ID 1971100 2 4 6 8 10 12minColumn: Clarity 3 µm Oligo-RPDimensions: 50 x 2.0 mmPart No. 00B-4441-B0Mobile Phase: A: 8 mm Tetraethylammonium / 200 mm HFIPB: AcetonitrileGradient:Time (min) % B0 510 350.3 mL/minFlow Rate:Temperature. AmbientDetection: UV @ 260 nmBackpressure: 200 barSample: 19 mer RNA oligonucleotideFigure 4: Speed-vac effect on oligonucleotide recovery. An oligonucleotide st<strong>and</strong>ard (top chromatogram)is compared to samples that are concentrated using a speed-vac evaporator. The middlechromatogram is <strong>of</strong> the oligonucleotide evaporated to near dryness <strong>and</strong> little loss in recovery is observed.In the bottom chromatogram the oligonucleotide is evaporated to dryness. Significant loss inrecovery is observed when an oligonucleotide is speed-vac evaporated to dryness.
Figure179655. Balancing <strong>LC</strong> Retention Versus IonpairingIon Suppression2.8e72.4e7Intensity, cps2.0e71.6e71.2e78.0e6App ID 179654.0e68 1012 14 16 18 20 22 minFigure 5: Ion-pairing concentration effects on <strong>LC</strong>/<strong>MS</strong> sensitivity <strong>and</strong> resolution. A 12-18 poly dToligonucleotide st<strong>and</strong>ard is run on a Clarity Oligo-RP column using different ion-pairing concentrations:Black trace = 15 mM TEA/ 400 mM HFIP, Green trace= 2.8 mM TEA/ 280 mM HFIP, Red trace= 4 mM TEA/ 100 mm HFIP, Blue trace = 2 mM TEA/ 50 mM HFIP. Retention, resolution <strong>and</strong> <strong>MS</strong>signal intensity appear optimal between 4-8 mM TEA <strong>and</strong> 200-300 mM HFIP.
Figure 6. Sensitivity Studies with RNATIC <strong>of</strong> a 500 ng extractionXIC <strong>of</strong> a 50 ng extraction1.3E+0081.1E+008A1.4E+0061.1E+006B14.31: 66158.0E+0078.4E+005Intensity5.4E+007Intensity5.6E+0052.7E+00714.31: 66162.8E+0054.8 9.614.4 19.224 min4.8 9.614.4 19.224 minFigure 6: Sensitivity <strong>and</strong> <strong>MS</strong> analysis parameters. The total ion chromatogram <strong>of</strong> 500 ng/mL <strong>of</strong>a 19mer oligonucleotide extracted from plasma is shown in chromatogram 6A. Note the low levelpeak corresponding to the oligonucleotide at RT <strong>of</strong> 14.3 minutes. The extracted ion chromatogram(-7 charge state ion at m/z <strong>of</strong> 944) <strong>of</strong> a 50 ng/mL sample is shown in chromatogram 6B. Selectedanalysis <strong>of</strong> specific ions can realize large increases in sensitivity compared to st<strong>and</strong>ard <strong>MS</strong> methods.
Figure 7. Spectra <strong>of</strong> Extracted P-S <strong>Oligonucleotide</strong>4.3E+007944.2-7A3.4E+007A Raw SpectraIntensity2.6E+0071.7E+007826.0-8A8.5E+0061101.7-6A724.1-9A0.0E+000500 6808591039 1218 1398 min6.0E+0076616.34.8E+007Intensity3.6E+007BReconstructed Spectra2.4E+0071.2E+0076638.86482.80.0E+0005860 616064606760 7060 7360 minFigure 7: Using deconvolution s<strong>of</strong>tware to identify metabolites. The raw spectra from 19meroligonucleotide in A is compared to the reconstructed spectra in B. Note reconstructed massesfor the oligonucleotide <strong>of</strong> interest at MW=6616 as well as a minor component corresponding to adepurinated oligonucleotide at MW=6482. Deconvolution s<strong>of</strong>tware is required to identify low levelmetabolites <strong>of</strong> oligonucleotides.
Results <strong>and</strong> Discussion<strong>Oligonucleotide</strong> IsolationA simple mixed-mode SPE-based protocol hasbeen developed (Clarity OTX) to isolate therapeuticoligonucleotides from biological matrices (Figure 1) 2,3 .<strong>Oligonucleotide</strong>-containing serum or plasma samplestreated with the chaotrope/detergent buffer are loadedon to a mixed-mode SPE sorbent around pH 5.5. Fortissue samples a proteinase K digest <strong>and</strong>/or mechanicalhomogenization was used to break up tissues prior tochemical disruption. After low pH washes, elution <strong>of</strong> theoligonucleotide is achieved with moderate organic at anelevated pH (pH ~8). Tight pH control is critical throughoutthe process; DNA extended exposure below pH 5 resultsin depurination <strong>and</strong> RNA exposure above pH 9 can leadto 2’-3’ isomerization <strong>of</strong> the ribose sugar.An example chromatogram <strong>of</strong> the effectiveness <strong>of</strong>cleanup is shown in figure 2. HP<strong>LC</strong> chromatograms <strong>of</strong>a phosphorothioate 27mer DNA oligonucleotide spikedinto plasma <strong>and</strong> purified using the Clarity OTX protocolis compared against a control oligonucleotide. Almostcomplete recovery (97 %) <strong>of</strong> the oligonucleotide isobtained with only small amounts <strong>of</strong> matrix contaminantseen in the chromatogram at retention times far awayfrom most oligonucleotides <strong>and</strong> their metabolites. Aexample <strong>of</strong> isolating oligonucleotide out <strong>of</strong> liver is shownin figure 3, where different levels <strong>of</strong> a 19mer oligo wasspiked along with an internal st<strong>and</strong>ard into a liver sample.Recoveries have ranged between 65-99 % dependingon the oligonucleotide <strong>and</strong> biological matrix used for theisolation with good linearity for a specific oligonucleotide<strong>and</strong> biological matrix type 4 . While for some “s<strong>of</strong>t” tissuelike liver, simple digestion is sufficient to disrupt a tissue,“hard” tissue like muscle <strong>and</strong> lung require additionalhomogenization. Initial studies suggest that mechanicaldisruption with detergent is required either with or withoutproteinase K digestion (data not shown).Additional studies were undertaken to better underst<strong>and</strong>some <strong>of</strong> the factors in sample recovery. A speedvacevaporator is typically used to concentrate theoligonucleotide prior to injection on HP<strong>LC</strong>. Commonpractice is to evaporate a sample to dryness beforereconstitution in mobile phase. However, this appearsto affect the recovery <strong>of</strong> the oligonucleotide whencompared to a sample that is only evaporated to neardryness. Figure 4 demonstrates this convincingly.Sample evaporated to “full dryness” showed significantloss in recovery versus the “near-dryness” sample whichdemonstrated good recovery 5 . Based on such results,speed-vac evaporation should be avoided for low-leveloligonucleotide isolation techniques. Lyophilizationappears to be robust alternative for concentratingsamples without similar deleterious effects.<strong>LC</strong>/<strong>MS</strong> <strong>Analysis</strong> <strong>of</strong> <strong>Oligonucleotide</strong>s<strong>Oligonucleotide</strong>s are typically analyzed by <strong>LC</strong>/<strong>MS</strong>using an ion-pairing reversed phase method where amixture <strong>of</strong> HFIP <strong>and</strong> TEA is used to elicit retention <strong>of</strong> thepolar polyanionic molecule 6,7,8 . In <strong>LC</strong>/<strong>MS</strong> applications,ion-pairing retention must be balanced against ionsuppression to maximize <strong>MS</strong> sensitivity. An example <strong>of</strong>this effect is shown in figure 5 where different levels <strong>of</strong>ion-pairing buffer were used in the mobile phase <strong>of</strong> a<strong>LC</strong>/<strong>MS</strong> run <strong>of</strong> a mixture <strong>of</strong> oligonucleotide st<strong>and</strong>ards.Maximizing <strong>MS</strong> sensitivity becomes a balance betweenion suppression <strong>and</strong> retention; higher concentrations <strong>of</strong>ion-pairing buffer result in greater retention <strong>and</strong> resolution<strong>of</strong> oligonucleotides, but only to a certain point.While optimizing mobile phase conditions is important,the mass spectrometer <strong>and</strong> data collection parameterscan have a much larger influence. An example <strong>of</strong> thisis shown in figure 6 where different levels <strong>of</strong> a 19merphosphorothioate RNA oligonucleotide isolated fromplasma samples using the Clarity OTX protocol were runon the Oligo HTCS system connected to an Orbitrap <strong>MS</strong>.Using extracted ions shows the 50 ng/mL level is far fromthe detection limit for this application.<strong>Oligonucleotide</strong> analysis requires deconvolutions<strong>of</strong>tware for the identification <strong>of</strong> oligonucleotides. Thiscan be especially important when looking for low-levelmetabolites <strong>of</strong> oligonucleotide therapeutics, whichcorrespond to unique molecular weights. An example<strong>of</strong> this is shown in figure 7 where the spectrum <strong>of</strong> the19mer P-S RNA oligonucleotide is displayed in raw<strong>and</strong> reconstructed mode. The raw spectra in figure 7Ashow the predominant -6, -7, <strong>and</strong> -8 <strong>of</strong> the expectedoligonucleotide; however, one cannot discern thepresence <strong>of</strong> any metabolites in the sample based on thespectra. However, when the spectra is reconstituted usingthe ProMass s<strong>of</strong>tware (Figure 7B), one can identify lowlevelmasses that correspond to a salt adduct as well asa depurinated oligonucleotide. Such results demonstratethe utility <strong>of</strong> deconvolution s<strong>of</strong>tware for oligonucleotideanalysis.
References1. G. Zhang, J. Lin, K Srinivasan, O. Kavetskaia, <strong>and</strong> J. Duncan. Journal <strong>of</strong> AnalyticalChemistry 79(9) p3416-3424, 20072. Tanya A. Watanabe, Richard S. Geary, Arthur A. Levin. <strong>Oligonucleotide</strong>s 16(2): p169-180, 20063. Antisense drug technology: principles, strategies, <strong>and</strong> applications. Edited by StanleyT. Crooke, CRC Press, p189-199, 20074. G. Scott, H. Gauss, B. Rivera, <strong>and</strong> M. McGinley. “Rapid Extraction <strong>of</strong> <strong>Oligonucleotide</strong>sfrom Primary Tissues for <strong>LC</strong>/<strong>MS</strong> <strong>Analysis</strong>…” Poster Presentation from Tides 2009Conference, Las Vegas, NV, May 17-20, 2009.5. K. Speicher, O. Kolbas, S. Harper, <strong>and</strong> D. Speicher. Journal <strong>of</strong> Biomolecular Techniques11:p74-86, 20006. A. Apffel, J. Chakel, S. Fisher, K. Lichtenwalter, W. Hancock. Analytical Chemistry 69(7) p1320-1325, 19977. R. Griffey, M. Greig, <strong>and</strong> H. Gaus. Journal <strong>of</strong> Mass Spectrometry 32: p305-313, 19978. M.Gilar. Journal <strong>of</strong> Analytical Biochemistry 298 (2) p196-206, 2001TrademarksClarity is a registered trademark <strong>of</strong> <strong>Phenomenex</strong>, Inc. OTX, Oligo-RP, <strong>and</strong> Oligo-<strong>MS</strong> are trademarks <strong>of</strong> <strong>Phenomenex</strong>, Inc. LTQ <strong>and</strong> Orbitrap are registeredtrademarks <strong>of</strong> Thermo Finnigan, L<strong>LC</strong>. ProMass is a registered trademark <strong>of</strong> Novatia, L<strong>LC</strong>. Agilent is a registered trademark <strong>of</strong> AgilentTechnologies. Ab Sciex <strong>and</strong> API 3000 are trademarks <strong>of</strong> Ab Sciex Pte. Ltd. AB SCIEX is being used under license.© 2011 <strong>Phenomenex</strong>, Inc. All rights reserved.