Rashid Jalal Qureshi, Jean-Yves Ramel, Usman Ali, Hubert Cardot
Rashid Jalal Qureshi, Jean-Yves Ramel, Usman Ali, Hubert Cardot
Rashid Jalal Qureshi, Jean-Yves Ramel, Usman Ali, Hubert Cardot

Create successful ePaper yourself
Turn your PDF publications into a flip-book with our unique Google optimized e-Paper software.
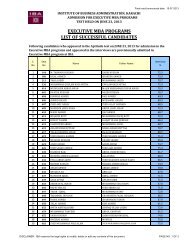
IEEE --- 2005 International Conference on Emerging TechnologiesSeptember 17-18, Islamabad<strong>Rashid</strong> <strong>Jalal</strong> <strong>Qureshi</strong> 1 , <strong>Jean</strong>-<strong>Yves</strong> <strong>Ramel</strong> 1 , <strong>Usman</strong> <strong>Ali</strong> 2 , <strong>Hubert</strong> <strong>Cardot</strong> 11 Université François-Rabelais de Tours,Laboratoire d'Informatique (EA 2101), 64, Avenue <strong>Jean</strong> Portalis, 37200 TOURS – Francerashid-jalal.qureshi@etu.univ-tours.fr,{ jean-yves.ramel, hubert.cardot }@univ-tours.fr2 Department of Electrical Engineering,COMSATS Institute of Information Technology, Abbottabad, Pakistanusman_gikian_abbott@hotmail.comAbstractGraph matching methods are often proposed to solvethe symbols recognition problems. Finding an exactmatching between two graphs using graphisomorphism techniques remains unresolved andknown to be NP-complete. In our proposedtechnique, first, raster image of each graphic symbolis vectorized and quadrilaterals are constructed bysearching and selecting vectors having oppositedirection and minimum distance between theirextremities. We use quadrilaterals and theirneighbouring relations to construct a labelled graph.To deal with the presence of noise and distortion, ourapproach is based on inexact graph matching whereeach vertex of one graph can be associated to zero,one or more vertices of the other graph. It uses agreedy incomplete search algorithm to find the bestmapping between the vertices of the two graphs andcompute a similarity score. The strength of thisapproach is maximum structural representationwhich is invariant to distortion and affinetransformations.KeywordsSymbol Matching, Graphic document analysis,Graphic recognition, Image processingDetecting graphics symbols and investigating variousaspects of their recognition techniques is one of theprimary research activities in fields like architecture,cartography, electronics, engineering etc. Symbolsare set of signs or shapes with a particular meaningthat often represent something in a specificapplication domain. They can be simple 2D binaryshapes composed of lines (figure.1), arcs and filledareas, or complex grey level and colour shapesdistributed over the document either isolated orembedded in another graphic entity. From theapplications point of view, much of the researchwork in graphics recognition has been addressedto engineering drawing [2] and the automaticconversion of architecture drawings to a formatunderstandable by CAD systems [3], where symbolsrepresent building elements in the plan like doors,furniture, stairs etc. A number of good review paperscompletely or partly dedicated to problems related tosymbol recognition in documents have been recentlypresented [1, 4, 5]. Different approaches have beendevised for different application fields. But themethods needed to solve certain problems peculiar toa given type of images, can seldom be used for otherimage types. We had tried to develop a generalmethod based on finding the similarity betweenlabelled graphs of the two symbols which has provedto be effective for different types of symbols .1. IntroductionSymbol recognition is a particular application ofpattern recognition and a key action in theinterpretation of engineering drawings, logicdiagrams, maps, architectural drawings, charts etc.Figure 1. Architectural and electrical symbols ofGREC-2003 database0-7803-9247-7/05/$20.00 ©2005 IEEE109
IEEE --- 2005 International Conference on Emerging TechnologiesSeptember 17-18, IslamabadThis paper is organis ed as follow: In section 2, wepresent an overview of the related works. Section 3defines the various recognition pre-processing stepsof the proposed approach Then in Section 4, graphmatching strategy and greedy algorithm is discussed.In Section 5 some results of the application of thisframework are presented and finally, in Section 6, wedraw conclusion from this work.2. Related worksDocuments have been grouped into three largefamilies according to the main symbol features andthe context in which the symbols are embedded [1].These are the technical drawings, maps and others.e.g., all the mechanical or architectural drawings,electronic and logic circuits diagram, flow charts aregenerally considered to be in the family of technicaldrawings, maps-family may include geographic,topographic, cadastral and hydrographical maps,while the others family has covered the rest ofmiscellaneous documents containing symbols, suchas musical scores, mathematical symbols, logos, andstructured chemical formula.An error-tolerant sub-graph isomorphismalgorithm formulated in terms of Region AdjacencyGraphs (RAG) was proposed in [12] to recognizesymbols in hand drawn diagrams. In this work a setof edit operations to transform one RAG into anotherone are defined. Regions are represented by polylinesand string matching techniques are used tomeasure their similarity. The algorithm follows abranch and bound approach driven by the RAG editoperations and reaches a solution in a nearpolynomial time.An interesting method based on computingangular signatures for identification and recognitionof symbols in technical drawings was recentlypresented [9]. The proposed method was based on thenotion of F-Signatures, a particular histogram offorces having low time complexity. Thus by defininga signature for each object found in the line-drawing,and finding geometric transformation leads todiscriminate and classify similar objectsindependently of their location, orientation and size.Indeed the system based on signature techniquesis generally fast, and can be employed both foroptimization and recognition purposes. e.g., PhilippeDosch and Josep Llados [11] present a method basedon vectorial signature for discriminating symbols intechnical documents, also Ventura and chettini [10]use vectorial signatures to directly recognizesymbols. These signatures are actually a collection offeatures extracted from the vectorial description ofthe graphic layer.But, as pointed out by P. Dosch [11], a lot of falsealarms are still present, especially with symbol notpresented in the library, or symbol containing arcsthat may be approximated differently during thevectorization step.The interpretation of musical scores is usuallydone by first extracting stave lines using projectionor run analysis techniques followed by constructionof a feature vector for each individual note [8]. Thefinite set of feature vectors of standard musicsymbols were either fed to a neural network ordifferent methods based on distance calculationsusually used for recognition.3. Recognition pre-processing3.1. VectorizationIn the proposed approach, we describe the shapes ofsymbols by their contours using Vector features. Forthis purpose a polygonal approximation of contoursof the symbols was done by a method suggested byWall [13]. The sequence of vectors, segmentsbetween two consecutive control points, with itsattributes like initial point, final point, length, andangle are stored in a chained list. And to reduce thenumber of control points, merging of the closedvectors was done iteratively using angle thresholduntil no further fusion of vectors was possible.3.2. The quadrilateralsThe quadrilaterals were constructed by searching andmatching the two longest vectors from the list ofunmatched vectors, having opposite direction andminimum distance between their extremities(figure.2). This description could be compared to theShimotsuji’s [14] or to the Shih's and Kasturi's onewhich is based on trapezoids [15]. The list ofquadrilaterals was sorted and possible merging of theclosed quadrilaterals (figure.3) was done by defininga distance threshold between the nearest candidatequadrilaterals [6].3.3. Labelled graph constructionEach symbol is represented by a labelled graph,every node and edge is associated with at least onelabel. As the nodes are actually representingquadrilaterals so all the nodes have the same labeli.e., “quad” , however, the edges between nodes canhave labels like “X” , “T” , “L” , “P” or “S”depending on the type of the topological relationshipbetweens the two quadrilateral as show in figure 4.110
IEEE --- 2005 International Conference on Emerging TechnologiesSeptember 17-18, Islamabad4. Graph matching(a) Initial image (b) Contours(b) Vectors (c) QuadrilateralsFigure 2: Construction of quadrilaterals.a.Graphs are widely used to represent complexstructures in computer vision and pattern recognitionapplications. Graph-matching algorithms are used inrecognition methods that deal with graph descriptions[1]. In its most general form, graph matching refersto the problem of finding a mapping Mp from thenodes of one given graph G 1 to the nodes of anothergiven graph G 2, that satisfy some constraints oroptimality criteria. This mapping Mp is usuallybijective for graph isomorphism detection (i.e.,preserving all edges and labels) and injective for subgraphisomorphism (i.e., all edges of G 1 are includedin G 2 and all labels are preserved). In our case, the setof labels for vertices and edges can be given as:L v = {quad}L E = {X, T, L, S, P}Thus the labelled graph is defined by a triple whichcompletely describe all its featuresG = < V, r v , r E > where- V is finite set of vertices,- r v ⊆ V x L v is a set of couples (v i ,l ) such thatVertex vi has a labell .- r E ⊆ V x V x L E is a set of triples ( v i , v j , l )Such that edge (v i , v j ) has a labell .As the description of graph G is actually the union ofits features. i.e., vertices and arcs, we can define it as:descrip (G) = r v ∪ r Eb 1 . b 2 .The description of the two graphs G 1 and G 2 given infigure 5 will be:descrip (G 1 ) = r V1 ∪ r E1 , descrip (G 2 ) = r v2 ∪ r E2c 1 . c 2 .Figure 3 : Fusion of quadrilaterals :(a) initial image, (b1) et (c1) before fusion,(b2) et (c2) after fusion.TJunctionP(Parallel)S(Successive)LJunctionX(Intersection)G 1 = 〈 V 1 = {a, b, c, d, e, f}rv 1 = {(a, quad), (b, quad), (c, quad),(d, quad), (e, quad) (f, quad)}rE 1 = {(a, b, L), (b, c, L), (c, d, L),(d, e, L), (e, a, L), (f, a, T),(f, d, T), (f, e, P) } 〉G 2 = 〈 V 2 = {1, 2, 3, 4, 5, 6, 7, 8}rv 2 = {(1, quad), (2, quad), (3, quad),(4, quad), (5, quad), (6, quad),(7, quad), (8, quad)}rE 2 = {(1, 2, L), (1, 5, L), (1, 6, P),(2, 3, L), (3, 4, L), (4, 8, P),(4, 5, L), (5, 6, T), (5, 8, T),(6, 7, L), (7, 8, L) } 〉Figure 4. Examples of quadrilaterals and theirrespective topological relation111
IEEE --- 2005 International Conference on Emerging TechnologiesSeptember 17-18, IslamabadAs proposed in [7], to measure the similarity betweenlabelled graphs of the graphic symbols, informationabout their common features is required. This isachieved by finding a mapping between the verticesof the two graphs, which may not be necessarily oneto-onei.e., one vertex of a graph can be associated toone, two or more vertices of the other graph. For thetwo labelled graph G 1 and G 2 given in figure 5, twoof the many possible mapping can beMp 1 = {(a, 6), (b, 7), (c, 8), (d, 8), (e, 5)}Mp 2 = {(a, 1), (b, 2), (c, 3), (d, 4), (e, 7)}In the first mapping Mp 1 the vertex “8” of G 2 hasbeen associated with two vertices (“c”, “d”) of graphG 1 . Nevertheless, there are certain vertices whichhave not been considered in this mapping. e.g.,vertex “f ” of G 1 . i.e.Mp 1 ( 8 ) = {c, d}Mp 1 ( f ) = 0This kind of association of a vertex to two or morevertices is called split of a vertex. Thus a set of splitvertices can be defined as:Sp (Mp) = {(v, s v) | v∈V 1 ∪ V 2 , s v= Mp (v), | Mp (v)| ≥ 2 }Here it is important to consider this phenomenon ofsplits of a vertex as it plays a crucial role incomputing similarities.4.1. Identifying common featuresIn order to find the similarity between two graphs,we have to identify the common features. Usually wecompute intersection of the features of the twoobjects, but as the two graphs are disjoint so, theintersection of the vertices of the two graphs willalways result in zero. i.e., V 1 ∩ V 2 = 0. However,intersection with respect to certain mapping of thevertices is possible. So, the intersection according toa mapping Mp will be a feature set containing all thevertices and edges whose labels are matched in bothG 1 and G 2 .Mp1decrip( G1) ∩ decrip( G2) ={(a, quad), (b, quad), (c, quad), (d, quad), (e, quad),(5, quad), (6, quad), (7, quad), (8, quad),(a, b, L), (b, c, L), (6, 7, L), (7, 8, L)}Mp2decrip( G1) ∩ decrip( G2) ={(a, quad), (b, quad), (c, quad), (d, quad), (e, quad),(1, quad), (2, quad), (3, quad), (4, quad), (7, quad),(a, b, L), (b, c, L), (c, d, L), (1, 2, L), (2, 3, L),(3, 4, L)}The similarity score is actually a difference betweena function of the common features and a function ofsplits. In our case, f and g are the cardinalityfunctions that quantify vertex or edge features andsplits of a vertex. Indeed the denominator isintroduced to normalize the similarity value betweenzero and one and does not depend on mapping. Thus,we can calculate the score of similarity with respectto a given mapping by,Considering Tversky’s [16] contrast model toevaluate matching and mismatching of features, thesimilarity between G 1 and G 2 can be defined as aratio of their common features to the total number offeatures.Mpf (decrip(G 1)∩ decrip(G2))- g (Sp(Mp ))SimMp(G 1,G2)=f (decrip(G ) ∪decrip(G))MpScoreMp= f (decrip(G1 ) ∩ decrip(G2))- g (Sp(Mp ))This test of score of a given mapping plays animportant role in greedy incomplete search algorithmand helps to reduce the search space, and not toconsider all the possible subsets of V 1 x V 2 thatwould contain 2 |V1|*|V2| states.4.2. Greedy search algorithm for bestmapping of verticesWe have used the greedy algorithm presented in [7]that takes description of two graphs as input andreturns best mapping of the vertices. The algorithmstarts from the empty mapping, and iteratively addsto this mapping a couple of vertices that mostincrease the score function. If there are more thanone candidate couples which can equally increase thescore, then a look ahead option is used. It checks thepotentiality of the couple of vertices as the number ofcommon edges shared by them, if allowed to enterinto current mapping.This algorithm stops iterating when every coupleneither directly increase the score function nor has alook ahead common edge features. It has apolynomial time complexity of O ((|V 1 | x |V 2 |) ²)provided that the computation of f and g function haslinear time complexities with respect to the size ofmapping.12112
IEEE --- 2005 International Conference on Emerging TechnologiesSeptember 17-18, Islamabad5. ResultsTo test our approach, we have used the symboldatabase proposed for the symbol recognition contest(GREC’03). It is composed of 256x256 binaryimages. We have done experiment on a collection of62 symbols. The experimental result shows that therecognition rate is 100% for the original graphicsymbols. Then a mixture of 12 architectural andelectrical symbols was selected from the samedatabase which was degraded with noise anddistortion (table.1). These were matched against theirrespective models. The recognition rate obtained forall is above 90% (table.2). Sometimes a symbol isrecognized correctly but it is also matched withanother symbol, due to their equal number of nodesand edges, but this problem can be solved byattaching multiple attributes to the vertices of thegraphs, on which we are currently working.6. ConclusionWe can conclude that, our structural approach iseasier to generalize to different domain and to extendwith new symbols for recognition purpose becauseall the graphic symbols share a similar representationusing vectors and quadrilaterals constructed frompixels, the usual low-level primitive. The study ofmatching graphic symbols using a labelled graph oftheir graphic primitives has produced good resultsnot only in recognizing different symbols but alsohas showed its robustness to noise and distortion. Weare working on improving the results by consideringother attributes of the quadrilaterals as multiple labelson vertices of the labelled graph.References[1] L.P. Cordela and M. Vento, Symbol recognition indocuments: a collection of techniques, InternationalJournal on Document Analysis and Recognition, Vol. 3(2), 2000, pp. 73 – 88.[2] S. Adam, J.M. Ogier, C. Cariou, R. Mullot, J. Labiche,J. Gardes, Symbol and character recognition: applicationto engineering drawings, International Journal onDocument Analysis and Recognition, Vol. 3 (2), 2000, pp.89 – 101.[3] P. Dosch, K. Tombre, C. Ah-Soon, G. Masini, Acomplete system for the analysis of architectural drawings,International Journal on Document Analysis andRecognition, Vol.3 (2), 2000, pp. 102 – 116.[4] J. Lladós, E. Valveny, G. Sánchez, E. Martí: SymbolRecognition: Current Advances and Perspectives, 4thInternational Workshop, GREC 2001, Kingston, Ontario,Canada, Selected Papers, Lecture Notes in ComputerScience Vol. 2390, 2001, pp. 104-127.[5] A. K. Chhabra, Graphic Symbol recognition: anoverview, Proceedings of the Second InternationalConference on Graphics Recognition, Nanacy France,1997, pp. 224-252.[6] J.Y. <strong>Ramel</strong>, N. Vincent, H. Emptoz, A structuralrepresentation for understanding line-drawing images,International Journal on Document Analysis andRecognition, Vol.3 (2), 2000, pp. 58 – 66.[7] P.A. Champin and C. Solnon, Measuring theSimilarity of Labeled Graphs, Proceedings of the 5thInternational Conference on Case-Based Reasoning (Eds.K.D. Ashley and D.G. Bridge), Springer- Verlag, 2003,pp. 80-95.[8] D. Bainbridge, N. Carter, Automatic reading of musicnotation, Handbook of Character Recognition andDocument Image Analysis, World Scientific, 1997, pp.583-603.[9] S. Tabbone, L. Wendling, K. Tombre, Matching ofgraphical Symbols in line-drawing images using angularsignature information, International Journal on DocumentAnalysis and Recognition, Vol.6 (2), 2003. pp. 115-125.[10] A. D. Ventura, R. Schettini, Graphic SymbolRecognition using a Signature Technique, In: Proceedingof 12 th International Conference on Pattern Recognition,Jerusalem (Israel), Vol.2, 1994, pp. 533-535.[11] P. Dosch., J. Llados, Vectorial Signatures forSymbol Discrimination, 5 th International workshop,Barcelona(Spain), , 2003, pp. 154-165.[12] J. Lladoós, E. Martí, J. J. Villanueva, SymbolRecognition by Error-Tolerant Subgraph Matchingbetween Region Adjacency Graphs, IEEE Transactions onPattern Analysis and Machine Intelligence, Vol.23 (10)Graph Algorithms and Computer Vision, 2001, pp.1137 – 1143.[13] K. Wall and P. Danielsson, A fast sequential methodfor polygonal approximation of digitized curves, ComputerVision, Graphics and Image Processing, Vol. 28, 1984, pp.220-221.[14] S. Shimotsuji, O. Hori, M. Asano, K. Suzuki, F.Hoshino, T. Ishii, A robust recognition system for adrawing superimposed on a map, Computer in USA, Vol.25 (7), 1992, pp. 56-59.[15] C. Shih, and R. Kasturi, Extraction of graphicprimitives from images of paper based line drawings,Machine Vision and Applications, Vol.2, 1989,pp 103-113.[16] Tversky, A. Features of similarity. PsychologicalReview Vol.84, 1977, pp. 327–352.114