Chapter 7. Hypothesis Testing with One Sample
Chapter 7. Hypothesis Testing with One Sample
Chapter 7. Hypothesis Testing with One Sample
Create successful ePaper yourself
Turn your PDF publications into a flip-book with our unique Google optimized e-Paper software.
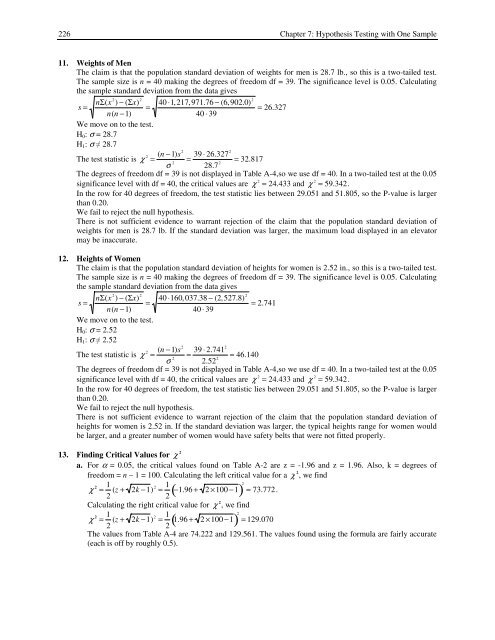
226 <strong>Chapter</strong> 7: <strong>Hypothesis</strong> <strong>Testing</strong> <strong>with</strong> <strong>One</strong> <strong>Sample</strong>11. Weights of MenThe claim is that the population standard deviation of weights for men is 28.7 lb., so this is a two-tailed test.The sample size is n = 40 making the degrees of freedom df = 39. The significance level is 0.05. Calculatingthe sample standard deviation from the data givess = nΣ(x 2 ) − (Σx) 240 ⋅1,217,971.76 − (6,902.0)2= = 26.327n(n −1)40 ⋅ 39We move on to the test.H 0 : σ = 28.7H 1 ≠ : σ 28.72(n −1)s 39 ⋅The test statistic is χ 2 26.3272= = = 32.817σ 2 28.7 2The degrees of freedom df = 39 is not displayed in Table A-4,so we use df = 40. In a two-tailed test at the 0.05significance level <strong>with</strong> df = 40, the critical values are χ 2 = 24.433 and χ 2 = 59.342.In the row for 40 degrees of freedom, the test statistic lies between 29.051 and 51.805, so the P-value is largerthan 0.20.We fail to reject the null hypothesis.There is not sufficient evidence to warrant rejection of the claim that the population standard deviation ofweights for men is 28.7 lb. If the standard deviation was larger, the maximum load displayed in an elevatormay be inaccurate.12. Heights of WomenThe claim is that the population standard deviation of heights for women is 2.52 in., so this is a two-tailed test.The sample size is n = 40 making the degrees of freedom df = 39. The significance level is 0.05. Calculatingthe sample standard deviation from the data givess = nΣ(x 2 ) − (Σx) 240 ⋅160,03<strong>7.</strong>38 − (2,52<strong>7.</strong>8)2= = 2.741n(n −1)40 ⋅ 39We move on to the test.H 0 : σ = 2.52H 1 ≠ : σ 2.522(n −1)s 39 ⋅The test statistic is χ 2 2.7412= = = 46.140σ 2 2.52 2The degrees of freedom df = 39 is not displayed in Table A-4,so we use df = 40. In a two-tailed test at the 0.05significance level <strong>with</strong> df = 40, the critical values are χ 2 = 24.433 and χ 2 = 59.342.In the row for 40 degrees of freedom, the test statistic lies between 29.051 and 51.805, so the P-value is largerthan 0.20.We fail to reject the null hypothesis.There is not sufficient evidence to warrant rejection of the claim that the population standard deviation ofheights for women is 2.52 in. If the standard deviation was larger, the typical heights range for women wouldbe larger, and a greater number of women would have safety belts that were not fitted properly.13. Finding Critical Values for χ 2a. For α = 0.05, the critical values found on Table A-2 are z = -1.96 and z = 1.96. Also, k = degrees offreedom = n – 1 = 100. Calculating the left critical value for a χ 2 , we find( ) 2 = 73.772.χ 2 = 1 2 (z + 2k −1) 2 = 1 −1.96 + 2 ×100 −12Calculating the right critical value for χ 2 , we findχ 2 = 1 2 (z + 2k −1) 2 = 1 ( 1.96 + 2 ×100 −1) 2 = 129.0702The values from Table A-4 are 74.222 and 129.561. The values found using the formula are fairly accurate(each is off by roughly 0.5).


