Chapter 7. Hypothesis Testing with One Sample
Chapter 7. Hypothesis Testing with One Sample
Chapter 7. Hypothesis Testing with One Sample
You also want an ePaper? Increase the reach of your titles
YUMPU automatically turns print PDFs into web optimized ePapers that Google loves.
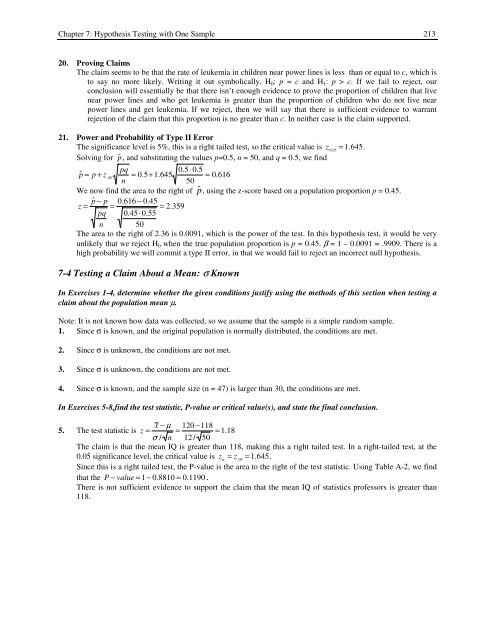
<strong>Chapter</strong> 7: <strong>Hypothesis</strong> <strong>Testing</strong> <strong>with</strong> <strong>One</strong> <strong>Sample</strong> 21320. Proving ClaimsThe claim seems to be that the rate of leukemia in children near power lines is less than or equal to c, which isto say no more likely. Writing it out symbolically, H 0 : p = c and H 1 : p > c. If we fail to reject, ourconclusion will essentially be that there isn’t enough evidence to prove the proportion of children that livenear power lines and who get leukemia is greater than the proportion of children who do not live nearpower lines and get leukemia. If we reject, then we will say that there is sufficient evidence to warrantrejection of the claim that this proportion is no greater than c. In neither case is the claim supported.21. Power and Probability of Type II ErrorThe significance level is 5%, this is a right tailed test, so the critical value is z 0.05= 1.645.Solving for p ˆ , and substituting the values p=0.5, n = 50, and q = 0.5, we findpq0.5⋅ 0.5p ˆ = p + z .05= 0.5+1.645 = 0.616n 50We now find the area to the right of p ˆ , using the z-score based on a population proportion p = 0.45.z = p ˆ − p 0.616 − 0.45= = 2.359pq 0.45⋅ 0.55n 50The area to the right of 2.36 is 0.0091, which is the power of the test. In this hypothesis test, it would be veryunlikely that we reject H 0 when the true population proportion is p = 0.45. β = 1 – 0.0091 = .9909. There is ahigh probability we will commit a type II error, in that we would fail to reject an incorrect null hypothesis.7-4 <strong>Testing</strong> a Claim About a Mean: σ KnownIn Exercises 1-4, determine whether the given conditions justify using the methods of this section when testing aclaim about the population mean µ.Note: It is not known how data was collected, so we assume that the sample is a simple random sample.1. Since σ is known, and the original population is normally distributed, the conditions are met.2. Since σ is unknown, the conditions are not met.3. Since σ is unknown, the conditions are not met.4. Since σ is known, and the sample size (n = 47) is larger than 30, the conditions are met.In Exercises 5-8,find the test statistic, P-value or critical value(s), and state the final conclusion.5. The test statistic is z = x − µ 120 −118=σ / n 12 / 50 = 1.18The claim is that the mean IQ is greater than 118, making this a right tailed test. In a right-tailed test, at the0.05 significance level, the critical value is z α= z .05= 1.645.Since this is a right tailed test, the P-value is the area to the right of the test statistic. Using Table A-2, we findthat the P − value = 1− 0.8810 = 0.1190.There is not sufficient evidence to support the claim that the mean IQ of statistics professors is greater than118.


