Student Activity: To investigate an ESB bill - Project Maths
Student Activity: To investigate an ESB bill - Project Maths
Student Activity: To investigate an ESB bill - Project Maths
- No tags were found...

You also want an ePaper? Increase the reach of your titles
YUMPU automatically turns print PDFs into web optimized ePapers that Google loves.
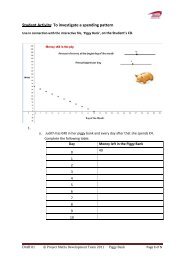
c. What shape is the graph? Explain your <strong>an</strong>swer._______________________________________________________________d. Where does this graph cut the y axis <strong>an</strong>d what number does this relate to onthe table?_______________________________________________________________e. What is the rate of ch<strong>an</strong>ge of the graph?_______________________________________________________________f. Find 2 points on the line <strong>an</strong>d calculate the slope of the line._____________________________________________________________________________________________________________________________g. Write <strong>an</strong> algebraic formula to represent the cost of <strong>an</strong> <strong>ESB</strong> <strong>bill</strong> using thecharges used in this question?_______________________________________________________________h. Where does the slope appear i) in the table, ii) in the graph <strong>an</strong>d iii) in theformula?_______________________________________________________________Draft 01 © <strong>Project</strong> <strong>Maths</strong> Development Team 2011 <strong>ESB</strong> <strong>bill</strong> Page 3 of 8
13.a. Using the diagram above, calculate the st<strong>an</strong>ding charge <strong>an</strong>d the unit costfrom the information shown.______________________________________________________________________________________________________________________________b. What is the equation of the line in the above diagram?_______________________________________________________________c. Complete the table for the situation represented in the diagram above.Units used Cost of Units St<strong>an</strong>dingcharge050100150200<strong>To</strong>tal Bill14.a. Complete the following table to represent the situation where the st<strong>an</strong>dingcharge for electricity is €0 <strong>an</strong>d the price per unit is €0.10.Unitsused050100150200Cost of UnitsSt<strong>an</strong>dingcharge<strong>To</strong>tal BillDraft 01 © <strong>Project</strong> <strong>Maths</strong> Development Team 2011 <strong>ESB</strong> <strong>bill</strong> Page 6 of 8
. Draw a rough graph to represent the situation where the st<strong>an</strong>ding charge forelectricity is €0 <strong>an</strong>d the price per unit is €0.10.a. What is the formula that represents the situation where the st<strong>an</strong>ding chargefor electricity is €0 <strong>an</strong>d the price per unit is €0.10?_____________________________________________________________________15. Jonath<strong>an</strong> forgot to pay his <strong>ESB</strong> <strong>bill</strong> for the last <strong>bill</strong>ing period <strong>an</strong>d he used 200 unitsthis period. The st<strong>an</strong>ding charge is €21 per 2 month period <strong>an</strong>d the cost per unit is€0.10. If the <strong>bill</strong> for the 4 month period was €300, how m<strong>an</strong>y units did he use in thefirst 2 months assuming the charges remain the same? Show your calculations.____________________________________________________________________________________________________________________________________________________________________________________________________________________________________________________________________________________16. If the <strong>ESB</strong> ab<strong>an</strong>doned its st<strong>an</strong>ding charge, but the amount of a household’s <strong>bill</strong> didnot increase, what 2 things could have happened?__________________________________________________________________________________________________________________________________________Draft 01 © <strong>Project</strong> <strong>Maths</strong> Development Team 2011 <strong>ESB</strong> <strong>bill</strong> Page 7 of 8
17. If you were told the number of units used vs. the total <strong>bill</strong> was represented by alinear graph y=0.17x+10. What does that tell you about the st<strong>an</strong>ding charge <strong>an</strong>d costper unit?__________________________________________________________________________________________________________________________________________18. Describe what happens to the line in the interactive file if the cost of the st<strong>an</strong>dingcharge for a household is increased.__________________________________________________________________________________________________________________________________________19. Describe what happens to the line in the interactive file if the cost per unit isincreased.__________________________________________________________________________________________________________________________________________20.a. Describe the cost of the <strong>bill</strong> Household A receives <strong>an</strong>d the <strong>bill</strong> Household Breceives in the diagram below.b. Write down <strong>an</strong>d then graph a situation where a household has a higherst<strong>an</strong>ding charge th<strong>an</strong> household A in the diagram above but ends up with a<strong>bill</strong> which is below Households A’s <strong>bill</strong> after a certain number of units. Draw arough sketch of this situation.__________________________________________________________________________________________________________________________________________Draft 01 © <strong>Project</strong> <strong>Maths</strong> Development Team 2011 <strong>ESB</strong> <strong>bill</strong> Page 8 of 8