Formal Lab Report Format- FCHS Science Department Title Page ...
Formal Lab Report Format- FCHS Science Department Title Page ...
Formal Lab Report Format- FCHS Science Department Title Page ...

You also want an ePaper? Increase the reach of your titles
YUMPU automatically turns print PDFs into web optimized ePapers that Google loves.
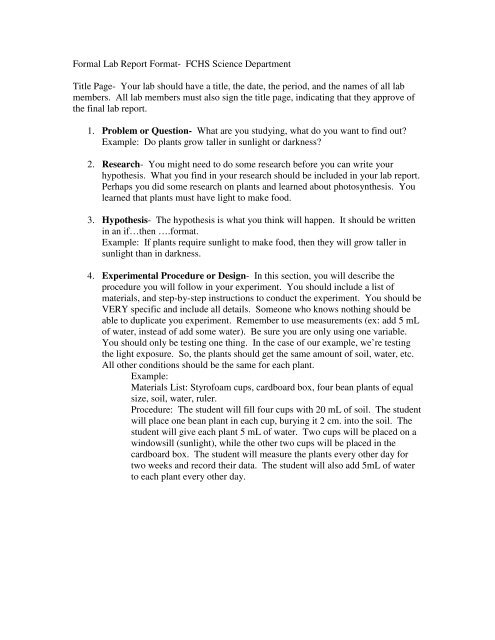
<strong>Formal</strong> <strong>Lab</strong> <strong>Report</strong> <strong>Format</strong>- <strong>FCHS</strong> <strong>Science</strong> <strong>Department</strong><strong>Title</strong> <strong>Page</strong>- Your lab should have a title, the date, the period, and the names of all labmembers. All lab members must also sign the title page, indicating that they approve ofthe final lab report.1. Problem or Question- What are you studying, what do you want to find out?Example: Do plants grow taller in sunlight or darkness?2. Research- You might need to do some research before you can write yourhypothesis. What you find in your research should be included in your lab report.Perhaps you did some research on plants and learned about photosynthesis. Youlearned that plants must have light to make food.3. Hypothesis- The hypothesis is what you think will happen. It should be writtenin an if…then ….format.Example: If plants require sunlight to make food, then they will grow taller insunlight than in darkness.4. Experimental Procedure or Design- In this section, you will describe theprocedure you will follow in your experiment. You should include a list ofmaterials, and step-by-step instructions to conduct the experiment. You should beVERY specific and include all details. Someone who knows nothing should beable to duplicate you experiment. Remember to use measurements (ex: add 5 mLof water, instead of add some water). Be sure you are only using one variable.You should only be testing one thing. In the case of our example, we’re testingthe light exposure. So, the plants should get the same amount of soil, water, etc.All other conditions should be the same for each plant.Example:Materials List: Styrofoam cups, cardboard box, four bean plants of equalsize, soil, water, ruler.Procedure: The student will fill four cups with 20 mL of soil. The studentwill place one bean plant in each cup, burying it 2 cm. into the soil. Thestudent will give each plant 5 mL of water. Two cups will be placed on awindowsill (sunlight), while the other two cups will be placed in thecardboard box. The student will measure the plants every other day fortwo weeks and record their data. The student will also add 5mL of waterto each plant every other day.
5. Data- In this section you are going to report what you find in the experiment. Itis usually best to use tables and graphs to report your data, because graphs andcharts are easier for your reader to understand. Graphs will help to show trends.Example:Date Plant #1 (sun) Plant #2 (sun) Plant #3 (dark) Plant #4 (dark)5/13 4 cm 4.1 cm 4.0 cm 4.1 cm5/15 4.3 cm 4.3 cm 4.1 cm 4.1 cm5/17 4.6 cm 4.5 cm 4.1 cm 4.2 cm5/19 4.7 cm 4.8 cm. 4.2 cm 4.2 cmYou then might make a line graph for the height of each plant vs. time. Be sure toinclude titles, labels on the axes, and a key for your graph.6. Analysis- In this section you will basically summarize your data and provideexplanations. You DO NOT want to draw any conclusions here (for example,which plant grew the most, etc…)Example: Plant number one’s overall size increased from 4 centimeters to 4.7centimeters. Plant number two’s size…etc.7. Conclusion- In this section, you must compare your results to your original.Was your hypothesis correct? Why or why not? You should also includehypothesis any possible errors. Perhaps you watered one plant more than theother. What did you find that surprised you? If you have done any statisticalanalysis, it should go here (t-tables, significance, etc.)Example: In the experiment, the student found that plant number one and plantnumber two showed a significant increase in growth, while plant number threeand plant number four only showed a slight increase in growth. Plant number oneand plant number two were exposed to sunlight. This proves the originalhypothesis, that plants will grow taller in sunlight, correct. There were severalpossible sources of error. Perhaps the water was measured inaccurately. Perhapsthere was a temperature difference that affected the growth of the plants.Photosynthesis, which is the process by which plants get energy, allows for thegrowth of plants. In the absence of photosynthesis (absence of light reactions)plants will not grow as well because they do not get the energy they need.<strong>Lab</strong> reports should not be written in first person. Never say, I did this, or wedid that… Instead, you should write your lab report in third person. Thestudent will…