Findings for Foreign Equity Investment in Singapore 2011 - Statistics ...
Findings for Foreign Equity Investment in Singapore 2011 - Statistics ...
Findings for Foreign Equity Investment in Singapore 2011 - Statistics ...

You also want an ePaper? Increase the reach of your titles
YUMPU automatically turns print PDFs into web optimized ePapers that Google loves.
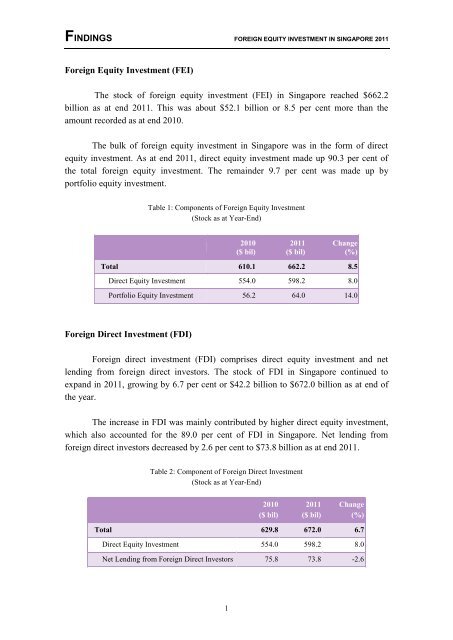
FINDINGS FOREIGN EQUITY INVESTMENT IN SINGAPORE <strong>2011</strong><strong>Foreign</strong> <strong>Equity</strong> <strong>Investment</strong> (FEI)The stock of <strong>for</strong>eign equity <strong>in</strong>vestment (FEI) <strong>in</strong> S<strong>in</strong>gapore reached $662.2billion as at end <strong>2011</strong>. This was about $52.1 billion or 8.5 per cent more than theamount recorded as at end 2010.The bulk of <strong>for</strong>eign equity <strong>in</strong>vestment <strong>in</strong> S<strong>in</strong>gapore was <strong>in</strong> the <strong>for</strong>m of directequity <strong>in</strong>vestment. As at end <strong>2011</strong>, direct equity <strong>in</strong>vestment made up 90.3 per cent ofthe total <strong>for</strong>eign equity <strong>in</strong>vestment. The rema<strong>in</strong>der 9.7 per cent was made up byportfolio equity <strong>in</strong>vestment.Table 1: Components of <strong>Foreign</strong> <strong>Equity</strong> <strong>Investment</strong>(Stock as at Year-End)2010($ bil)<strong>2011</strong>($ bil)Change(%)Total 610.1 662.2 8.5Direct <strong>Equity</strong> <strong>Investment</strong> 554.0 598.2 8.0Portfolio <strong>Equity</strong> <strong>Investment</strong> 56.2 64.0 14.0<strong>Foreign</strong> Direct <strong>Investment</strong> (FDI)<strong>Foreign</strong> direct <strong>in</strong>vestment (FDI) comprises direct equity <strong>in</strong>vestment and netlend<strong>in</strong>g from <strong>for</strong>eign direct <strong>in</strong>vestors. The stock of FDI <strong>in</strong> S<strong>in</strong>gapore cont<strong>in</strong>ued toexpand <strong>in</strong> <strong>2011</strong>, grow<strong>in</strong>g by 6.7 per cent or $42.2 billion to $672.0 billion as at end ofthe year.The <strong>in</strong>crease <strong>in</strong> FDI was ma<strong>in</strong>ly contributed by higher direct equity <strong>in</strong>vestment,which also accounted <strong>for</strong> the 89.0 per cent of FDI <strong>in</strong> S<strong>in</strong>gapore. Net lend<strong>in</strong>g from<strong>for</strong>eign direct <strong>in</strong>vestors decreased by 2.6 per cent to $73.8 billion as at end <strong>2011</strong>.Table 2: Component of <strong>Foreign</strong> Direct <strong>Investment</strong>(Stock as at Year-End)2010($ bil)<strong>2011</strong>($ bil)Change(%)Total 629.8 672.0 6.7Direct <strong>Equity</strong> <strong>Investment</strong> 554.0 598.2 8.0Net Lend<strong>in</strong>g from <strong>Foreign</strong> Direct Investors 75.8 73.8 -2.61
FINDINGS FOREIGN EQUITY INVESTMENT IN SINGAPORE <strong>2011</strong>Distribution by IndustryThe f<strong>in</strong>ancial & <strong>in</strong>surance services sector attracted the most FDI, followed bythe manufactur<strong>in</strong>g sector and wholesale & retail trade sector. Together, these threesectors accounted <strong>for</strong> more than four-fifths of FDI <strong>in</strong> S<strong>in</strong>gapore.Table 3: Distribution of FDI by Industry(Stock as at Year-End)Totalof which:Amount($ bil)2010 <strong>2011</strong>Share(%)Amount($ bil)Share(%)629.8 100.0 672.0 100.0F<strong>in</strong>ancial & Insurance Services 272.6 43.3 289.7 43.1Manufactur<strong>in</strong>g 133.7 21.2 137.3 20.4Wholesale & Retail Trade 108.9 17.3 118.5 17.6Professional, Scientific & Technical,Adm<strong>in</strong>istrative & Support Services35.8 5.7 39.8 5.9Transport & Storage 36.9 5.9 35.3 5.3Real Estate Activities 20.3 3.2 27.5 4.1F<strong>in</strong>ancial & Insurance ServicesAs at end <strong>2011</strong>, the stock of FDI <strong>in</strong> S<strong>in</strong>gapore’s f<strong>in</strong>ancial & <strong>in</strong>surance servicessector amounted to $289.7 billion. With<strong>in</strong> this sector, FDI was predom<strong>in</strong>antly <strong>in</strong><strong>in</strong>vestment hold<strong>in</strong>g ($242.9 billion), followed by banks ($14.7 billion) and <strong>in</strong>suranceservices ($9.4 billion).Table 4: FDI <strong>in</strong> F<strong>in</strong>ancial & Insurance Services Sector(Stock as at Year-End)2010($ bil)<strong>2011</strong>($ bil)Share <strong>in</strong> <strong>2011</strong>(%)F<strong>in</strong>ancial & Insurance Services 272.6 289.7 100.0<strong>Investment</strong> Hold<strong>in</strong>g 228.1 242.9 83.8Banks 14.4 14.7 5.1Insurance Services 8.6 9.4 3.32
FINDINGS FOREIGN EQUITY INVESTMENT IN SINGAPORE <strong>2011</strong>Geographical DistributionEurope and Asia rema<strong>in</strong>ed as the top sources of FDI <strong>in</strong> S<strong>in</strong>gapore. As at end<strong>2011</strong>, 37.5 per cent (or $252.0 billion) of total FDI was attributed to European <strong>in</strong>vestorswhile about 24.1 per cent (or $161.9 billion) was contributed by Asian <strong>in</strong>vestors. Theother major sources of <strong>in</strong>vestment were South & Central America & the Caribbean(21.8 per cent or $146.3 billion) and North America (12.1 per cent or $81.6 billion).Chart 1: Source of FDI by Region, <strong>2011</strong>NorthAmerica12.1%Africa2.2%Others2.3%Europe37.5%South &Central America& the Caribbean21.8%Asia24.1%EuropeEurope’s FDI stock <strong>in</strong> S<strong>in</strong>gapore rose by 8.6 per cent to $252.0 billion as at end<strong>2011</strong>. Major <strong>in</strong>vestors from this region <strong>in</strong>cluded Netherlands ($66.3 billion) and theUnited K<strong>in</strong>gdom ($55.9 billion). Direct <strong>in</strong>vestment from Netherlands waspredom<strong>in</strong>antly <strong>in</strong> manufactur<strong>in</strong>g and wholesale & retail trade sectors while British<strong>in</strong>vestors favoured the manufactur<strong>in</strong>g and f<strong>in</strong>ancial & <strong>in</strong>surance services sectors.4