ATWOOD'S MACHINE - Westminster College
ATWOOD'S MACHINE - Westminster College
ATWOOD'S MACHINE - Westminster College

You also want an ePaper? Increase the reach of your titles
YUMPU automatically turns print PDFs into web optimized ePapers that Google loves.
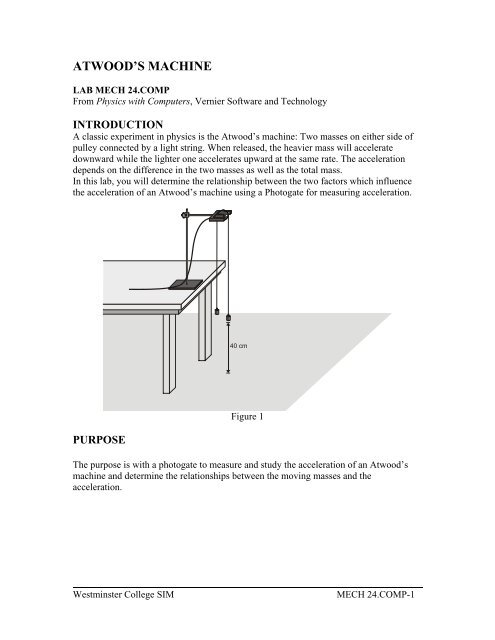
Atwood’s MachineMATERIALScomputerVernier computer interfaceLogger ProVernier Photogate with Super Pulleyclamp stand to mount photogatemass setstringPRELIMINARY QUESTIONS1. If two equal masses are suspended from either end of a string passing over a lightpulley (an Atwood’s machine), what kind of motion do you expect to occur? Why?2. For an Atwood’s machine, how would you expect the acceleration to change if you:• Move mass from one side to the other, keeping the total mass constant?• Gradually increase the mass of both sides?3. Why do the two masses have the same acceleration?4. Draw a free-body diagram of the left side mass. Draw another of the right side mass.Include all forces acting on each mass.PROCEDUREPart I Keeping Total Mass ConstantFor this part of the experiment you will keep the total mass used constant, but moveweights from one side to the other. The difference in masses changes.1. Set up the Atwood’s machine apparatus as shown in Figure 1. Be sure the heaviermass can move at least 40 cm before striking the floor.2. Connect the Photogate with Super Pulley to DIG/SONIC 1 of the interface.3. Open the file “10 Atwoods Machine” in the Physics with Computers folder. A graphof velocity vs. time will be displayed.4. Arrange a collection of masses totaling 200 g on m 2 and a 200 g mass on m 1 . What isthe acceleration of this combination? Record your values for mass and acceleration inthe data table.5. Move 5 g from m 2 to m 1 . Record the new masses in the data table.6. Position m 1 as high up as it can go. Click to begin data collection. Steady themasses so they are not swinging. Wait one second and release the masses. Catch thefalling mass before it strikes the floor or the other mass strikes the pulley.7. Click the Examine button and select the region of the graph where the velocity wasincreasing at a steady rate. Click the Linear Fit button to fit the line y = mt + b tothe data. Record the slope, which is the acceleration, in the data table.<strong>Westminster</strong> <strong>College</strong> SIMMECH 24.COMP-2
Atwood’s Machine8. Continue to move masses from m 2 to m 1 in 5 g increments, changing the differencebetween the masses, but keeping the total constant. Repeat Steps 6 - 7 for each masscombination. Repeat this step until you get at least five different combinations.Part II Keeping The Mass Difference ConstantFor this part of the experiment you will keep the difference in mass between the twosides of the Atwood’s machine constant and increase the total mass.9. Put 120 g on m 1 and 100 g on m 2 .10. Repeat Steps 6 – 7 to collect data and determine the acceleration.11. Add mass in 20 g increments to both sides, keeping a constant difference of 20 grams.Record the resulting mass for each combination in the data table. Repeat Steps 6 - 7for each combination. Repeat the procedure until you get at least five differentcombinations.DATA TABLEPart I: Keeping Total Mass ConstantTrial m 1m 2 Acceleration ∆m m T(g) (g) (m/s 2 ) (kg) (kg)12345Part II: Keeping The Mass Difference ConstantTrial m 1m 2 Acceleration ∆m m T(g) (g) (m/s 2 ) (kg) (kg)12345<strong>Westminster</strong> <strong>College</strong> SIMMECH 24.COMP-3
Atwood’s MachineANALYSIS1. For each trial, calculate the difference between m 1 and m 2 in kilograms. Enter theresult in the column labeled ∆m.2. For each trial, calculate the total mass in kilograms.3. Using Logger Pro, plot a graph of acceleration vs. ∆m, using the Part I data. Based onyour analysis of the graph, what is the relationship between the mass difference andthe acceleration of an Atwood’s machine?4. Plot a graph of acceleration vs. total mass, using the Part II data. Based on youranalysis of the graph, what is the relationship between total mass and the accelerationof an Atwood’s machine?5. Develop a single expression for the acceleration of an Atwood’s machine, combiningthe results of the previous two steps in the analysis.EXTENSIONS1. Draw a free body diagram of m 1 and another free body diagram of m 2 . Using thesediagrams, apply Newton’s second law to each mass. Assume that the tension is thesame on each mass and that they have the same acceleration. From these twoequations, find an expression for the acceleration of m 1 in terms of m 1 , m 2 , and g.Compare the expression to your result in Step 5 of Analysis.2. For each of the experimental runs you made, calculate the expected acceleration usingthe expression you found with Newton’s second law of motion and the specificmasses used. Compare these figures with your experimental results. Are theexperimental acceleration values low or high? Why?3. An unknown mass can be placed on one side of the Atwood’s machine. Using labmeasurements and any necessary calculations, the mass of the unknown can bedetermined. Try it.4. How does the force exerted upward by the pulley change as the system beginsaccelerating? Why? Set up an experiment to determine how this force changes.5. How does the tension in the string change as the masses start to move? Or does it?<strong>Westminster</strong> <strong>College</strong> SIMMECH 24.COMP-4