The Vibrational-Rotational Spectrum of HCl
The Vibrational-Rotational Spectrum of HCl
The Vibrational-Rotational Spectrum of HCl

Create successful ePaper yourself
Turn your PDF publications into a flip-book with our unique Google optimized e-Paper software.
CHEM 332LPhysical Chemistry LabRevision 2.2<strong>The</strong> <strong>Vibrational</strong>-<strong>Rotational</strong> <strong>Spectrum</strong> <strong>of</strong> <strong>HCl</strong>In this experiment we will examine the fine structure <strong>of</strong> the vibrational fundamental line forH 35 Cl in order to determine several spectroscopic constants; the <strong>Rotational</strong> Constants B 0 and B 1 ,the Centrifugal Distortion Constant D e , and the Fundamental <strong>Vibrational</strong> Band Origin .Inclusion <strong>of</strong> a few literature values for <strong>Rotational</strong> Constants B v for higher vibrational statesv=2,3,4,… will allow us to determine the Equilibrium <strong>Rotational</strong> Constant B e . Inclusion <strong>of</strong>literature values for the 1 st thru 4 th vibrational overtones will allow us to determine furtherspectroscopic constants; the Equilibrium Fundamental <strong>Vibrational</strong> Frequency and theAnharmonicity Constant . Finally, we will assume the <strong>HCl</strong> molecule is behavingapproximately as two masses connected by a stiff spring <strong>of</strong> constant k rotating with internucleardistance r. We will then extract these molecular parameters from the appropriate spectroscopicconstants.First, we must recognize that Hydrogen Chloride is a diatomic gaseous substance. Because it is adiatomic molecule, it will have one vibrational mode and one rotational mode <strong>of</strong>motion. Thus, we can model <strong>HCl</strong> molecules as vibrating rotors.We begin by examining the vibrational motion <strong>of</strong> the molecule and treat theatoms <strong>of</strong> the molecule as being connected by a Hookean spring <strong>of</strong> constant k. Inthis case, the Hamiltonian operator for the system is written as:= (Eq. 1)Solving the Schrodinger wave equation = E for the energy yields:E v = h (v + ½) v = 0, 1, 2, … (Eq. 2)where = (1/2) is the Fundamental <strong>Vibrational</strong> Frequency <strong>of</strong> the system and is itsreduced mass. v is the quantum number associated with the vibrational energy state E v . In
P a g e | 2anticipation <strong>of</strong> discussing spectral lines arising from with energy transitions, we can define thevibrational spectral "Term" as:G(v) = = (v + ½) (Eq. 3)where = /c. h and c are Planck's Constant and the speed <strong>of</strong> light, respectively. If we allowfor non-Hookean behavior, then:G(v) = (v + ½) - (v + ½) 2 (Eq. 4)where is an anharmonicity constant. This anharmonicity correction lowers the energy <strong>of</strong>each vibrational state because the parabolic potential <strong>of</strong> Hookean behavior tends to broaden andflatten and become more Morse like. <strong>The</strong> anharmonicity correction becomes more severe athigher vibrational states where the deviation from Hookean behavior is more pronounced.A couple <strong>of</strong> points must be kept in mind whenconsidering equation 4. First, anharmonicitywill cause the fundamental frequency <strong>of</strong> theoscillator to depend on which vibrationalstate the system is in. Thus, we define anequilibrium fundamental frequency ; thisequals at the bottom <strong>of</strong> the potential wellwhere anharmonicity vanishes. Second, and<strong>of</strong> equation 4 are spectroscopic constantsthat can be measured regardless <strong>of</strong> the modelused for representing the molecule. On theother hand, the spring constant k <strong>of</strong> equation 2depends on the nature <strong>of</strong> the model used torepresent the molecule. This must be kept in mind when we extract values <strong>of</strong> k from themeasured spectroscopic constant .Now, vibrational spectral lines will occur when a photon is absorbed causing an energy transitionfrom E v'' to E v' , where v'' is the lower quantum state and v' is the upper. In terms <strong>of</strong> spectralTerms, this transition is represented as: = G(v') - G(v'') (Eq. 5)<strong>The</strong> fundamental line vibrational spectral linewill be given by = G(1) - G(0).Overtones , etc. are quantumforbidden by the selection rule v = ±1 and soare very weak. (Hot Bands, 1 2, 2 3, etc. arealso very weak because higher vibrational stateswill not be significantly populated due to
P a g e | 3insufficient thermal energy in the system.) Schematically, the spectrum will appear as:Using high resolution spectrometers, it is observed each <strong>of</strong> these lines exhibits more detailedstructure.For instance, at fairly low resolution, the Fundamental Line appears as a doublet. Using a higherresolution spectrometer, it is observed this line exhibits fine structure. At higher resolution yet,each fine structure line is observed to split into a pair <strong>of</strong> lines.<strong>The</strong> fine structure can be explained by considering the rotational motion <strong>of</strong> the <strong>HCl</strong> molecule.<strong>The</strong> splitting <strong>of</strong> each fine structure line can be explained by considering the sample to be madeup <strong>of</strong> a mixture H 35 Cl and H 37 Cl molecules.So, turning to the rotational motion <strong>of</strong> the <strong>HCl</strong> molecule, we treat the molecule as a rigid rotor.Again, we write the system's Hamiltonian operator:= (Eq. 6)
P a g e | 4Solving the Schrodinger wave equation = E for the energy yields:E l = l (l + 1) l = 0, 1, 2, … (Eq. 7)where I = r 2 is the moment <strong>of</strong> inertia <strong>of</strong> the molecule. We define the rotational spectral "Term"as:F(J) = = B J (J + 1) (Eq. 8)where B = h/ 2 c is the system's <strong>Rotational</strong> Constant. (Note: In spectroscopic notation, thequantum number l is denoted by the symbol J.) If we allow for centrifugal distortion as themolecule begins to "spin" faster and faster, then the Term becomes:F(J) = B e J (J + 1) - D e J 2 (J + 1) 2 (Eq. 9)where D e is the Centrifugal Distortion Constant. Again, B e and D e are spectroscopicallydeterminable constants that are independent <strong>of</strong> molelcular model.Expected values <strong>of</strong> "I" suggest these terms will lie very close together and that the spectra lines: = F(J') - F(J'') (Eq. 10)will lie in the microwave region. Here the selection rule for allowed transitions is J = ± 1."Hot" bands are not a problem because the energy levels lie close enoughtogether that thermal population <strong>of</strong> upper rotational states isconsiderable. <strong>The</strong>refore, in microwave spectroscopy, energy transitions,as pictured to the left, will occur.<strong>The</strong>se rotational states will lie on top the vibrational states, giving usspectral Terms T(v,J) = G(v) + F(J). This allows us to describe thefine structure lines as being due to transitions <strong>of</strong> the form: = T(v',J') - T(v'',J'') (Eq. 11)Inserting our expressions for G(v) and F(J) into this equation, we obtainthe following general result for the spectral lines: = (v' - v'') - [(v' - v'')(v' + v'' + 1)]+ B v' J'(J' + 1) - B v'' J''(J'' + 1) - D e J' 2 (J' + 1) 2 + D e J'' 2 (J'' + 1) 2
P a g e | 5(Eq. 12)Note that because the molecule "stretches" slightly as it moves into higher vibrational states, dueto anharmonicity, the internuclear distance r will depend on vibrational quantum number v(denoted as r v ), hence "I" will depend on the vibrational quantum number and therefore "B" willalso depend on the vibrational quantum number (denoted as B v ). We define a vibration-rotationCoupling Constant as e such that the nature <strong>of</strong> B's dependence on v is:B v = B e - e (v + ½) (Eq. 13)A similar problem occurs for the distortion constant D, except the coupling is weak enough wecan neglect it.With all the overlayed rotational fine-structure on the vibrational band, how do we define the"position" <strong>of</strong> the vibrational spectral line? Well, formally, we define the line's Band Originas:= (v' - v'') - [(v' - v'')(v' + v'' + 1)] (Eq. 14)If we are dealing with the fundamental line, then v'' = 0 and v' = 1. <strong>The</strong>n: - 2+ B 1 J'(J' + 1) - B 0 J''(J'' + 1) - D e J' 2 (J' + 1) 2 + D e J'' 2 (J'' + 1) 2(Eq. 15)Now, one <strong>of</strong> two situations can occur; J = J'-J'' = +1 or J = J'-J'' = -1. If J = +1, we are saidto be in the R-branch <strong>of</strong> the line; which occurs at higher wavenumbers. If J = -1, we are in theP-branch; at lower wavenumbers.
P a g e | 6Thus, for the R-branch, we have:R(J'') = J=+1 - 2 + (B 1 + B 0 ) (J''+1)+ (B 1 - B 0 ) (J''+1) 2 - 4D e (J''+1) 3and, for the P-branch, we have:(Eq. 1)P(J'') = J=-1 - 2 - (B 1 + B 0 ) J'' + (B 1 - B 0 ) J'' 2 + 4D e J'' 3(Eq. 17)We now turn to the question <strong>of</strong> how to extract the spectroscopic constants from the measuredpositions <strong>of</strong> the fine-structure lines; R(0), R(1), R(2), …., P(1), P(2), P(3), ….First, how do we extract the rotational constants B 0 and B 1 and the distortion constant D e ?Equations 16 and 17 can be re-arranged to obtain the following forms:= B 1 - 2 D e (J'' 2 + J'' + 1) (Eq. 18)= B 0 - 2 D e (J'' 2 + J'' + 1) (Eq. 19)Thus, measurements <strong>of</strong> R(J'') and P(J''), when plotted according to equations 18 and 19, and theresults subjected to a linear least square analysis, will yield the desired constants.Next, to determine the band origin we use another manipulation <strong>of</strong> equations 16 and 17:= + (B 1 - B 0 ) (J'' + 1) 2 (Eq. 20)Another linear least square analysis is needed to obtain this constant.To obtain and we will need additional information concerning the overtone lines for thecase where v'' = 0. We can rearrange equation 14 to yield the following.= - (v' + 1) (Eq. 21)Again, a linear least square analysis will give us the desired constants. Overtone data for H 35 Clis:Overtone [cm -1 ]0 - 2 5667.98410 - 3 8346.7820 - 4 10922.810 - 5 13396.19
P a g e | 7Next, we can use our measured values <strong>of</strong> B 0 and B 1 , along with additional data, and a linear leastsquare analysis according to equation 13, to determine B e . Needed data for H 35 Cl is:v B [cm -1 ]2 9.8346633 9.5349094 9.23605 8.942Finally, once the spectroscopic constants and B e are determined, we can use our model for the<strong>HCl</strong> molecule to determine the molecular parameters k and r e . e = c = (1/2) (Eq. 22)B e = h / 2 cr e2(Eq. 23)(See development above.) Here r e represents the equilibrium internuclear distance when themolecule is not vibrating. When the molecule moves into vibrational states v = 0,1,2,… it beginsto stretch, due to the anharmonicity <strong>of</strong> the potential, and r increases. Hence, the internucleardistance (really root-mean-square internuclear distance ) will depend on the vibrational statev. From the rotational constants B 0 and B 1 , the root-mean-square internuclear distance betweenthe H and Cl atoms in vibrational states v=0 and v=1, and respectively, can bedetermined.B v = h / 2 c (Eq. 24)Thus, we will experimentally determine the positions <strong>of</strong> all the fine-structures lines R(J'') andP(J'') <strong>of</strong> the fundamental band for H 35 Cl. We will use this information to extract thespectroscopic constants B 0 , B 1 , D e and . We will supplement the fundamental line data withadditional spectroscopic data to determine , and B e . Finally, we will invoke ourmolecular model for <strong>HCl</strong> and determine the constants k and r e , , and .
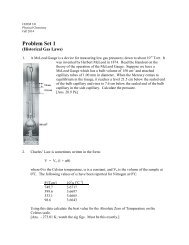
P a g e | 8ProcedureObtain a high resolution Infrared spectrum <strong>of</strong> <strong>HCl</strong> gas. You will use a 10 cm gas cell as picturedbelow.<strong>The</strong> cell will be filled with <strong>HCl</strong> gas via one <strong>of</strong> the methods listed:i) Use a "lecture" gas bottle, as pictured on page one <strong>of</strong> this laboratory, to fill the celldirectly.ii) Treat Sodium Chloride with concentrated Sulfuric Acid to produce the HydrogenChloride gas:NaCl(s) + H 2 SO 4 (l)<strong>HCl</strong>(g) + NaHSO 4 (s)You can do this by dropping, very slowly, ~30 mL <strong>of</strong> conc. H 2 SO 4 into about 5g <strong>of</strong> thesolid NaCl as pictured below.
P a g e | 9Your laboratory instructor will indicate which method <strong>of</strong> filling the gas cell will be used.Once your gas cell is filled with <strong>HCl</strong>, your laboratory instructor will demonstrate the use <strong>of</strong> theIR spectrometer. Take the spectrum with an appropriate resolution to see the fine structure in thefundamental line. Measure the positions <strong>of</strong> R(J'') and P(J'') spectral lines for H 35 Cl.
P a g e | 10Data Analysis<strong>The</strong> following calculations will require linear least squares analyses that are <strong>of</strong> fairly highprecision. Track your significant figures closely and make sure you perform an erroranalysis for each directly measured quantity.1. From your data, determine the spectroscopic constants:B 0 , B 1 and2. Use the supplemental overtone data to determine the spectroscopic constants:and3. Use the supplemental data for rotational constants to determine the spectroscopic constantB e .4. Determine the molecular parameters k, r e , and .5. Use the following data to determine k for alternate isotopic substitutions <strong>of</strong> <strong>HCl</strong>.Molecule e [cm -1 ]D 35 Cl 2145.1630D 37 Cl 2141.826. Use the following data to determine r e for alternate isotopic substitutions <strong>of</strong> <strong>HCl</strong>.Molecule B e [cm -1 ]H 37 Cl 10.578D 35 Cl 5.448794D 37 Cl 5.432
P a g e | 11ReferencesArnaiz, Francisco J. "A Convenient Way to Generate Hydrogen Chloride in the Freshman Lab"J. Chem. Ed. 72 (1995) 1139.Herzberg, G. Spectra <strong>of</strong> Diatomic Molecules Van Nostrand, Princeton, New Jersey, 1950.Levine, Ira N. Physical Chemistry McGraw-Hill, Boston, 2009.Levine, Ira N. Quantum Chemistry Prentice Hall, Englewood Cliffs, New Jersey, 1991.Meyer, Charles F. and Levin, Aaron A. "On the Absorption <strong>Spectrum</strong> <strong>of</strong> Hydrogen Chloride"Phys. Rev. 34 (1929) 44.Pickworth, J. and Thompson, H.W. "<strong>The</strong> Fundamental Vibration-Rotation Band <strong>of</strong> DeuteriumChloride" Proc. R. Soc. London Ser. A 218 (1953) 218.Rank, D.H.; Eastman, D.P; Rao, B.S.; and Wiggins, T.A. "<strong>Rotational</strong> and <strong>Vibrational</strong> Constants<strong>of</strong> the <strong>HCl</strong> 35 and DCl 35 Molecules" J. Opt. Soc. Am. 52 (1961) 1.Sime, Rodney J. Physical Chemistry: Methods, Techniques, and Experiments Saunders CollegePublishing, Philadelphia, 1990.Tipler, Paul A. Physics Worth Publishers, New York, 1976.Van Horne, B.H. and House, C.D. "Near Infrared <strong>Spectrum</strong> <strong>of</strong> DCl" J. Chem. Phys. 25 (1956)56.