constituted - of Planning Commission
constituted - of Planning Commission constituted - of Planning Commission
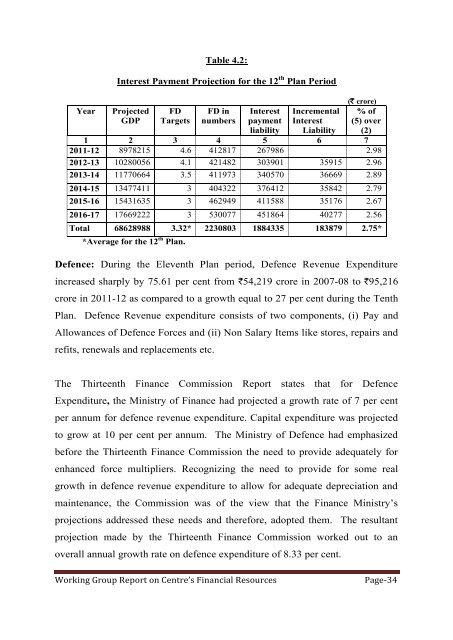
YearTable 4.2:Interest Payment Projection for the 12 th Plan PeriodProjectedGDPFDTargetsFD innumbersInterestpaymentliabilityIncrementalInterestLiability(` crore)% of(5) over(2)1 2 3 4 5 6 72011-12 8978215 4.6 412817 267986 2.982012-13 10280056 4.1 421482 303901 35915 2.962013-14 11770664 3.5 411973 340570 36669 2.892014-15 13477411 3 404322 376412 35842 2.792015-16 15431635 3 462949 411588 35176 2.672016-17 17669222 3 530077 451864 40277 2.56Total 68628988 3.32* 2230803 1884335 183879 2.75**Average for the 12 th Plan.Defence: During the Eleventh Plan period, Defence Revenue Expenditureincreased sharply by 75.61 per cent from `54,219 crore in 2007-08 to `95,216crore in 2011-12 as compared to a growth equal to 27 per cent during the TenthPlan. Defence Revenue expenditure consists of two components, (i) Pay andAllowances of Defence Forces and (ii) Non Salary Items like stores, repairs andrefits, renewals and replacements etc.The Thirteenth Finance Commission Report states that for DefenceExpenditure, the Ministry of Finance had projected a growth rate of 7 per centper annum for defence revenue expenditure. Capital expenditure was projectedto grow at 10 per cent per annum. The Ministry of Defence had emphasizedbefore the Thirteenth Finance Commission the need to provide adequately forenhanced force multipliers. Recognizing the need to provide for some realgrowth in defence revenue expenditure to allow for adequate depreciation andmaintenance, the Commission was of the view that the Finance Ministry’sprojections addressed these needs and therefore, adopted them. The resultantprojection made by the Thirteenth Finance Commission worked out to anoverall annual growth rate on defence expenditure of 8.33 per cent.Working Group Report on Centre’s Financial ResourcesPage-34
As per the MTFPS (2011-12), Defence Services expenditure on revenueaccount is estimated to marginally increase to `95,217 crore in BE 2011-12reflecting a growth of 4.9 per cent over RE 2010-11. As a proportion of GDP,this component is estimated to come down from 1.4 per cent in 2009-10 to 1.1per cent in B.E. 2011-12.As defence revenue expenditure includes pay and allowances for DefenceForces Personnel, the Group went into the breakup of defence revenueexpenditure classifying it as expenditure on pay and allowances and that onother non-plan revenue expenditure. Taking into account the fact that pay andallowances of Defence Force Personnel include a much larger number ofallowances as compared to civilians as also the fact that a Military Service payhas separately been granted to Defence Services Personnel, the Group assumeda growth rate of 8 per cent per annum on the expenditure on pay and allowancesof Defence Service Personnel. For the remaining portion of Defence RevenueExpenditure, a growth rate of 6.5 per cent per annum has been assumed. TheGroup also noted that the projections made by the Working Group forassessment of financial resources during the Eleventh Plan period were basedon an average annual growth rate of 7.2 per cent.Subsidies: Total expenditure on subsidies increased by 102.42 per cent from`70,926 crore in 2007-08 to `1,43,570 in 2011-12. The Thirteenth FinanceCommission was of the view that without subsidy reform it would not bepossible to improve the supply of national public goods and also maintain fiscalprudence. They felt that the time was opportune to implement reforms in theadministration of key subsidies pursuant to the recommendations of the varioushigh-powered committees and other institutions that have provided valuablesuggestions in this regard. They also consulted the line ministries concerned onthe subject to ensure that such reforms can be implemented without adverselyaffecting the consumption capabilities of the target groups.Working Group Report on Centre’s Financial ResourcesPage-35
- Page 1 and 2: Reportof theWorking Group onCentre
- Page 3 and 4: Loans to States and UTs…………
- Page 5 and 6: Chapter-1IntroductionThe Working Gr
- Page 7 and 8: forecasts and, for that matter, all
- Page 9 and 10: the distinction of having the highe
- Page 11 and 12: disintermediation of the Central lo
- Page 13 and 14: 10 per cent in the first year and r
- Page 15 and 16: Report of HLEC Chaired by Dr. C. Ra
- Page 17 and 18: Chapter-2Tax RevenueEstimating tax
- Page 19 and 20: in the projections is to first proj
- Page 21 and 22: Service Tax: For estimation of serv
- Page 23 and 24: uoyancy of 2003-04 to 2007-08 to be
- Page 25 and 26: Chapter-3Non-Tax Revenue and Non-De
- Page 27 and 28: Interest ReceiptsInterest Receipts
- Page 29 and 30: (GoI) is assumed to increase by 5 p
- Page 31 and 32: towards Pension and other Retiremen
- Page 33 and 34: S.N.Table 3.6:Total Non-Tax Revenue
- Page 35 and 36: Chapter-4Non-Plan ExpenditureThe pr
- Page 37: payments as a proportion of non-pla
- Page 41 and 42: provision for fertilizer subsidy ha
- Page 43 and 44: The Thirteenth Finance Commission h
- Page 45 and 46: 5 per cent growth thereon from 2011
- Page 47 and 48: Other Subsidies: For each of their
- Page 49 and 50: Plan by 113.91 per cent from `13,92
- Page 51 and 52: This figure for 2010-11 and 2011-12
- Page 53 and 54: Table 4.5:Revised Base Line Project
- Page 55 and 56: Chapter-5Internal and Extra Budgeta
- Page 57 and 58: Table 5.3:Projected IEBR for the 12
- Page 59 and 60: (e) In several economic and even in
- Page 61 and 62: private sector. This would imply th
- Page 63 and 64: Annexure-IComposition and Terms of
- Page 65 and 66: Annexure-IIComposition of Sub Group
- Page 67 and 68: Nomination of Official/Academician
- Page 69 and 70: Annexure - IV(A)Log Values of CIT,
YearTable 4.2:Interest Payment Projection for the 12 th Plan PeriodProjectedGDPFDTargetsFD innumbersInterestpaymentliabilityIncrementalInterestLiability(` crore)% <strong>of</strong>(5) over(2)1 2 3 4 5 6 72011-12 8978215 4.6 412817 267986 2.982012-13 10280056 4.1 421482 303901 35915 2.962013-14 11770664 3.5 411973 340570 36669 2.892014-15 13477411 3 404322 376412 35842 2.792015-16 15431635 3 462949 411588 35176 2.672016-17 17669222 3 530077 451864 40277 2.56Total 68628988 3.32* 2230803 1884335 183879 2.75**Average for the 12 th Plan.Defence: During the Eleventh Plan period, Defence Revenue Expenditureincreased sharply by 75.61 per cent from `54,219 crore in 2007-08 to `95,216crore in 2011-12 as compared to a growth equal to 27 per cent during the TenthPlan. Defence Revenue expenditure consists <strong>of</strong> two components, (i) Pay andAllowances <strong>of</strong> Defence Forces and (ii) Non Salary Items like stores, repairs andrefits, renewals and replacements etc.The Thirteenth Finance <strong>Commission</strong> Report states that for DefenceExpenditure, the Ministry <strong>of</strong> Finance had projected a growth rate <strong>of</strong> 7 per centper annum for defence revenue expenditure. Capital expenditure was projectedto grow at 10 per cent per annum. The Ministry <strong>of</strong> Defence had emphasizedbefore the Thirteenth Finance <strong>Commission</strong> the need to provide adequately forenhanced force multipliers. Recognizing the need to provide for some realgrowth in defence revenue expenditure to allow for adequate depreciation andmaintenance, the <strong>Commission</strong> was <strong>of</strong> the view that the Finance Ministry’sprojections addressed these needs and therefore, adopted them. The resultantprojection made by the Thirteenth Finance <strong>Commission</strong> worked out to anoverall annual growth rate on defence expenditure <strong>of</strong> 8.33 per cent.Working Group Report on Centre’s Financial ResourcesPage-34


