constituted - of Planning Commission
constituted - of Planning Commission constituted - of Planning Commission
sale price of US$ 95/bbl. Exchange rate has been considered at `45/ US$. Asregards ONGC, net realization rate of US$ 60/bbl for crude oil from nominationblocks has been considered. The Telecom Receipts have been projected for theexisting licenses. While the renewal of a set of licenses may fall during the Planperiod, the same will depend on the policy adopted by the Government forrenewal of these licenses and the decisions to be taken by Courts and AppellateTribunal in some cases. It was decided that these resources being uncertaincould not be included in the projection exercise.The Non-Tax Revenues of Union Territories have been projected to grow at 5per cent per annum. Grants-in-aid and contributions include the receipts fromexternal donor agencies in form of cash or kind. Due to policy of theGovernment regarding bilateral aid, this item has been slowly but steadilydeclining and has been projected at the historic average rate.Items/Year 2010-11RETable 3.5:Projection of NTR for UTs for the 12 th Plan2011-12BE(` crore)2012-13 2013-14 2014-15 2015-16 2016-17UTs withoutLegislatureGrants-inaid/contributions1143 1169 1227 1289 1353 1421 14922756 2173 2130 2087 2045 2004 1964Total Non-Tax RevenueThe total non-tax revenue is projected to increase from `1,17,789 crore in 2012-13 to `1,50,029 crore in 2016-17. This implies about 27.37 per cent increaseover the plan period. The projection of the non-tax revenue by major items isgiven below in Table no. 3.6.Working Group Report on Centre’s Financial ResourcesPage-28
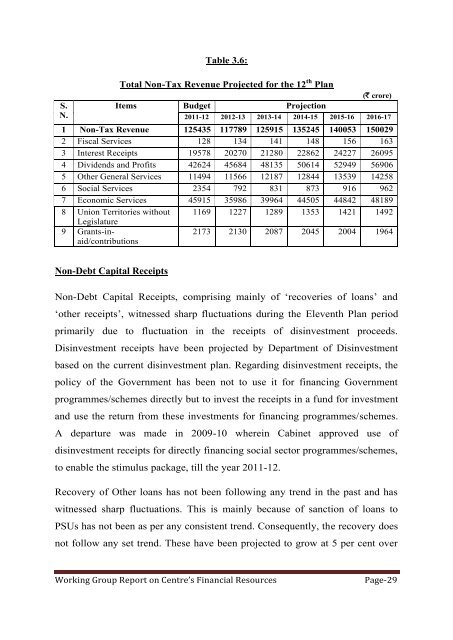
S.N.Table 3.6:Total Non-Tax Revenue Projected for the 12 th PlanItems Budget Projection(` crore)2011-12 2012-13 2013-14 2014-15 2015-16 2016-171 Non-Tax Revenue 125435 117789 125915 135245 140053 1500292 Fiscal Services 128 134 141 148 156 1633 Interest Receipts 19578 20270 21280 22862 24227 260954 Dividends and Profits 42624 45684 48135 50614 52949 569065 Other General Services 11494 11566 12187 12844 13539 142586 Social Services 2354 792 831 873 916 9627 Economic Services 45915 35986 39964 44505 44842 481898 Union Territories without 1169 1227 1289 1353 1421 1492Legislature9 Grants-inaid/contributions2173 2130 2087 2045 2004 1964Non-Debt Capital ReceiptsNon-Debt Capital Receipts, comprising mainly of ‘recoveries of loans’ and‘other receipts’, witnessed sharp fluctuations during the Eleventh Plan periodprimarily due to fluctuation in the receipts of disinvestment proceeds.Disinvestment receipts have been projected by Department of Disinvestmentbased on the current disinvestment plan. Regarding disinvestment receipts, thepolicy of the Government has been not to use it for financing Governmentprogrammes/schemes directly but to invest the receipts in a fund for investmentand use the return from these investments for financing programmes/schemes.A departure was made in 2009-10 wherein Cabinet approved use ofdisinvestment receipts for directly financing social sector programmes/schemes,to enable the stimulus package, till the year 2011-12.Recovery of Other loans has not been following any trend in the past and haswitnessed sharp fluctuations. This is mainly because of sanction of loans toPSUs has not been as per any consistent trend. Consequently, the recovery doesnot follow any set trend. These have been projected to grow at 5 per cent overWorking Group Report on Centre’s Financial ResourcesPage-29
- Page 1 and 2: Reportof theWorking Group onCentre
- Page 3 and 4: Loans to States and UTs…………
- Page 5 and 6: Chapter-1IntroductionThe Working Gr
- Page 7 and 8: forecasts and, for that matter, all
- Page 9 and 10: the distinction of having the highe
- Page 11 and 12: disintermediation of the Central lo
- Page 13 and 14: 10 per cent in the first year and r
- Page 15 and 16: Report of HLEC Chaired by Dr. C. Ra
- Page 17 and 18: Chapter-2Tax RevenueEstimating tax
- Page 19 and 20: in the projections is to first proj
- Page 21 and 22: Service Tax: For estimation of serv
- Page 23 and 24: uoyancy of 2003-04 to 2007-08 to be
- Page 25 and 26: Chapter-3Non-Tax Revenue and Non-De
- Page 27 and 28: Interest ReceiptsInterest Receipts
- Page 29 and 30: (GoI) is assumed to increase by 5 p
- Page 31: towards Pension and other Retiremen
- Page 35 and 36: Chapter-4Non-Plan ExpenditureThe pr
- Page 37 and 38: payments as a proportion of non-pla
- Page 39 and 40: As per the MTFPS (2011-12), Defence
- Page 41 and 42: provision for fertilizer subsidy ha
- Page 43 and 44: The Thirteenth Finance Commission h
- Page 45 and 46: 5 per cent growth thereon from 2011
- Page 47 and 48: Other Subsidies: For each of their
- Page 49 and 50: Plan by 113.91 per cent from `13,92
- Page 51 and 52: This figure for 2010-11 and 2011-12
- Page 53 and 54: Table 4.5:Revised Base Line Project
- Page 55 and 56: Chapter-5Internal and Extra Budgeta
- Page 57 and 58: Table 5.3:Projected IEBR for the 12
- Page 59 and 60: (e) In several economic and even in
- Page 61 and 62: private sector. This would imply th
- Page 63 and 64: Annexure-IComposition and Terms of
- Page 65 and 66: Annexure-IIComposition of Sub Group
- Page 67 and 68: Nomination of Official/Academician
- Page 69 and 70: Annexure - IV(A)Log Values of CIT,
S.N.Table 3.6:Total Non-Tax Revenue Projected for the 12 th PlanItems Budget Projection(` crore)2011-12 2012-13 2013-14 2014-15 2015-16 2016-171 Non-Tax Revenue 125435 117789 125915 135245 140053 1500292 Fiscal Services 128 134 141 148 156 1633 Interest Receipts 19578 20270 21280 22862 24227 260954 Dividends and Pr<strong>of</strong>its 42624 45684 48135 50614 52949 569065 Other General Services 11494 11566 12187 12844 13539 142586 Social Services 2354 792 831 873 916 9627 Economic Services 45915 35986 39964 44505 44842 481898 Union Territories without 1169 1227 1289 1353 1421 1492Legislature9 Grants-inaid/contributions2173 2130 2087 2045 2004 1964Non-Debt Capital ReceiptsNon-Debt Capital Receipts, comprising mainly <strong>of</strong> ‘recoveries <strong>of</strong> loans’ and‘other receipts’, witnessed sharp fluctuations during the Eleventh Plan periodprimarily due to fluctuation in the receipts <strong>of</strong> disinvestment proceeds.Disinvestment receipts have been projected by Department <strong>of</strong> Disinvestmentbased on the current disinvestment plan. Regarding disinvestment receipts, thepolicy <strong>of</strong> the Government has been not to use it for financing Governmentprogrammes/schemes directly but to invest the receipts in a fund for investmentand use the return from these investments for financing programmes/schemes.A departure was made in 2009-10 wherein Cabinet approved use <strong>of</strong>disinvestment receipts for directly financing social sector programmes/schemes,to enable the stimulus package, till the year 2011-12.Recovery <strong>of</strong> Other loans has not been following any trend in the past and haswitnessed sharp fluctuations. This is mainly because <strong>of</strong> sanction <strong>of</strong> loans toPSUs has not been as per any consistent trend. Consequently, the recovery doesnot follow any set trend. These have been projected to grow at 5 per cent overWorking Group Report on Centre’s Financial ResourcesPage-29


