Full Paper (pdf) - Ship Structure Committee
Full Paper (pdf) - Ship Structure Committee
Full Paper (pdf) - Ship Structure Committee

Create successful ePaper yourself
Turn your PDF publications into a flip-book with our unique Google optimized e-Paper software.
,@C.1w,.THE SOCIETY OF NAVAL ARCHITECTS AND MARINE ENGINEERS>e One World Trade Center, Suite 1369, New York, N,Y, 10048>?”’*3 PaPer$ to be presented at Extreme load. R,SPO”S,~:Arli”ston, VA, October 19-20, 1981Symposium;+ co.5% ,*L . ,*,,+\”+@Fatigue Criteria for <strong>Ship</strong> <strong>Structure</strong> DetailsW. H. Munse, University of Illinois, U;bana, ILABSTWCTFatigue criteria are presented forthe design of ship structures. l%ecriteria take into account the ships tructure details, the fatigue resistanceof specific locations in thesedetails, the variable loading to whicha ship is subj ected, and the desiredlevel of reliability (factor of safety)A design example indicates the simplemanner in which the criteria can beuseti.NOMENCLATURElogcfs(s)The life intercept of theS-N curveProbability density function-Weibull distribution(Equation 2)(s~ax)N = The maximum stress range ofa variable Ioadi”g historythat is expec ed to producefailure in 10~cycles‘N‘Io8w‘Lrus= Mean constant-cycle stressrange for failure at N cycles.= The maximum stress range expectedto occur once in 108cycles, based o“ a Weibulldistribution.= Characteristic value of S(Equation 5)= Scatter factor (Equation 11)= Gamma func tio”= Mean stress of the Weibulldistribution (Equation 3)kShape parameter for theWeibull distributionE= Random load factor (Equation7)L(n)mN(PF)‘FsSD(sD)all =The probability of mfailure through a life, n(Equation 9)Negative slope of S-N curveThe mean life necessary toproduce a useful life n witha reliability of L(n)Probability= [l-L(n)]of failureReliability factor(Equation 13)StressrangeConstant-cycle fatiguedesign stress range for auseful life n and reliabilityL(n)The maximum allowablefatigue stress range(Equation 15)5s‘NINTRODUCTION= Standard ieviation of theWeibull distribution.= Total uncertainty in fatiguelife (coefficient ofvariation)Fatigue cracking in ships has beena serious problem for many years Asnoted by Vedeler (1)1 in 1962, shipbuildersin Norway and Sweden cons ideredthe problem of fatigue in shipsto be of more practical importance forordinary ships than the question ofbrittle fracture, He noted that fatiguecracks were often found in theforepeak region, bottom amidships, atthe bulwark at both ends of the bridge,and in the hatch corners In a recentstuciy it has been observed that shipsmay also have cracks at crossings offrames, longitudinal, and girders ,and many other locations (2, 3 and 4)in1 Referenceparentheses.numbers are indicated&23.1
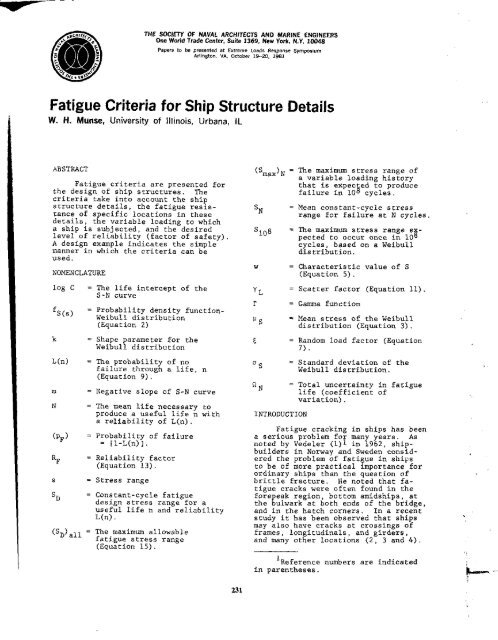
Since such cracks may be possiblepoints of initiation for catastrophicfailures and, since the repair of fatiguecracks can be very costly, it isessential that fatigue be given adequateconsideration i“ the design ofship structuresIn this paper criteria are pz-esentedfor the fatigue design of shipstructural details along with a briefdiscussion of the principal parametersincluded in the criteria. 2 An exampleof the application of these designcrireria is then presented to indicatethe simple manner in which the criteriacan be used to provide a verificationof the adequacy of a ship in fatigue.FATIGUE DESIGN PARAMETERSFatigue design generally consistsof verifying that the details of astructure have sufficient resistanceto repeated loading to provide a fatiguelife equal to or greater thanrequired: a wrifica, tion by checkingDrocess To achieve this for shiu;tructure details , criteria have ~eende”eloped which takes into account,(a) the basic fatigue behavior ofwelded structural details, (b) thetYPes Of details found in ship structuresat which cracking has been observed,(c) the loading histories towhich ships may be subjected, and (d)the level of fatigue safety to be includedin the ship design.There are other factors that canaffect the fatigue behavior of a structurealso ; however, their importanceor effect is not as great as the effecto f those noted above and to includethem would have greatly complicatedthe overall design process. Theseneglected factors include, (a) themean stress effect, an effect that isrelatively small for welded detailsand is now neglected in most fatiguedesign specifications , (b) the tensilestrength of the steel, another factorthat is generally neglected in structuralfatigue design specificationsand considered to have relativelylittle effect in long life fatieue.and (c) tempera ture,-rate of lo~dapplication, residual stresses, andsize effect, again factors that areEenerally found to be of secondaryZmport anieFatigue Behavior of WeldmentsDuring the nearly 50 years oflaboratory studies conducted on weldments, numerous papers , conferenceproceedings and books have been publishedwherein detailed fatigue datafor welds and weldments may be found(5-11) Recently, much of this informationhas been re-examined to estab.lish basic S-N relationships fornumerous types of welded members anddetails (12) Nearlv 1500 S-N curveshave beeri p;oduced, &ne example ofwhich is presented in Fig. 1. (Thisis the S-N curve for axially loaded longitudinalfdl penetration groovewelds with the reinforcement intact;based on stress range; and for mild,high strength low alloy or quenchedand tempered steels. Identified byDAAAXB)The solid line mean regressioncurve (50% reliability) of Fig. 1, asestablished by a least-square analysis ,can be given by,Log N=log C-mlog SN (1)where,log c =N=m=~;or SN = (N) (la)the life intercept of theS-N curvenumber of cycles to failurefor a constant cycle stressrange of SN,the negatiw slope of theS-N curve‘N =the constant-cycle stressrange for failure at Ncyci’es.Using such straight-line relationships, the mean fati ue stress rangesfor lives of 105, 10~, 107, 108 cycles,have been established for numerouswelded members and details , and arepresented in Table 13, These mean fatiguestrengths are for the numerousstructural fatigue details shown inFig. 2.For each of the details shown inFig. 2, the location at “hich the fatiguestrength applies is the pointwhere the greatest *tress concentrationexists and, except as noted, ca” be2 The ship design criteria presentedherein were developed in an investigationconducted at the University ofIllinois and sponsored by tbe Snip<strong>Structure</strong> <strong>Committee</strong>,3 Under random loadings straightlineS-N relationships are found toextend well beyond the fatigue limitsoften reported for constant cycletests (10) Therefore: in this development,the straight-line S-N relationshiphas been assumed to extend to 108cycles or more.232
2001“1 I 1 1 1 1 ! Ill [ 1 1 1 1 1 1 111 1 1 ) 1 1 1 [ Iu J 1 11 , 1 I ++~LB,,? TGLFF7CNU L ,“ !, s,,. 5..,, “K(OJ9,,: CO.r)[)[kct LCWL -m60.m.,, .=-. --- =-—-- =---t-.—- --------._ . . .4-1++tHtH-–++ +-++-}+ H’, 5 , 10,!, : , , 5,,,,CYCLES TO FF!lLL!RE,IN TH12U5RNC’5Fig. 1. S-N Relationship for a Weldment Containing a Longitudinal Grooveweld in the As-Welded Condition, (Detail No. 3)considered to be a function of the principaltensile stress at that location.This location, for example, is at theend of the cover plate for detail No. 5,is at the toe of the butt weld for detailNo. 10, and is at the side of thehole in detail No. 28.The data in Table I and the diagramsof Fig. 2 provide the basic fatigueinformation on which the fatiguedesign criteria presented herein arebased.been identified and will provide guidancein locating the details for whichpossible fatigue failure should bechecked (22) AII example of a few ofthese families and configurations ofdetails is presented in Fig. 3.The locations in Fig. 3 at whichfatigue cracking might develop are circledand identified by the correspond-~g structural detail number from Fig,(The basic fatizue resistance forthe ‘detail is provi~ed in Table 1)<strong>Ship</strong>DetailsAfter the basic fatigue data hadbeen assenbled, the second phase inthe development of tbe fatigue designprocedure was the identification ofthose ship locations at which fatiguecrackine mi’zht occur. Two recent reportso; th~ in-service performance ofstructural ship details (3, 4) haveserved to define possible fatigue criti -cal locations in &hips These-reportscatalog and define the types and locationsof details at which failureshave occured in a variety of merchantand Naval vessels.A total of 86 ships were includedin the surveys The details examinedwere separated into twelve generalfamilies (see Table II) and these werein turn divided into 56 zrouDs of 634separate configurations. - A ~otal of6856 failures were found in the 607584details observed. In the investigationon which this paper is based, the locationsin each of these confi~urationsat which fatigue might devel~p haveNot all details in Fig, 2 are foundin ships and not all of the detailsused in the ships surveyed ha”e exhibitedcracks Only the thirty-seven detailslisted in Table III are those forwhich cracking was reported and then,some of the details exhibited only avery limited number of cracks Thosefor which the largest number of crackswere found are those for which thesefstigue design criteria will be ofsvceatest value, However. in design a?atig”e evalwition shodd be made-ofall details for which fatigue crackingis a possibility,<strong>Ship</strong> LoadingsTo properly evaluate the fatigueadequacy of a ship detail requires arealistic estimate of the cvclic stresshistory to which the detail-will be subjectedduring its lifetime. Since theexisting full-scale ship loading dataare for a limited length of time. ithas been necessary to-extrapolate theavailable data to obtain an estimatedlifetime spectrum (13 , 14) Such233
TASLEIMean Fatigue Stress Range for Fatigue Details in Fig. 2(Constant Cycle - 0,50 Reliability)Detalil S-N Stress Range, ksi, for n cycles2Slope,(seYIJig, 2) m ~ = 105 ~ = 106 “ = 107 ~ = 10811 (F)233 (G)4565.734.806.055.775.946.083.256,0869.467.161,544.141.241.426,441.446,541.542,029,627.928,313.0228.331,125.728,719.919.019,46.4219.4120.815.919.6213,3312.8713.303.1613.3099(s)101O(G)1111(G)12(G)12131415:! (G)17(s)4.116.549.648.857,449.326.136.655.663.984.237.433.484.636.973.739.5239,855,832.64839.947.233.129.440,835,048.340,625,9832,832.827,828,922.7139,225,73729,336.922.7322.527,219.628.029,813.4019.9323,615,0022.712.9727,620.228.521.528.815,6217.2618,0911.0016.2721.86,9112,1216.948.1017.817.4119.415.9222.015,7622.4910.7313.2312.056.179.4416,033.577.3712.174.3713.991818(s)1919(s)2020(s)2121(s)2223242526A25B26274.039.227.497.533.946.443.947.363.153.263.267.098.533.953,464.8520.3025.723.127,532.928.02(:;;:)39,835.735.733.249.9(;::;)22.811.4620.0217,0020,2818,3619.60(~M:36)19,1617.617.624.038,1(;:::;)14,176.4715.6012.4914.9310.2313.71(;;:;3)9,228,688,6817.3629.1(M:j:)8.813.6512,159.1810,995.709.59(5,70)16.594,434,284.2812.5422.20(::~:)5.4627(S)2828(F)29;;#)4.487.744.8122,840,1(29.4)13.8329.8(18.21)8,1622,11(11,28)4.8816.42(6,99)29R2302,8338~016,837,463,31234
TABLE I (CONTINUED)Detail S-NStress Range, ksi, for n cycles2No .1 Slope,(See Fig. 2) m n = 105 ~ = 106 7n=10~ = 10830A31;;A32B32c::(s)(::;;)3;483.533.6610.39(34.o)(20,16)(;::g:)21;3425,5(23.5)(11.87)(;:i;y)11~3820,45(16.1)(6.99)(:;:;)6;0716.38(:;:;:](:;:;)3;2313.123434(s)353636A3737s383.6610.393.553.953.953.71(21.34)(:::;)34.934.932-(11.38)(;;:$:)19.5119,5117.2(6.07)(1::::)10,8910.899;24(3.23)(1::l..)6.086.084:97:; (s)10.2316.2713,0010.378.2839A39B39C4041423.535.02(21~50)110,2(11:21)69;8(5;84)44,08(3:04)27;884343A4445464747A484:35(20~16)(11~87)(6:99)(4112)48R49505152531 (S) Indicatesshear stress on fasteners or welds(F) Indicatesflamecut surfaces.(G) Indicatesthe surfaces have been ground flush‘Estimated values are shown in parentheses ( )A dash is provided where no data are available235
-==2-29( F)-2929RI (Radi.3 = l14~,to1/2”)29 R2(Rodi. s ,1/2 Iol )‘w.cC===D’>30A3;(s)-37)c38( S)-38c e=c1 31“ ,“, -,”7/’- L~ #&&J-&.32‘f3==J-yp-13Fig. 2, Structural Fatigue - Details236_ —.
1390738 37T(a) Family No.I(AI)T39-... . . . .26 2620,21(b) Family No,l(B4)742‘\7b25B 2130Zf(s)(c) Family No, 2 (c2)m 4936 36W_25 ; 3333s(d) Family No. 3( AI)III7f(e) Family No,8 (A3)(f) Family No, II(AIO)Fig. 3. Examples of Configurations inship family details (3,4)45ATABLEIIIDetails Exhibiting Failures i“ <strong>Ship</strong>snct&Jl,TotalDetail No. o—. No. CrackDetail&TotalNo. ofCracks*+L@51‘k- –-#--52r-lL..“c3cJ-47F //53(G) - Designates a ground surface(S) - Designates shear on weld orfastener(F) Designates flame-cut edges f.aicomparisonwith machined edgesFig,2,Structural Fatigue-Details (cent79141717s1919s202121s262828F2929R29F3030A2727724240318130054155208222937142672‘232B3333s3434s36373840414243444748R50515253236202317600462821177514292526871058237i--
~BLEIISummary of Data for 12 Detail Families (Ref. 4)TotalsObserved?amily Detail Family Total No, Total No, zNo,NameDetails Failures Failures1 Beam Bracket 68,586 2,252 3.2B2 Tripping Bracket 34,o12 1,587 4.673 Non-Tight Collar 20,974 33 0,164 Tight Collar 20,654 46 0.225 Gunwale Connect ion 172 5 2.916 Knife Edges o 07 Miscellaneous Cutouts 296,689 853 0.298 Clearance Cutouts 57,307 843 1.479 Deck Cutouts 7,534 29 0.3810 Stanchion Ends 7,090 122 1.7211 Stiffener Ends 40,729 298 0.7312 Panel Stiffeners 53,827 788 1,46Totals 607,584 6,856 1,13)238
extrapolations , plotted on a semi-logcumulative distribution basis for largetankers and dry cargo vessels are presentedin Fig, 4 and are based on thewave- induced longitudinal bendingstresses. A complete loading historyshould include also the high-frequencydynamic loadings However, since theseare generally of a relatively smallstress-range and would produce littledamage they have been neglected in thepresent study. (The somewhat conservativeprevious assumption that the S-Ncurve is linear to 108 cycles tends tocompensate for this neglect of the highfrequencystresses. ) Nevertheless, ifit can be demonstrated that the stressranges for the expected high-frequencyloadings will not be small (above about6 ksi), then they should be included inthe total loading history,35 >....30 “5Ft% f 765432[ o- LOG “(a ) Service Stresses In Large Tankers. (13)To use the fatigue design criteriadeveloped herein requires that the loadinghistory be represented in probabilisticterms by a probability distributionfunc tion. A variety of distributionfunctions were investigated,including the Beta, Lognormal, Weibull,Exponential and Sayleigh distributions;however, the evaluation clearly indicatedthat the Weibull distributionwould most effectively define existingship loading data,The two parameter Weibull probabilitydistribution function can providemany shapes to model the loading history,including those of the Exponentialand Sayleigh distributions , and is givenby:fs(s) = $ ($k-1 exp [-(~)k] (2)where:k = shapeparameterw = characteristic value of ss =stress.Q(x > Xj) TOTAL PROBABILITY OF EXCEEDING Xl(b1 ServiceStressesInDry Cargo Vessels,(14)Fig. 4. Long-Term Trends in ServiceStresses for Large Tankers and DryCargo Vessels (13,14)The mea” stress of the distributicm is ,us=wr(l+ l/k) (3)and the standard deviation is ,“s =w [r(l + Z/k) - rz(l + l/k) ]1f2 (4)where;r = Ganuna functionThe general configurations of sevei--al Weibull distributions (various valuesof k) are shown in Fig, 5. These aresimilar to the distributions often reportedfor strain measurements made onships at sea, An indication of the excellentfit of a Weibull distributionwith k = 1,2 and the data obtained fromSea-Lands SL-7 shipboard measurements(15) is presented in Fig. 6.Stress,Fig. 5. General Shapes of WeibullDistributionsS239
3020100010 20 30 40s(Max. Peak-to-Trough Stress, kei)Fig. 6. SL-7 Scratch Gage Datawith Corresponding Iieihull Distribution(16)To obtain tieibull distributionsthat represent ship loading stress histories,the mean, the standard deviationand the coefficient of variacianfor the distributions are made equal tothe corresponding values for the shipdata. First, the appropriate value ofche Weibull distribution parameter kcan be obtained from Table IV by makingthe coefficient of variation for theWeibull distribution (standard deviationfmean)equal to the coefficient ofvariation fcm the his trograms, Next,the value of parameter w is obtainedfrom the following:“.usr(l +I/k)TABLEIVTable of Weibull Shape ParameterValues and CorrespondingCoefficients of VariationWeibull ShapeParameterk0,50,60.70,80.91.01.11.21.31,41.51,61.71.81.92,0Coefficient ofVariation62,2361.7581,4621,2611,1131,0000.9100.8370.7760,7240.6790,6400.6050.5750.5470.523(5)The above procedure has been followedto establish values of k for avariety of ships for which loading histOrydata ~re available. These values~elg~en .Ln Table V and ra~g~ from 0.7Tbe shapes of the functionsare presented in Fig, 7 and are similarto those for the ships shown in Fig. 4.It should be noted that the larger ships(tankers and bulk carriers) tend to haveloading shape parameters equal to orgreater than 1.0.For the Weibull distribution functions,the maximum stress-range expectedtO be reached once in a ship, s lifetimeof 108 cycles (estimated to be a 20 yearlife) can be determined from the followingequation:S~08 = w [ln (52000)]1/k (6)The predicted values of S~08 for theships for which loading history dataare available are give” in Table V andrange from 10 ksi to 34.1 ksi.RandomLoad FactorIn the fatigue design procedurepresented herein tbe constant-cyclefatigue stress range in Eq. 1 must bemodified to account for the random loadingrepresented by the Weibull distributionfunctions This can be done readilyand simply by introducing a random loadfactor, c (16).The random load factor is based onthe assumption that the stress rangehistory can be modeled by the two-parameterWeibull distribution functionwith a maximum stress range equal toS108 and a minim~ stress range equalto zero and is given by:C = (lnN)llk [r(l + m/k)] -l/m (7)This factor, as developed by Ang andMunse (16) , is based on the ap licationof Miner’s linear damage hypotI!”C?SIS tothe random loading represented by theWeibull probability density function ofEq. 2. A tabulation of the random loadfactors for various values of k and mare presented in Table VI for a life of108 cycles. (A comparable table couldreadily be prepared for any other life.)Using the random stress factor fromEq. 7 (Table VI) (a factor that correspondsto a specific Weibull distributionand S-N curve slope) , and the meanfatigue stress range from Table I forspecific detail, one can readily obtainthe maximum stress of the variable loadingthat can be expected to producefailure at 108 cycles This maximumstress is :(smax)N = SNE.’240p.-
I.c0,8_s_s.0,60.40.20-( -b -> -4 -3 -2 -1 0Log [1- FS(S)]Fig. 7. <strong>Ship</strong> Loading Histories Nodeled by Weibull DistributionsTABLE V<strong>Ship</strong> Loading His tories Compared With Weibull DistributionsType of<strong>Ship</strong>Stress Change atWeibull Probability ofLoad EXCe danceName of <strong>Ship</strong> NOtes Shape, k = 105,S108 (ksi)Dry Cargo Wolverine State 1.216,5California State l~;1.0 18,0Mormacs Can 1,5,7 1.3 12.0Mormacscan 1,5,6 1.0 10,0Large Tankers Idemitsu Mar” 2,5 1.0 12.3R. G. Follis 2,5 0.8 30.0Esso Malaysia 2,5 0.8 21.8Universe Ireland 2,3,5, 0.7 18,7Bulk Carrier Fotini L. 2,5 0,9 29,5SL- 7 Container- See Note 9 4,6,9 1.2 34.1shipsData from ref. (14)Data from ref. (20)Data from ref. (21)Data from ref. (15)Load history is for wave-induced loading withdynamic effects filtered.Load history is for wave-induced loading withdynamic effeet included,Load history based on North Atlantic voyagesLoad history based on ,South American voyages.Load history hased on data collected from eightSL-7 containerships241
——TABLEVIRandom Load FactorsRandom Load Factors , Emk=O.7 k=O.8 k=O .9 k=l. O k=l.1 k=l,2 k=l,32.02,53.03.54.04.55.05,56.06.57.07.58.08.59.09.510.028.6323,1219.2316.3514.1512.4111.019.878.918.117.426..S36.315,865.465.114.7920.9317.4914.9613.0411.5310.319.318.487.777.166.646.185.785.425,104,814.5516,1713.8612.1210.779.688.798.047.416.876.405.995.625.305.014.754.524,3013.0211.3910.149.148.327.647.076,586.155.785.455.164,894.664.444.254,0710.839.638.697.937,306.766.315.925.585.275.004,764.544.354.174.003.859.248.337.607.006.506,075.715.395.104,854,634,434.244.083.923.783.658.057.336.756.275.865.525.214,954.714.504.314.143.983.843.713.593.48Values are based on a life of 108 cycles For any other life N,the values in this table would be multiplied by:(,n N)ljk(18,42)1/kThe term SN is the mean constant-cyclestress range from Table I that would beL(n)expected to produce a fatigue failure-1,08in the selected detail at N cycles = exp -[~ r(l + nN1”08)]QNHowever, the value so determined is the {1 (9)mean value (50 percent level of reliabil - where:ity) and must be modified by a reliabilityfactor (factor of safety) to obtainN = mean life to fatigue failure= total uncertainty in fatiguean appropriate maximum design stress ‘Nmvalue.R~bility Factor (Factor of Safety)The basic relationships for the fatiguereliability design criteria developedherein have been presented by Ang(17) in his development of reliabilityanalysis for design. In this analysisit is recognized that the fatigue lifeOf a structural detail is a random vari -able and assumed that its distributioncan be represented by an approximationto the Weibull distribution (18) hthis basis , the reliability function(the probability of no failure througha life n) can be given by:The total uncertainty is a functionof the uncertainly in the meanfatigue strength (Table I) , the uncertaintyin the stress analysis, effectsof fabrication, workmanship, corrosion,etc. The uncertainty in the mean fatiguestrength (standard deviationdivided by the mean) varies considerablyfrom one detail to the next b“c averagesabout 0,50 (from 0.2 to 0.8 dependingupon the detail, the amount of data,etc.) for the details in Table 1, Relativelylittle is kmwn concerning tbeother factors, Nevertheless, untilbetter values can be established it isrecommended that an estimated value of~ uncertainty of 0.80 be used.242
To utilize the reliability functionin design, the mean life N neces.ary to produce a useful life n with areliability of L(n) is obtained fromfrom the following:N = nyL(lo)where yL is tbe scatter factor and isgiven by equation 11 (Fig. 8)~L =r(l+nN‘N(PF)1,08,1.08 (11)where :(PF) = the probability of failureand equal to [1 - L(II)].In Fig. 8 it can be seen that a 99 percentlevel of reliability (one percentprobability of failure) , and an uncertaintyin life $2N = O.50, would requirea design for a life N equal to about 8times the expected useful life n.Under constant-cycle stress range,from equation (la) , the required designI041 15 \ I~j=r(l+akoa)(P’P-w //1031~f=lo->//’5 /[/’Y~// // “ ,/102/’ ,/5 /[ f IX[r“ / /15 —1/ r 1//i /“./’ ‘// Y /“I o 0.2 0.4 0.6 0.8 1,0finFig. 8. Relationship Between theScatter Faccor and the Uncertaintyin Fatigue Life and Various Probabilitiesof Failure (17)/’/stress for a specified level of reliabilitywill be given by:SD = (f) Urn(12)orSD = + lf~ (L)h(lza)‘Lwhere:= constant cycle design stress‘Drange for a useful life ~ anda specified reliability L(n)Designating the Iast term of equation(1.2a)as the ‘Reliability Factor, , RF,and the allowable constant-cycle designstress becomes,‘D=SN. RF (14)The value of RF for three levels ofreliability, various S-N curve slopes,and uncertainties $2N equal to O.4, 0.6or O.8 can be obtained from Table VII.FATIGUEDES IGNWith the relationships presentedabove a simple fatigue verification ordesign procedure that takes into accountthe principal fatigue parameterscan now be provided. Table VIII showsthe six steps of the procedure to befollowed to verify the adequacy of agiven ship strueture detail in fatigue.In step 1 the expected loading historyfor the ship detail must be established(the shape factor for the Weibulldistribution selected) Some guidancecan be obtained from Table V, a summaryof the limited data now available. Asmore complete data are obtained concerningship loading histories, the valuesin Table V can be expanded, improvedand updated to provide the designexwith the best possible guidance.In the second step the ship detailsat which the fatigue resistance shouldbe checked must be identified. Thecritical locations in the ship assemblies, such as shown in Fig, 3, can beused to identify the critical detailsin terms of the numerous details shownin Fig. 2, (k extensive summary of detailsin the twelve families of TableII are presented in the Reference 22Report)The third step is to obtain, forthe detail, the fatigue strength andslope of the S-N curve (this comes fromTable I). The fourth step is to obtainthe random load factor from Table VI,and the fifth step is to select the243
TABLE VIIIDes ign Proceaure1.<strong>Ship</strong> LoadingDistribution Choose a loading shape parameter k,of the Weibull distribution.2. <strong>Ship</strong> Detail Identify the number designation of+ Catalogs the critical details (Figs 2 and 3), 1ISW curve slope, m, of detailNean fatigue stress-range,for detail.4.5.YDesignTable 6Find randomk-value andload factor, C, based onm-”alue.Design Find reliability factor, Rf, baSed onTable 6 m-value and ~N-”al”e for desired le”elof reliability,6. Design Equation Cmnp”te allowable stress-range (SD)=ll,(SD)all=SN. c .RF for probability of exceedanceof 10-8.zappropriate reliability factor fromTable VII. The maximum allowable fatiguestress range, (sD)all4, is rhenobtained from the following equation(SD) =SN. L.+ (15)This relationship, using Table VI, isbased on a desired life of 108 cycles.For any other life the values, as notedon Table VI, would need to be modified,A design example for a beam bracketwith four structural details is presentedin Fig. 9. In this instance, theWeibull shape factor far the loadinghistory was taken as 1.0, the total “certaintyin fatigue life as O.80 andthe desired level of reliability wasassumed to be equal to 90 percent. Theresulting maximum allowable fatigwsstress range at the deck-bulkhead intersection(detail 39B) is found to be31.8 ksi, This maximum stress-range4 Ṫhis maximum allowable stressrange at the point in question, is themaximum peak-to-trough stress range expectedunder the most severe sea stateand during the entire life of the structure.provides only for fatigue; in addition,the maximum stress must not exceed thenominal permissible design stress providedby the basic design rules (19)For detail number 7, at the toe of thestiffener weld in the web and flange,the maximum allowable fatigue stressrange is 39.7 ksi for a 20 year life,Similar calculaticms can readily bemade for details number 37 and 38.SUNMARY AND CONCLUSIONS:This paper summarizes a simple designprocedure that has been developedto provide for a fatigue strength verificationin ship design, The criteriaprovides for:(a)(b)(c)A large variety in ship strueturedetails.The basic fatigue resistance ofthe numerous “elded details.A distribution function thatcan be used to represent thelong life loading (1o8 cycles-20 years) for various typesof ships.1244
Fig. 9. Design Example<strong>Ship</strong> Assembly IA I - Beam Bracket (Fig, 3a)Detail No. (S)]oe(See Fig. 2) (See Table H*7 7,41 4.11 Reliability - 90%39 B 5.9 Est. 4.0 Est. Coef, of Var. -0.8037 5,0 Est. 3.7 Est, Weibull Dist, k = 1,038 4.97 3.71~e - Detail 39B(S)loa = 5.9 ksi Est. m = 4,0 Est. (Table 1)Reliability Factor = 0.648 (Table 7)Random Load Factor = 8.32 (Table 6)Max. Allawable Stress Range = 5.9x 0,648x8.32 = 31.8 ksiConsidering Stiffener Detoil - Detail 7(S)108= 741 ksi m =4.11RF = 0.655 [ = 8.17Max. Allowable Stress Range = 7.41 x 0.655 x 8.17 = 39.7 ksii-245
TABLEReliabilityVIIFactorsm2.02.53.03.54.04.55.05.56.o6.57.07.58.08.59.0IReliability Factors, RFIR = 90%IK = 95%‘N ‘N0,40 0.60 0.80 0,40 0,60 0.80.691 .546 .420 .608 .447 .320.744 .616 ,500 .671 .525 .402.782 .668 .561 .717 .585 .468.810 ,708 .609 .752 .631 .521.831 .739 .648 .780 ,669 ,566.849 .764 ,680 .8o1 ,699 .603.863 ,785 .707 .819 .725 .634,874 .602 .730 ,834 .746 .661.884 .817 ,749 .847 .765 .684.893 .830 .766 .858 .781 .705.910 .841 .781 .867 .795 .722.906 ..s51 .794 .876 .807 .738.912 .860 .805 .883 ,818 .752.917 .867 ,815 .889 .827 ,765.921 .874 .825 .895 .836 ,776IR = 99%‘N0.40 0.60 0.80.451 .281 .170.528 .362 .242.588 .429 .307.634 .484 .363.671 .530 .412.702 .569 .455,727 .602 .492.748 .630 .525.767 .655 .554.782 .677 .580.796 .696 .603,808 .713 .623.819 .728 .642.829 .742 .659.838 ,754 .675(d) A random loading factor that the author and not necessarily thoseaccounts for the randomness of the Advisory <strong>Committee</strong> of the <strong>Ship</strong>of the loading during the life <strong>Structure</strong> Connnittee under whose guidofthe structure. ante the investigation on which thispaper is based was conducted.(e) A reliability factor (Factor ofSafety) that accounts for the KEFEKSNCESmany uncertainties that existThe values of maximum allowablefatigue stress range obtained in thedesign example provides an excellentcalibration of the procedure and isconsidered very reasonable, based onthe history of such details in theships at sea. Additional evaluationsnow should be made of those details atwhich fatigue failures have developedto further evaluate and calibrate theDrocedure. After the rmocedure has~een further verified,’ it should bepossible also to use the procedure todevelop relative fatigue ratings forthe manv details used for shiD struc -tures.The opinions herein are those of1. Vedeler, G, , “To What Extent DoBrittle Fracture and FatigueInterest <strong>Ship</strong>builders Today, ”Houdremont Lecture 1962,Sveiseteknikk 1962, No. 3.2. GLasfeLd, R. , Jordan, D. , Ken, M. ,Jr. , and Zoner, D. “Review of<strong>Ship</strong> <strong>Structure</strong> Deta~Ls, ” SSC-266,1977.3. Jordan, C. R. , Cochran, C. S. , “In-Service Performance of StructuralDetail s,” SSC-272, 1978,4. Jordan, C. R. and Knight, L. T.,“Further Survey of In-ServicePerformance of Structural Details,” SSC-294, 1980.246—
5678,9.10.11Munse, W. H. , Fatigue of WeldedSteel <strong>Structure</strong>s, We ~ng Res earthCouncil, New York (1964)Gurney, T. R, , Fatigue of Welded<strong>Structure</strong>s, Cambridge U. Press ,England i968)B,W.R.A, , “Symposium on the FatigueOf welded structures, March 29.April 1, 1960, “ Bri Ei~h welding J.(March-Sept, 1960)Muse, W. H. , Stallmeyer, J. E. ,and Drew, F. P, , “str”~wr~lFatigue and Steel RailroadBridges ,” PXOC. , AREA Seminar(1968)“Symposium on Structural Fatigue, “J. of the Structural Div. , ASCE(Dec. 1965) M, No. ST12, 2663-2797,The Welding Ins citute, ‘pProceedingsof the Conference on Fatigue ofWelded <strong>Structure</strong>s ,,,July 6.9,1970, The Welding Institute,Cambridge, England (1971)Pollard, B, and Cover, R, J. ,“Fatigue of Steel Weldments, ‘qWeldin J. , American Welding Soc.*) ~, No. 11, 544s-1718.19.20.21.22.!mg, A. H-S,, “A Comprehend iveBasis for Reliability Analysisand Design, “ ~, U. S, - JapanJoint Seminar on Reliability~pPrOach in Structural Engineer-~ng, Tokyo, Japan, May 19?4.Fre”denthal, A, M, , !,Prediction ofFatigue Failure, ,,J. Appl phy~(Dec. 1960) ~, No, 1’2,2196-2198A, B,S., “Rules for Building andClassing Steel Vessels, “ AmericanBureau of <strong>Ship</strong>ping, 1979.Little, R. S. , Lewis, E. V, andBailey, F, C., “A StatisticalStudy of Wave Induced BendingMcments on Large Oceangoing Tankersand Bulk Carriers ,“ Trans.SNAME, 1971.Lewis , E. V. and Zubaly, R. B. ,“Dynamic Loadings Due to Wavesand <strong>Ship</strong> Motions, ,,SNAME, 1975,Munse, W, H., Investigation at theUniveristy of Illinois - Studyof Fatigue Characterization ofFabricated <strong>Ship</strong> Details j ProjectSR-1257 , <strong>Ship</strong> <strong>Structure</strong> <strong>Committee</strong>u,Munse, W. H. , Pierce, R. C. , Martin,S. A,, Maybe”, L, , and Mahini, B, ,“Basic Material Fatigue Propertiesfor Use in Freight Car FatigueAnalysis, ” Civil Engineering Department,University of Illinoisat Urbana-Champaign, March 1981,13.Bridge, I. C,, “Structural Stressin an Oil Tanker under ServiceConditions, ,,Trans , I.N,A, , p,161, 1938,14.Hoffman, D. and Lewis , E. v, ,“Analysis and Interpretationof <strong>Full</strong>-Scale Data on MidshipBending Stresses of Dry Cargo<strong>Ship</strong>s,’, SSC-196, June 1969.L5.Fain, R. A. and Booth, E, T. ,“Results of the First Five ‘DataYears ‘ of Extreme Stress ScratchGauge Data Collected Aboard Sea-Land’s SL-7’ S,” SSC-2g6, March1979,E.Aw, A. H-s and Munse, w. H.“Practical Reliability Basis forStructural Fatigue, ‘,PreprintNo. 2494 presented at ASCENat ional Strnctural EngineeringConference, April 14-18, 1975,247