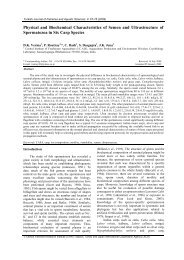
106 B.E. Emmanuel <strong>and</strong> I.C. Onyema / Turk. J. Fish. Aquat. Sci. 7: 105-113 (2007)Figure 1. Map <strong>of</strong> the Abule-Agege creek show<strong>in</strong>g sampl<strong>in</strong>g sites.Uca tangeri, Seserma huzardi, Gryphea gasar,Tympanotonus fuscatus var radula <strong>and</strong> herons thatfeed on exposed <strong>in</strong>vertebrates at low tide.Collection <strong>of</strong> Water <strong>and</strong> <strong>Plankton</strong> SamplesWater samples for physico-chemical analyses<strong>and</strong> plankton analysis were collected monthlybetween 10h <strong>and</strong> 13h for twelve consecutive months(March 2003 – February 2004). Surface watersamples were collected us<strong>in</strong>g a 2.0L non – metallicwater sampler just below the water surface. Watersamples were collected <strong>in</strong> well labeled 200ml glassbottles with screw caps <strong>and</strong> analyzed on gett<strong>in</strong>g to thelaboratory on the same day. <strong>Plankton</strong> samples werecollected us<strong>in</strong>g a 55 µm mesh size st<strong>and</strong>ard planktonnet by filter<strong>in</strong>g 50 liters <strong>of</strong> water from the creek at allthe sampl<strong>in</strong>g stations. <strong>Plankton</strong> samples were thentransferred <strong>in</strong>to properly labeled 250 ml glass bottleswith screw caps <strong>and</strong> preserved <strong>in</strong> 4% unbufferedformal<strong>in</strong>.Collection <strong>of</strong> Fish SamplesFor fish sampl<strong>in</strong>g purposes, the creek wasdivided <strong>in</strong>to three areas, the upper, middle <strong>and</strong> lowercourses. Fish<strong>in</strong>g was done by means <strong>of</strong> castnetdesigned <strong>and</strong> constructed with polyamide material(0.24mm diameter) with hang<strong>in</strong>g ratio <strong>of</strong> 1:2, threepanel <strong>and</strong> 31mm mesh size. <strong>The</strong> fish<strong>in</strong>g was alsocomplimented with a funnel entrance traps placed <strong>in</strong>different locations <strong>in</strong> the creek.Fish hauls were done fortnightly at low <strong>and</strong> hightide for the castnet. <strong>The</strong> fish samples were transportedto the laboratory for preservation <strong>in</strong> a deep freezerimmediately after appropriate label<strong>in</strong>g <strong>and</strong>identifications were made with the aid <strong>of</strong> relevanttexts (Tobor <strong>and</strong> Ajayi, 1979; Fischer et al., 1981;Powell, 1982; Schneider, 1990; Holden <strong>and</strong> Reed,1991). <strong>The</strong> measurement (<strong>in</strong> centimeter) <strong>of</strong> the fish(st<strong>and</strong>ard <strong>and</strong> total length), the shrimp (carapacelength) <strong>and</strong> the crab (carapace length <strong>and</strong> carapacewidth) species was taken us<strong>in</strong>g the method describedby Adetayo <strong>and</strong> Kusemiju (1994), Ch<strong>in</strong>dal et al.
B.E. Emmanuel <strong>and</strong> I.C. Onyema / Turk. J. Fish. Aquat. Sci. 7: 105-113 (2007) 107(2000) <strong>and</strong> Emmanuel <strong>and</strong> Kusemiju (2005). <strong>The</strong>specimens were also weighed on a sartorius weigh<strong>in</strong>gbalance to the nearest gram.Physical <strong>and</strong> Chemical AnalysisSurface water <strong>and</strong> air temperatures weremeasured us<strong>in</strong>g a mercury thermometer. <strong>The</strong> surfacewater sal<strong>in</strong>ity was measured us<strong>in</strong>g sal<strong>in</strong>ity bridgemeter (Model EES 13-135). Whereas pH wasdeterm<strong>in</strong>ed with a Griff<strong>in</strong> pH meter (model 80),dissolved oxygen was estimated us<strong>in</strong>g a Griff<strong>in</strong>oxygen meter (Model 40) <strong>and</strong> biological oxygendem<strong>and</strong> was measured us<strong>in</strong>g methods accord<strong>in</strong>g toAPHA (1998) for water analysis. Calorimetricmethods us<strong>in</strong>g a lovibond Nesslerier were adopted forthe determ<strong>in</strong>ation <strong>of</strong> phosphate-phosphorus <strong>and</strong>nitrate-nitrogen values. Data on ra<strong>in</strong>fall distributivepattern for the period was obta<strong>in</strong>ed from the FederalMeteorological Department Oshodi, Lagos.<strong>Plankton</strong> AnalysisIn the laboratory, three drops <strong>of</strong> each samplewere <strong>in</strong>vestigated at different magnifications (100X,400X) us<strong>in</strong>g a Wild M11 b<strong>in</strong>ocular microscope with acalibrated eyepiece after concentration to 10 mls. <strong>The</strong>microtransect drop count method described by Lackey(1938) was used. <strong>The</strong> f<strong>in</strong>al data were presented asnumber <strong>of</strong> organisms (cells, filaments, colonies, <strong>and</strong>organism) per ml.Appropriate texts were used to aid identification(Hendey, 1958, 1964; Wimpenny, 1966; Patrick <strong>and</strong>Reimer, 1966; 1975; Nwankwo, 1990, 2004; Bettrons<strong>and</strong> Castrejon, 1999; Newell <strong>and</strong> Newell, 1966;Olaniyan, 1975; Barnes et al., 1993; Waife <strong>and</strong> Frid,2001).ResultsPhysico-chemical CharacteristicsResults on the regime <strong>of</strong> physico-chemicalcharacteristics at the study site are shown <strong>in</strong> Table 1.pH throughout the study was alkal<strong>in</strong>e (7.4-8.2). Watertemperature ranged from 23.5ºC <strong>in</strong> July to 30.8ºC <strong>in</strong>February while air temperature ranged from 23.5-32.9ºC. Also dissolved oxygen levels ranged between3.4 mg/l <strong>in</strong> January to 4.5 <strong>in</strong> May.Nitrate content was higher dur<strong>in</strong>g the ra<strong>in</strong>s than<strong>in</strong> the dry season <strong>and</strong> <strong>in</strong> all ranged between 2.3 <strong>and</strong>5.88 mg/l. Phosphate levels showed no clear monthlyvariation (3.0-3.5 mg/l). Biological oxygen dem<strong>and</strong>recorded higher values dur<strong>in</strong>g the ra<strong>in</strong>s than <strong>in</strong> the dryseason.Furthermore, ra<strong>in</strong>fall volumes were higher <strong>in</strong> thera<strong>in</strong>y season than the dry season. Sal<strong>in</strong>ity levels werehigher between the months <strong>of</strong> February <strong>and</strong> April(25.5-33.65‰) <strong>and</strong> lowest between May <strong>and</strong>September (1.65-11.0‰).PhytoplanktonPhytoplankton species diversity was higher <strong>in</strong>the dry season (November – March) than <strong>in</strong> the wetseason (April – October). Nonetheless, abundancewas higher dur<strong>in</strong>g the ra<strong>in</strong>s with correspond<strong>in</strong>greduced diversity. Three major classes <strong>of</strong> planktonicalgae were observed <strong>in</strong> the creek dur<strong>in</strong>g the survey:Bacillarophyceae (diatoms), Cyanophyceae (bluegreenalgae) <strong>and</strong> Chlorophyceae (green algae). A total<strong>of</strong> 82 phytoplankton species belong<strong>in</strong>g to 27 generawere observed. Diatoms (69 species from 18 genera),Cyanobacteria (10 species from 6 genera) <strong>and</strong> greenalgae (3 species from 3 genera) were recorded (Table2).<strong>The</strong> species diversity was higher among thediatoms than for other classes. Among the diatoms,Melosira, Cosc<strong>in</strong>odiscus, Thalassiosira, Podosira <strong>and</strong>Cyclotella were the more frequent forms. Pennatediatoms were represented by more species fromNavicula, Nitzschia, Synedra, Pleurosigma <strong>and</strong>Cocconeis species. Melosira granulata, M. granulatavar. angustissima <strong>and</strong> Cosc<strong>in</strong>odiscus species were keycentric diatoms recorded dur<strong>in</strong>g the survey.Among the blue-green algae, Microsytisaureg<strong>in</strong>osa, M. flos-aquae, Merismopedia <strong>and</strong>Oscillatoria species represented the group. M.Table 1. Monthly variation <strong>in</strong> physico-chemical parameters <strong>in</strong> a tropical creek, Lagos (Mar. 2003 – Feb. 2004)2003 → 2004 →Parameter Mar Apr May Jun Jul Aug Sept Oct Nov Dec Jan FebAir temperature (ºC) 32.0 30.7 32.9 28.6 23.5 27 26.5 29.5 29.5 29.8 28.6 30.8Water temperature (ºC) 28.6 28.7 27.8 26.1 23.5 24.4 26.1 28.5 26.5 26.8 26.9 30.8Sal<strong>in</strong>ity (‰) 22.14 20.56 11.0 8.5 5.3 1.65 2.50 13.5 3.74 13.9 22.14 25.34pH 7.8 7.6 8.2 7.6 8.0 8.2 7.5 7.4 7.8 7.6 7.4 7.7Nitrate-nitrogen (mg/l) 5.88 5.44 5.02 4.52 4.50 4.78 4.01 3.78 2.30 4.85 6.23 6.42Phosphate-phosphorus 0.94 0.87 0.85 0.57 0.50 0.55 0.51 0.42 0.03 0.64 1.09 1.18(mg/l)Dissolved Oxygen (mg/l) 4.0 4.4 4.5 3.5 4.0 4.0 3.5 3.5 4.4 3.6 3.4 3.5Biological Oxygen Dem<strong>and</strong>(mg/l)31 27 60 35 40 40 20 25 14 19 26 24Ra<strong>in</strong>fall (mm) 23.0 200.0 208.6 383.0 101.7 34.0 230.5 115.0 50.0 0.0 22.0 35.0