Heuristic Automation for Decluttering Tactical Displays
Heuristic Automation for Decluttering Tactical Displays
Heuristic Automation for Decluttering Tactical Displays

Create successful ePaper yourself
Turn your PDF publications into a flip-book with our unique Google optimized e-Paper software.
Human Factors: The Journalof the Human Factors andErgonomics Societyhttp://hfs.sagepub.com/<strong>Heuristic</strong> <strong>Automation</strong> <strong>for</strong> <strong>Decluttering</strong> <strong>Tactical</strong> <strong>Displays</strong>Mark St. John, Harvey S. Smallman, Daniel I. Manes, Bela A. Feher and Jeffrey G. MorrisonHuman Factors: The Journal of the Human Factors and Ergonomics Society 2005 47: 509DOI: 10.1518/001872005774860014The online version of this article can be found at:http://hfs.sagepub.com/content/47/3/509Published by:http://www.sagepublications.comOn behalf of:Human Factors and Ergonomics SocietyAdditional services and in<strong>for</strong>mation <strong>for</strong> Human Factors: The Journal of the Human Factors and ErgonomicsSociety can be found at:Email Alerts: http://hfs.sagepub.com/cgi/alertsSubscriptions: http://hfs.sagepub.com/subscriptionsReprints: http://www.sagepub.com/journalsReprints.navPermissions: http://www.sagepub.com/journalsPermissions.navCitations: http://hfs.sagepub.com/content/47/3/509.refs.html>> Version of Record - Jan 1, 2005What is This?Downloaded from hfs.sagepub.com by HFES General on June 15, 2012
<strong>Heuristic</strong> <strong>Automation</strong> <strong>for</strong> <strong>Decluttering</strong> <strong>Tactical</strong> <strong>Displays</strong>Mark St. John, Harvey S. Smallman, and Daniel I. Manes, Pacific Science & EngineeringGroup, San Diego, Cali<strong>for</strong>nia, and Bela A. Feher and Jeffrey G. Morrison, Space andNaval Warfare System Center, San Diego, Cali<strong>for</strong>nia<strong>Tactical</strong> displays can quickly become cluttered with large numbers of symbols thatcan compromise effective monitoring. Here, we studied how heuristic automationcan aid users by intelligently “decluttering” the display. In a realistic simulatednaval air defense task, 27 experienced U.S. Navy users monitored a cluttered airspaceand executed defensive responses against significant threats. An algorithmcontinuously evaluated aircraft <strong>for</strong> their levels of threat and decluttered the lessthreatening ones by dimming their symbols. Users appropriately distrusted andspot-checked the automation’s assessments, and decluttering had very little effecton which aircraft were judged as significantly threatening. Nonetheless, declutteringimproved the timeliness of responses to threatening aircraft by 25% as comparedwith a baseline display with no decluttering; it was especially beneficial <strong>for</strong>threats in more peripheral locations, and 25 of 27 participants preferred decluttering.<strong>Heuristic</strong> automation, when properly designed to guide users’ attention by declutteringless important objects, may prove valuable in many cluttered monitoringsituations, including air traffic management, crisis team management, and tacticalsituation awareness in general.INTRODUCTIONClutter can become a serious problem <strong>for</strong>users monitoring situation displays. For example,in naval air defense, users must monitorairspaces to find threatening aircraft. These airspacesare frequently in busy environments nearland and contain multiple commercial air lanesand other air traffic. Clutter increases searchtimes by increasing the number of objects thatmust be sifted through or searched to find objectsof interest (e.g., Treisman & Gelade, 1980).Clutter also increases the chance <strong>for</strong> “changeblindness,” the chronic human inability to detectchanges occurring in a scene when attention isfocused elsewhere (Rensink, 2002). These problemscan result in reduced situation awarenessand delayed response times to critical events.A common method <strong>for</strong> reducing clutter andpromoting situation awareness is to identifyimportant objects and then mark or highlightthem in some manner. Highlighting, when theidentification process is reliable, allows users tofocus on a subset of objects and thereby effectivelyreduces the number of objects that mustbe sifted through or monitored. For example,in a search through a matrix of words, Fisher,Coury, Tengs, and Duffy (1989) found that highlightinga subset of words improved responsetime, even when the highlighting was less thancompletely reliable. In a visual search task <strong>for</strong>symbols on a tactical map display, Van Orden,DiVita, and Shim (1993) found that highlightinga category of symbols improved response time.In an augmented reality search task, Yeh andWickens (2001b) found that highlighting targetsimproved response time. However, one downsideof highlighting is that because it is such aneffective <strong>for</strong>m of cuing, it can impede the detectionof important objects that are mistakenlyleft unhighlighted (and hence uncued) when theautomation is imperfect or the situation is uncertain(e.g., Baddeley, 1972; Posner, 1980; Yeh &Wickens, 2001b).Address correspondence to Mark St. John, Pacific Science & Engineering Group, 9180 Brown Deer Rd., San Diego, CA92121; stjohn@pacific-science.com. HUMAN FACTORS, Vol. 47, No. 3, Fall 2005, pp. 509–525. Copyright © 2005,Human Factors and Ergonomics Society. All rights reserved.Downloaded from hfs.sagepub.com by HFES General on June 15, 2012
510 Fall 2005 – Human FactorsA related method <strong>for</strong> reducing clutter is toidentify less important objects and then declutterthem from the display by making them less visuallysalient in some manner. This method alsoreduces the effective search space by eliminatingsome objects from the search set. In severalstudies of visual search <strong>for</strong> targets in tacticalmap displays, researchers have shown that usersappreciate and benefit from the decluttering ofirrelevant categories of symbols (Johnson, Liao,& Granada, 2002; Nugent, 1996; Osga & Keating,1994; Schultz, Nichols, & Curran, 1985; Yeh& Wickens, 2001a).A number of methods have been used to declutterobjects by reducing their visual salience,including size reduction, dimming, turning symbolsinto dots, and even complete removal.Ideally, a good declutter method should visuallysegregate important from less important objectsbut with minimal disruption to the in<strong>for</strong>mationcontent of the symbols. For example, in a visualsearch task <strong>for</strong> target symbols on a cluttereddisplay, St. John, Feher, and Morrison (2002)found that simply dimming irrelevant symbolsto one third of their initial luminance (therebyreducing their contrast against a dark background)supported easy segregation but withoutremoving any identifying in<strong>for</strong>mation.An often overlooked issue, which we addresshere, is how the highlighted or decluttered objectsare identified in the first place. In most experimentalstudies, the identification functionis simply assumed to exist, but it is left unspecified.In applied tactical domains such as airdefense, the identification functions are typicallysimple classification rules, such as all friendlyaircraft or all aircraft with altitudes over 25,000feet (standard U.S. Navy practice). Although attractivebecause of their simplicity, these rulesoften fail to meet the needs of sophisticatedusers because they do not align with the categoriesof most interest to these users.A more sophisticated approach is to definemeaningful categories of objects and then usethese categories as the basis <strong>for</strong> decluttering.For example, in air defense, rules can be definedto identify commercial versus military aircraft,and then the commercial aircraft can be decluttered.Of course, such rules are necessarilyheuristic and are bound to miscategorize aircrafton occasion. Moreover, the identificationfunction of most interest to tactical users is notthe type of aircraft, per se, but its level of threatto own ship or other assets. Navy users monitortactical situations in order to assess threats andthen execute responses in order to minimizethem. Threat, however, is an ill-defined and complexfunction of many aircraft attributes andrequires years of experience to train (Kaempf,Wolf, & Miller, 1993; Liebhaber, Kobus, & Feher,2002; Marshall, Christensen, & McAllister, 1996;Morrison, Kelly, & Hutchins, 1996).Development of reliable automated threatassessment algorithms has long been a goal <strong>for</strong>aiding situation awareness generally, and airdefense in particular. Un<strong>for</strong>tunately there areseveral challenges to producing reliable threatevaluation automation. First, the problem cangrow extremely complex in attempting to account<strong>for</strong> all possible variables, including aircraftkinematics, coordinated aircraft behaviors(the big picture), intelligence in<strong>for</strong>mation, andsituational factors such as the geopolitical context.Second, the problem can suffer from ambiguitybecause important data may be unknownor unknowable. For example, aircraft identity isoften based on electronic emissions that may notbe detectable or that may have multiple interpretations;ultimately, the intent of an aircraft cannever be established with certainty.Third, expert decision makers frequently disagreeabout the threat of individual aircraft. Forexample, Marshall et al. (1996) found that all sixof the teams they studied agreed on the interestlevel of only 41% of the aircraft. Consequently,an automated algorithm can never perfectlymatch the threat ratings of every user. Fourth,well-known problems of automation trust, complacency,and confirmation bias (e.g., Parasuraman& Riley, 1997) can undermine the effectiveuse of automation and lead to disastrous consequences.On one hand, <strong>for</strong> example, a user mightmonitor only those aircraft indicated as threatsby the automation, or if the automation missed athreat, the user might be significantly delayed innoticing it. If the automation mistakenly overratedthe threat of an aircraft, a user might treatit more aggressively than necessary. On the otherhand, distrust of automation might actually increaseworkload by driving users to increase theirmonitoring of lower threat aircraft.Our approach is to treat the automation andDownloaded from hfs.sagepub.com by HFES General on June 15, 2012
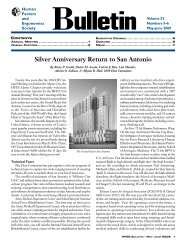
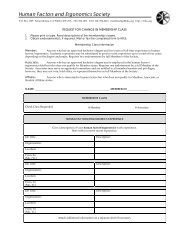
HEURISTIC AUTOMATION FOR DECLUTTERING 511the user as a “mixed initiative” system that combines“heuristic automation” that is known tobe imperfect with engaged, knowledgeable userswho use the automation as a guide but ultimatelyrely on their own best judgment. Accordingto this design strategy (e.g., Parasuraman &Riley, 1997, pp. 244, 249; St. John & Manes,2002; St. John, Oonk, & Osga, 2000), users aretaught how and where the automation is likelyto be trustworthy or make errors, and they verifythe automation accordingly. This design strategyfits well with what are termed “low levelsof automation” (e.g., Kaber & Endsley, 2004;Parasuraman, Sheridan, & Wickens, 2000),which might involve merely identifying alternativesolutions rather than recommending a singlebest solution or executing a solution unless countermandedby the user. For example, in a visualsearch task, St. John and Manes (2002) usedheuristic automation in the <strong>for</strong>m of an imperfecttarget detection tool to make a rough first cut atidentifying the likely locations of hidden targets.Users then exploited this in<strong>for</strong>mation to guidetheir own searches. This approach led to a 23%improvement in search times, even when the automationwas only 70% reliable. In a dual-taskparadigm, Sorkin, Kantowitz, and Kantowitz(1988) used a “likelihood alarm display” to indicatethe likelihood of a signal occurring in thesecondary task. Users exploited the likelihoodin<strong>for</strong>mation to decide how carefully to attend tothe secondary task. In both studies, knowledgeableusers exploited the in<strong>for</strong>mation provided byimperfect, heuristic automation to guide theirattention.We applied this heuristic automation designstrategy to air defense. First, a heuristic threatassessment algorithm evaluated all aircraft everysecond as they moved about the display byweighing several aircraft attributes and computinga “threat score.” Then, lower scoring, lessthreatening aircraft were decluttered by reducingthe salience of their symbols on the display.In this way, the decluttered aircraft would notdistract from the higher threat aircraft, yet theywould remain available <strong>for</strong> inspection. We predictedthat users would be able to exploit the in<strong>for</strong>mationprovided by the automation to focusthe majority of their attention on the fully visiblethreatening aircraft while periodically scanningthe entire display to verify the automation’sassessments of the decluttered aircraft. Situationawareness would be enhanced and responsesspeeded because significant threats would beclearly visible. <strong>Decluttering</strong> might be especiallyuseful <strong>for</strong> facilitating the early detection of significantthreats at longer ranges from own ship.Time freed up from searching the cluttered displaycould be used to verify decluttered aircraftopportunistically on the chance that the heuristicalgorithm decluttered an aircraft in error. Thusthe potential costs of automation-induced misseswould be minimized.The current experiment tests these predictionsin a scenario-based, quasi-realistic air defensetask with experienced naval users. Our goal wasto assess whether heuristic automation in combinationwith decluttering could facilitate per<strong>for</strong>manceand garner user acceptance withinthe naturalistic constraints of a real task withexperienced users in realistic scenarios. Accordingly,participants per<strong>for</strong>med the normal tasksinvolved in air defense – namely, monitoring anairspace, evaluating aircraft, and responding tothe “significantly threatening” ones by issuingqueries and warnings. In the real world, the airdefense task involves a team of naval personnel.The experiment, however, was designed to beper<strong>for</strong>med by a single individual by removingmany of the subsidiary, technical tasks such ascorrelating raw radar data and operating radiocircuits. The scenarios were designed to be clutteredand reasonably challenging by providinga variety of aircraft types and levels of threat.Figure 1 shows a screenshot of the displayused in the experiment (the actual display wasin color). The tactical display showed a 170 ×120 nautical mile (315 × 222 km) area reminiscentof the Persian Gulf. Three relatively friendlycountries, labeled F1, F2, and F3, appearedon the left, and a relatively hostile country,labeled H1, appeared on the right. Commercialair lanes appeared as faded (violet) lines thatcrisscrossed the display. Own ship was representedby the (blue) circle near the center of thedisplay. Friendly aircraft appeared as (blue) bulletshapes. All unknown, potentially threateningaircraft, including commercial airliners, oil plat<strong>for</strong>mhelicopters, maritime patrols, and tacticalfighter aircraft appeared as (yellow) clover shapes(MIL-STD-2525B, Department of Defense,1999). Less threatening aircraft appeared dim,Downloaded from hfs.sagepub.com by HFES General on June 15, 2012
512 Fall 2005 – Human FactorsFigure 1. Screenshot of the task display (left). Close-up view of a fully visible aircraft (top right) and a declutteredaircraft (bottom right).and the significantly threatening aircraft stoodout as bright (yellow), amid the clutter.Because participants were required to respondonly to significantly threatening aircraft,a natural place to set the declutter threshold wasto declutter all but the significantly threateningaircraft (defined as aircraft scoring an 8 or higheron a 10-point scale of threat). However, giventhe heuristic nature of the automated threat algorithmand variation among expert assessments,it was likely that the algorithm would occasionallydeclutter an aircraft that one or moreparticipants might determine to constitute a significantthreat. Lowering the threshold to keepmore “borderline” threatening aircraft fully visiblemight reduce this problem, but at the cost ofleaving more aircraft fully visible and increasingclutter on the display. More clutter means thatusers must spend more time searching amongand evaluating a larger set of fully visible aircraft,only some of which are actually significantlythreatening, in their view.To investigate this trade-off empirically, wemanipulated the declutter threshold as an independentvariable in the study. In the highthresholddeclutter condition, only aircraft thatthe threat assessment algorithm evaluated tobe significantly threatening remained fully visible.In the medium-threshold declutter condition,all aircraft that the algorithm evaluated tobe either significantly threatening or borderlinethreatening remained fully visible (6 or higheron a 10-point scale). The declutter conditionswere compared against a no-declutter condition,in which all aircraft symbols were equally salient.METHODParticipantsThe participants were 27 U.S. Navy personnel(26 men and 1 woman). Ages ranged from24 to 54 years, with a mean of 35 years. Eightof the participants were chiefs or senior chiefs(E-7 to E-8) from the Aegis Training and ReadinessCenter Detachment, San Diego; 3 weresenior officers (O-5 to O-6) from the <strong>Tactical</strong>Training Group, Pacific; and 16 were junior officers(O-2 to O-4) from the Airborne Early WarningWing, Pacific. The participants had from 3to 30 years of service in the U.S. Navy, with anaverage of 13 years. Air defense expertise andexperience was rated on a 3-point scale <strong>for</strong> eachparticipant by an independent subject matterexpert. Fourteen of the participants were givena very high rating, 2 were given a high rating,and 11 were given a moderate rating.Task, Apparatus, and StimuliThe experiment was run on a laptop with a15-inch (38-cm) screen running at 1024 × 768pixel screen resolution and viewed by the participantfrom a com<strong>for</strong>table viewing distance.In all conditions, users could access a varietyof in<strong>for</strong>mation about an aircraft (hereafter calledDownloaded from hfs.sagepub.com by HFES General on June 15, 2012
HEURISTIC AUTOMATION FOR DECLUTTERING 513a track) by selecting a track with the mouse andthen viewing a set of track data that appearedin a window in the lower left corner of the display.The track data included a track number <strong>for</strong>identification; the plat<strong>for</strong>m or type of aircraft;the bearing and range of the track from ownship; the altitude, course, and speed of the track;its country of origin; and two types of electronic/radar in<strong>for</strong>mation: identification friend or foe(IFF) and electronic signal measures (ESM). Forthe purpose of realism, not all in<strong>for</strong>mation wasavailable <strong>for</strong> every track. For example, Track 7053in Figure 1 is emitting no identifying electronicor navigational radar in<strong>for</strong>mation; there<strong>for</strong>e itsIFF and ESM are unknown and, consequently,the plat<strong>for</strong>m is also unknown. Additionally, thetrack flew in from the east over water, so its countryof origin is unknown.There were three equivalent scenarios, eachlasting 15 min. During each scenario, tracksmoved slowly about the display at realistic physicalrates: from 95 to 560 nautical miles/hr(176–1037 km/hr), which is equivalent to 10 to55 pixels/min (0.006° to 0.035° of visual angle/s).There were approximately 50 tracks onthe display at all times, with tracks occasionallyentering or exiting the displayed area. Mosttracks appeared benign and nonthreatening,behaving like normal commercial airliners, oilplat<strong>for</strong>m helicopters, or other light commercialaircraft. At each moment, however, approximatelyseven tracks appeared significantly threatening(8 or higher on a 10-point scale) – <strong>for</strong> example,behaving like tactical fighter aircraft, moving athigh speed, from hostile origins, toward ownship. Approximately 12 additional tracks appearedpotentially threatening or “borderline”(6 or 7 on a 10-point scale of threat). Thesetracks presented a mix of benign and threateningattributes.As tracks moved about the display, their threatlevels changed. For example, as tracks approachedown ship, their threat levels rose, and then asthey passed, their threat levels dropped again.Occasionally, an aircraft would start out behavinglike a commercial airliner following an airlane and would then abruptly change course andhead inbound at high speed. Such actions wouldraise its threat score abruptly. Other tracks appearedsuddenly from islands or oil plat<strong>for</strong>ms.In general, the scenario was designed to presenta range of aircraft behaviors and keep the participantsengaged.There were three conditions: no declutter,medium-threshold declutter, and high-thresholddeclutter. Assignment of scenarios to conditionswas counterbalanced across participants. In theno-declutter condition, all track symbols appearedequally bright, and the user received noaid in evaluating the tracks <strong>for</strong> their levels ofthreat to own ship. In the two declutter conditions,less threatening tracks were decluttered.The threat assessments were accomplishedusing an algorithm based on research into hownavy experts evaluate threat (Liebhaber, 2001;Liebhaber et al., 2002; Marshall et al., 1996).Namely, the algorithm took as input 12 attributes(e.g., range, speed, origin, and whether atrack was on an air lane) that are known to impactthreat assessments. These attributes wereweighed according to their mean impact onthreat, as rated by a group of experts (Liebhaber,2001), and then summed to produce a raw threatscore. For example, a speed greater than 450nautical miles/hr (833 km/hr) raised the rawthreat score 1.8, whereas a speed of less than150 nautical miles/hr (278 km/hr) raised theraw threat score 0.2. This algorithm treatedeach attribute independently, meaning that thealgorithm did not take into account the implicationsof any high-order conjunctions of attributes.Hence the algorithm was relatively simpleand heuristic in nature. More detail on the algorithmis available in St. John, Manes, Smallman,Feher, and Morrison (2004). Finally, theraw scores were trans<strong>for</strong>med using the logisticfunction and rescaled between 1 and 10 to accentuatethe midrange of the threat scale, given thatfew tracks ever received extreme scores.<strong>Decluttering</strong> of the lower threat tracks wasthen accomplished by making their aircraft symbolssemitransparent (65% transparent) so thatthe much darker background color showedthrough. In effect, the semitransparency reducedthe luminance of the symbols to about one thirdof their initial values, similar to the approachused by St. John et al. (2002).During the task, participants monitored thetracks and responded to the significantly threateningones. Participants were instructed thatthe evaluation part of the task was their ownjudgment. They were also told that the threatDownloaded from hfs.sagepub.com by HFES General on June 15, 2012
514 Fall 2005 – Human Factorsalgorithm and declutter operation was only animperfect aid: “The algorithm is not designed tobe perfect – you are the final judge of threat andwhich tracks require actions. Instead, the algorithmis meant to provide a reasonable ‘first cut’at evaluating threat. You should act on eachtrack that you evaluate to be a significant threat.The algorithm is only there to help you focus onhigh threats.” These instructions both allowedand encouraged users to judge <strong>for</strong> themselveswhich tracks were significantly threatening.From postexperiment interviews, it was clearthat these experienced participants were quitewilling to believe the algorithm was fallible andto check its choices using their own judgment.Once a track was judged to be a significantthreat, however, the“rules of engagement”(ROE)determined how participants were required to respond.The ROE defined three concentric rangerings around own ship and two types of “significantevents” that required a response from participants:ring crossings and threat level increases.For ring crossings, participants were required to“notify alpha bravo” (i.e., click a button to notifya superior command element about a track) ifa significantly threatening track crossed the ringat 75 nautical miles (139 km) from own ship; to“query” the track (i.e., click a button to initiate aradio message to the track) if it crossed the ringat 50 nautical miles (93 km) from own ship; andto “warn” the track (i.e., click a button to initiatea radio warning to the track) if it crossed thering at 25 nautical miles (46 km) from own ship.Participants were required to per<strong>for</strong>m these responsesas quickly as possible. Only inbound ringcrossings (toward own ship) counted as significantevents. For threat level increases, if a previouslyless threatening track became a significantthreat by per<strong>for</strong>ming some threatening action,such as turning inbound and increasing speed,then participants were asked to respond immediatelywith the response appropriate <strong>for</strong> thatdistance from own ship. Responses were alwaysattributed to the most recent significant event.These rules provided a good method <strong>for</strong> handlinga common difficulty found in experimentson tasks that involve substantial expert userjudgment, such as air defense. This difficulty arisesfrom the variability among experts in their assessmentof threat and in the timing of theirresponses (e.g., Morrison et al., 1996). This variabilitycan make it difficult to measure per<strong>for</strong>mancebenefits. In the current experiment, theassessment variability problem was addressedby allowing participants to exercise their ownjudgment in identifying significantly threateningaircraft and then, in the analyses of responsetimeliness, including only those aircraft that individualparticipants determined to be significantlythreatening. The strict ROE <strong>for</strong> responding tosignificant threats, however, meant that any delayin responding could then be attributed to aloss of situation awareness rather than to userjudgment about the appropriate timing of a response.The complete lack of a response to a significantevent, however, can still be attributed to aloss of situation awareness – the event was notobserved – or to a participant’s judgment that theevent was not significant. Any difference in responserates attributable to decluttering, there<strong>for</strong>e,can be interpreted either as a change insituation awareness or a change in participants’threat assessments.Participants made responses by first selectingthe track, then clicking on the appropriate buttonunderneath the track data display (N <strong>for</strong>notify, Q <strong>for</strong> query, or W <strong>for</strong> warn). Two additionalresponses, “illuminate with fire-controlradar” (I) and “request to engage” (E), were alsoavailable to participants if they felt tracks representedan especially elevated level of threat. Unlikenotify, query, and warn, however, no specificROE were provided <strong>for</strong> when these two actionsshould be taken. These extra response optionswere included to provide added realism and tokeep users occupied and engaged with the mostthreatening tracks, as they would be in the realtask. They were not analyzed further becausethey were optional and subject to variable interpretation,unlike the concrete ROE.The threat assessment algorithm identified 24significant events during each scenario. It alsoidentified 29 “borderline events,” when a borderlinetrack crossed a ring or a track increasedits threat level to become a borderline track, and40 “low-threat events.” Of course, participantswere required to respond only to those eventsthat they personally judged to be significant. Additionally,at the beginning of each scenario, participantswere required to “come up to speed”on the situation by immediately responding toDownloaded from hfs.sagepub.com by HFES General on June 15, 2012
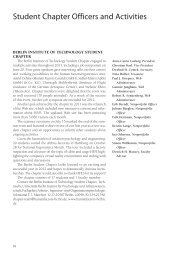
HEURISTIC AUTOMATION FOR DECLUTTERING 515each significantly threatening track currently onthe display with the response appropriate <strong>for</strong>that distance from own ship.ProcedureParticipants were given a basic description ofthe task and were then asked to sign in<strong>for</strong>medconsent <strong>for</strong>ms. Participants were then given adetailed orientation to the display, the task, theROE, and the tactical situation using a staticscreenshot of the basic, no-declutter condition.They were then briefly exposed to all three conditionsand told that the purpose of the experimentwas to see how the different displays mightinfluence their per<strong>for</strong>mance. Participants thenran through a practice scenario with assistancefrom the experimenter. The practice scenarioused the no-declutter condition and lasted 5 min.Each participant per<strong>for</strong>med in all three declutterconditions, one with each scenario, in acounterbalanced order. Twenty-four of the participantswere administered the NASA Task LoadIndex (TLX; Hart & Staveland, 1988; NationalAeronautics and Space Administration, n.d.) followingeach scenario in order to assess their subjectivelevels of workload.RESULTSBehavioral MeasuresWe first evaluated the benefits of decluttering<strong>for</strong> speeding responses to threats; then we evaluatedthe potential costs of decluttering <strong>for</strong> biasingusers’ threat assessments or causing potentialthreats to be missed.Response times were computed by taking thedifference between the time a response occurred(i.e., when the N, Q, or W button was clicked)and the time of the most recent ring crossing orthreat level change event. Mean response times,both overall and <strong>for</strong> each level of threat, werethen computed <strong>for</strong> each condition <strong>for</strong> each participant.First, it is interesting that the response timeswere as long as they were: The mean responsetime was 31 s. Monitoring <strong>for</strong> significant threatsand critical events must have required carefulevaluation and close observation of individualtracks, which sometimes delayed the detectionof other critical events. These long responsetimes underscore the need <strong>for</strong> any tool that canreduce this delay, albeit without incurring otherlarge costs.Our hypothesis was that decluttering the lowthreattracks would facilitate timely noticingand responding to the ring crossings and threatchanges of significantly threatening tracks. Totest this hypothesis, overall response times <strong>for</strong>each declutter condition were submitted to aone-way repeated measures analysis of variance(ANOVA). <strong>Decluttering</strong> significantly reducedresponse times, F(2, 52) = 3.5, p = .037 (seeFigure 2). Response times were 25% faster inthe high-threshold declutter condition than in theno-declutter condition (significant by Tukey-Kramer post hoc test). In a separate one-wayrepeated measures ANOVA of response times toonly the significantly threatening tracks, responsetimes were 28% faster in the high-threshold decluttercondition than in the no-declutter condition,F(2, 52) = 3.6, p = .035.Response times to only the borderline threattracks were not significantly different betweendeclutter conditions, F(2, 40) = 1.2, p = .31. Notethat the reduced degrees of freedom in this analysiswas attributable to the fact that 6 participantsresponded to no borderline threatening tracksin one or more declutter conditions. Responsetimes to low-threat tracks could not be analyzedbecause so few participants ever responded tothese tracks. The infrequency of responses toborderline and low-threat tracks limited theirimpact on the overall results. Overall, declutteringsubstantially improved the timeliness of mostresponses. It is important to note that the orderof presentation of conditions did not affect theresults: An analysis of the first condition presentedto each participant showed the same patternof results.To investigate the effect of decluttering moreclosely, we split the response times based on thetype of significant event that prompted them:ring crossings or threat level increases. Theoverall response times <strong>for</strong> each declutter conditionand significant event type were submittedto a two-way repeated measures ANOVA. Asexpected, there was a significant main effect ofdeclutter condition, F(2, 52) = 4.6, p = .015.The high-threshold declutter condition was significantlyfaster than the no-declutter condition(by Tukey-Kramer post hoc test). There was alsoDownloaded from hfs.sagepub.com by HFES General on June 15, 2012
516 Fall 2005 – Human FactorsFigure 2. Effect of decluttering on response times, overall and broken down by level of threat.a main effect of event type, F(1, 26) = 57.6, p
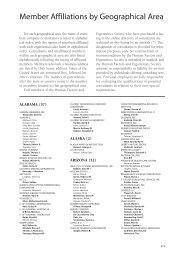
HEURISTIC AUTOMATION FOR DECLUTTERING 517Figure 3. Effects of decluttering on response times, broken down by type of response (and distance from ownship). The semicircles indicate the response rings (warn, query, and notify).which tracks elicited notify, query, and warn responsesfrom participants? To answer thesequestions, we first asked how well participantsagreed with the heuristic threat assessment algorithm.Participants responded an average of21.4 times during each scenario (recall, <strong>for</strong> comparison,that the threat assessment algorithmidentified 24 significant events during each scenario).On average, 80% (17.2/21.4) of participants’responses were made to tracks that thethreat assessment algorithm identified as significantthreats, and 16% (3.5/21.4) of their responseswere made to tracks that the threat assessmentalgorithm identified as borderline threats. Only3% (0.7/21.4) of participants’ responses weremade to low-threat tracks, and 81% of the participantsresponded to none of the low-threattracks. These results indicate that the threat assessmentalgorithm and the participants closelyaligned with one another in evaluating threat atthis basic yet critical level of categorization. Theheuristic automation was by no means perfect,however, and no participant responded to everyautomation-identified significant event.An inspection of a sample of participants’responses revealed that different participantsomitted responses to different tracks. One salientpattern, however, was that participantstended to omit responses to tracks that were followingknown commercial air lanes, even thoughthe algorithm identified them as significantthreats. The algorithm apparently underweightedthe reduction in threat that participants attributedto this attribute. This finding was laterconfirmed in user interviews.Second, did decluttering change the responserate? The numbers of responses <strong>for</strong> each decluttercondition and level of threat were submittedto a two-way repeated measures ANOVA.Significant threats were responded to morefrequently than were borderline or low threats,F(2, 52) = 268, p
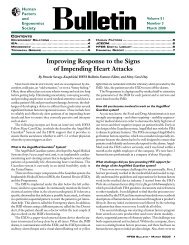
518 Fall 2005 – Human FactorsTABLE 1: Number of ResponsesThreat LevelCondition Overall Low Borderline SignificantNo declutter 21.3 1.0 3.5 16.8Medium declutter 22.1 0.6 4.4 17.1High declutter 21.0 0.7 2.7 17.6were no differences in the number of responsesto low-threat tracks, F(2, 52) = 1.1, p = .33, orto significantly threatening tracks, F(2, 52) =1.2, p = .30, but the number of responses toborderline threats was affected by decluttering,F(2, 52) = 5.3, p = .008. Namely, there weremore responses to borderline events when themedium-threshold declutter condition made borderlinetracks fully visible than when the highthresholddeclutter condition made these tracksdecluttered (p < .05 by Tukey-Kramer post hoctest). The difference in responding, however,was very small in absolute terms: 4.4 responsesin the medium-threshold declutter condition versus2.7 responses in the high-threshold decluttercondition.One explanation <strong>for</strong> this difference is that declutteringled to a subtle bias in threat assessments.Namely, making borderline tracks fullyvisible (medium-threshold declutter) led usersto judge these tracks as slightly more threatening,and there<strong>for</strong>e slightly more of these tracksreceived responses. Conversely, making borderlinetracks decluttered (high-threshold declutter)led users to judge these tracks as slightlyless threatening, and there<strong>for</strong>e slightly fewer ofthese tracks received responses. According tothis explanation, the declutter manipulation ledto a slight cost in terms of biased threat assessments,the very occasional underestimation ofa threatening track, and a missed response to asignificant event made by that track.Fortunately, because of the nature of the task,these biases are less likely to affect decisionmaking close to own ship, given that threat becomesmore clear cut as tracks move closer. Forthe closest (warn) range ring, the number ofresponses to borderline threats dropped from3.5 overall to 0.5, and the difference betweenconditions was not significant (F < 1).A second explanation, which is not mutuallyexclusive from the first, is that decluttering ledto a small number of missed observations of significantevents. If the threat assessment algorithmoccasionally misevaluated a significantthreat and decluttered it inappropriately, thenthis mistakenly decluttered significant threatmight go unobserved, or missed, as it crossed arange ring, thereby lowering the response rateto borderline tracks. According to this explanation,the declutter manipulation led to a slightcost in terms of mistaken decluttering of significantthreats that then went unobserved. As withthe first explanation, this chain of events is morelikely to occur in the periphery of the display.Tracks close to own ship are closely observed,as indicated by the fast response times to warnring crossings (Figure 3). Ultimately, these smallcosts must be weighed against the per<strong>for</strong>mancebenefits described earlier.Did the declutter operation change the processof monitoring the display and maintainingsituation awareness? Situation awareness wasestimated by tabulating which tracks participantshooked (selected) in order to view and evaluatetheir detailed attribute values. The assumptionwas that participants would tend to repeatedlyhook tracks that were threatening or otherwiseworth a close examination. There<strong>for</strong>e, elevatedlevels of hooking high-threat tracks should correspondwith better situation awareness. Thenumbers of hooks <strong>for</strong> each declutter conditionand level of threat were submitted to a two-wayrepeated measures ANOVA. Confirming theassumption, across all three conditions, participantsprimarily hooked the significantly threateningtracks, F(2, 52) = 145.5, p < .0001 (seeFigure 4).The overall amount of hooking, however, wasnot affected by decluttering, F(2, 52) = 0.5. Thisfinding is important because it indicates thatdecluttering did not reduce participants’ attentionto and close monitoring of the situation,nor did it create extra work <strong>for</strong> participants byDownloaded from hfs.sagepub.com by HFES General on June 15, 2012
HEURISTIC AUTOMATION FOR DECLUTTERING 519Figure 4. Effect of decluttering on the number of hooks, overall and broken down by level of threat.influencing them to increase their hooking.Rather, when participants were in the declutterconditions, they continued to hook and evaluatetracks at the same rate as they did when theywere in the no-declutter baseline condition.<strong>Decluttering</strong> did influence which tracks werehooked, as indicated by a significant interactionbetween declutter condition and threatlevel, F(4, 104) = 13.9, p < .0001. To examinethis interaction, we looked separately at eachlevel of threat in one-way repeated measuresANOVAs. For significantly threatening tracks,high-threshold declutter increased the amountof hooking, F(2, 52) = 9.4, p = .0003. Thisfinding indicates that participants watched andevaluated the significantly threatening tracksmore closely when the declutter operation keptthese tracks fully visible and decluttered therest. Interestingly, this increase did not occurin the medium-threshold declutter condition,even though the medium condition also keptthese tracks fully visible. Instead, the mediumthresholddeclutter condition increased the numberof borderline threats that were hooked, F(2,52) = 19.7, p < .0001. In other words, makingonly the significantly threatening tracks fullyvisible (high-threshold declutter) increased participants’situation awareness of the high-threattracks. Making both the significant and borderlinethreat tracks fully visible (medium-thresholddeclutter) increased participants’situation awarenessof only the borderline threat tracks.Perhaps participants hooked these borderlinetracks more frequently than otherwise in orderto understand why they had been made fully visible.In terms of costs, increased situation awarenessof borderline threats might facilitate findingthe occasional mistakenly decluttered threateningtrack but at the price of reducing surveillanceof tracks that clearly are threatening.Finally, even though the response time benefitsof decluttering were similar <strong>for</strong> both experiencelevels, experience level did lead to severalgeneral differences in response rates and hookingrates. The overall numbers of responses ineach declutter condition and experience levelwere submitted to a three-way mixed effectsANOVA of experience level, threat level, and decluttercondition. Moderately experienced participantsresponded more (24 times) than did veryhighly experienced participants (19 times), F(1,23) = 8.5, p = .008. Moderately experiencedDownloaded from hfs.sagepub.com by HFES General on June 15, 2012
520 Fall 2005 – Human Factorsparticipants responded to 1.4 more significantlythreatening tracks, 2.1 more borderline threateningtracks, and 1.7 more low-threat tracks.In separate two-way ANOVAs at each level ofthreat, only the difference <strong>for</strong> borderline threatswas significant, F(1, 23) = 4.4, p = .048. In asimilar analysis of hooking rates, moderatelyexperienced participants also hooked more borderlinethreat tracks, F(1, 23) = 4.2, p = .05, andmore low-threat tracks, F(1, 23) = 5.8, p = .024,than did the very highly experienced participants.These increases were similar <strong>for</strong> all threedeclutter conditions.The most likely explanation <strong>for</strong> these resultsis that the moderately experienced participantsplayed the task more conservatively by judgingmore tracks to warrant responses. In the highthresholddeclutter condition, this higher rate ofresponding meant that moderately experiencedparticipants were actually more likely than thevery highly experienced participants to disregardthe automation’s threat assessments, given thatthey responded to several decluttered borderlinethreat tracks. Contrary to conventional wisdom(including the conventional wisdom of the participantsthemselves), the less experienced participantsdid not doggedly follow the automation.If one assumes that experience leads to greaterself-confidence at the task, then the very highlyexperienced participants should have been moreconfident and there<strong>for</strong>e more skeptical and lesstrusting of the automation (Lee & Moray, 1994).Instead, the moderately experienced participantsappeared to be more skeptical of the automationthan were the very highly experienced participants.However, it seems likely that this conservatismis more a reflection of these participants’stance toward the task than of their stance towardthe automation per se. It is also possiblethat the very highly experienced participantsfelt so confident of their abilities that they weremore willing to follow the automation’s recommendations,knowing they could change theirminds if they chose. In general, the effects oftrust in automation are extremely complex andmultivariate (see Lee & See, 2004; Parasuraman& Riley, 1997). Moreover, it seems likely thatattitudes toward mixed-initiative systems andlower level automation may be quite differentfrom attitudes toward higher levels of automationthat “take over” a task. The most importantpoint, however, is that decluttering led to similarresponse time benefits <strong>for</strong> both groups.Subjective MeasuresImmediately following each scenario, 24 ofthe participants rated their subjective workloadusing the NASA-TLX (Hart & Staveland, 1988;NASA, n.d.). The overall indices <strong>for</strong> each decluttercondition were submitted to a one-way repeatedmeasures ANOVA. The effect of declutterwas not significant, F(2, 46) = 1.1, p = .35. Wethen examined only the workload subscale thatparticipants judged to be most relevant to thetask: mental demand. In a similar analysis ofmental demand only, the effect of declutter wassignificant, F(2, 46) = 6.1, p = .004. The subjectivemental demand in the no-declutter conditionwas given an average rating of 49 out of 100,whereas both the medium- and high-declutterconditions were given average ratings of 40 outof 100. In terms of mental demand, then, declutteringreduced subjective workload ratings byan average of 18%. In a two-way mixed effectANOVA of experience level by declutter condition,there was no effect of experience level onmental demand (F < 1), although mental demandwas numerically lower <strong>for</strong> very highly experiencedparticipants.In interviews following the experiment, participantsreiterated that decluttering reducedtheir workload, relieved the pressure to act anddecide quickly, allowed time to concentrate onsuspects, and aided situation awareness. Commentsincluded “I actually had more time tospend scanning the display because I could seewhere the high threats were” and “With declutteringI had more time to loiter on a track of interestand put the puzzle pieces together.”When asked which condition they preferred,highly and very highly experienced participantssplit their preferences between the high-thresholddeclutter and the medium-threshold declutter interfaces.Moderately experienced participantsoverwhelmingly preferred the medium-thresholddeclutter interface. Only 2 of the 27 participantspreferred the no-declutter condition. A commonopinion was that “medium-threshold declutterhelped narrow down the tracks that were bettercandidates to recheck” whereas the “high thresholdleft me more suspicious of the declutteredDownloaded from hfs.sagepub.com by HFES General on June 15, 2012
HEURISTIC AUTOMATION FOR DECLUTTERING 521tracks, [causing] greater workload.” This moreconservative stance matches the behavioral dataon the number of responses and the number ofhooks, but it contrasts with the data on responsetimes. Participants at all experience levels benefitedsimilarly and solely from the high-thresholddeclutter interface. The medium-declutter interfacemay have felt “safer,” but it was the highdeclutterinterface that improved response times.The similar effects of decluttering on responsetime and mental workload <strong>for</strong> both the highlyand moderately experienced participants mightappear to run counter to the classic findings ofthe expertise literature. One might have expectedthe moderately experienced participants tobenefit more than the highly experienced participants.However, the effect of decluttering mostlikely influences fairly low-level visual searchprocesses <strong>for</strong> quickly finding and refinding tracksof interest, and visual search processes are notlikely to be strongly influenced by air defense experience.Similarly, Hollands and Merikle (1987)found that psychology experts were no fasterthan novices in searching an alphabetically organizedmenu system of psychology terms, althoughexperts were faster to search a semantically organizedsystem. To the extent that our scenarioscontained ad hoc clutter, there was little structure<strong>for</strong> the experts to utilize.DISCUSSION<strong>Decluttering</strong> a naval air defense display usinga heuristic threat assessment algorithm wassuccessful in a number of ways. First, 25 out ofthe 27 experienced U.S. Navy users preferredone or the other of the two declutter interfacesover the baseline no-declutter interface. Second,participants rated the mental demands of the taskas lower when using the declutter interfaces.Third, the high-threshold declutter interfacesignificantly improved response times to threateningtracks by 25%. Fourth, decluttering increasedsituation awareness of significant threats. Participantsspent significantly more time monitoringand evaluating the tracks that the threat assessmentalgorithm identified as significantly threatening,as measured by which tracks were hookedduring the scenarios.The benefit of high-threshold decluttering was9soverall and more than 16 s <strong>for</strong> the middle andouter range rings. These are very substantialdifferences, in terms of both absolute time andpercentage increase. Although it is true that evena fast-flying aircraft will not travel more than afew miles within that time, it gives users a substantialperiod during which they can weighdecisions or evaluate additional aircraft. In oneparticipant’s words, “<strong>Decluttering</strong> allowed meto get out in front of my [rules of engagement],rather than behind, where mistakes are made.”These benefits must be weighed against theevident cost of decluttering, given that highthresholddecluttering slightly, but significantly,reduced the number of responses to borderlinethreat tracks as compared with medium-thresholddecluttering. This difference may have been attributableto decluttering either slightly biasingusers’ threat assessments of these tracks, leadingto the occasional missed response, or to the occasionalinappropriate decluttering of a significantthreat, leading to an increased chance of asignificant event going unnoticed. Because of thenature of the task, these costs are much morelikely to occur in the periphery of the display.In our view, the large benefits in responding tosure threats outweigh the small costs in missedperipheral responses to unclear threats.In important respects, the threat assessmentalgorithm per<strong>for</strong>med quite well, even though itused relatively simple heuristics to assess threat.Rather than attempting to strictly rank ordertracks from most threatening to least threatening,it merely attempted to categorize tracks ashigh threat (fully visible) or low threat (decluttered).At this less ambitious task, the algorithmwas reasonably successful in that it reasonablyclosely matched the judgments of participants.In the no-declutter condition, in which the algorithmrated tracks but did not influence the display,5% of participants’ responses, on average,were to low-threat tracks, 17% were to borderlinethreat tracks, and fully 79% were to significantlythreatening tracks. Most important, thisgood, but imperfect, categorization per<strong>for</strong>manceby the threat assessment algorithm enabled thetask per<strong>for</strong>mance benefits we have described.These benefits, we believe, derive from the wayin which the automation was designed into theinterface and used by the participants – namely,it suggested where users should focus their attentionbut still allowed them to scan the entire situationand respond as they saw fit.Downloaded from hfs.sagepub.com by HFES General on June 15, 2012
522 Fall 2005 – Human FactorsThe response time benefits <strong>for</strong> the highthresholddeclutter interface are easy to understand.For the tracks that the algorithm assessedto be significant threats, ring-crossing eventswere clearly visible because these were the onlyfully visible tracks on the display. Threat levelincrease events were also easy to observe becausethese events typically caused a declutteredtrack to turn fully visible. Even if a participantdid not see the actual change in status, once atrack became fully visible, it was easy to noticequickly. On the rare occasion when participantsdetermined that a decluttered track was in facta significant threat, response times were substantiallylonger. However, these longer times werein fact about the same length as those in thebaseline condition. There<strong>for</strong>e, the high-thresholddeclutter interface led to substantial responsetime benefits when the participants and automationagreed and led to no delays when they disagreed.For the medium-threshold declutter interface,in contrast, detecting ring crossings was moredifficult because there were substantially morefully visible tracks to monitor, only some ofwhich were actually significantly threatening.Similarly, threat level increases that turned aborderline track into a significant threat wouldhave been difficult to detect because the borderlinetracks were already fully visible. Consequently,this interface required close monitoring of theborderline tracks. These extra burdens placedon participants in the medium-threshold decluttercondition may explain the relative lack ofresponse time benefits.Participants were split, however, in their preference<strong>for</strong> the medium- and high-threshold declutterinterfaces. The medium-declutter interfacewas viewed as safer, and it fit with a more conservativestance toward decluttering. Similarly,our hypothesis going into the experiment hadbeen that the medium-threshold declutter interfacerepresented a sensible compromise betweenthe “aggressive” decluttering of the high-thresholddeclutter interface and the baseline no-declutterinterface. By leaving borderline threats fully visible,we reasoned that participants would nevermiss a threat but would still realize benefits frommonitoring a reduced set of fully visible tracks.However, the response times do not support thisconservative stance. The response times indicatethat high-threshold decluttering allowedparticipants to focus easily on the unambiguousthreats of the fully visible tracks and still maintaina broad awareness of additional potentialthreats.Note also that all participants were conservativeand appropriately skeptical of the automationin the sense that all participants continuedto hook and evaluate decluttered tracks and evenoccasionally ordered responses to declutteredtracks. No participant mistook the threat assessmentalgorithm <strong>for</strong> a perfect indicator of threat.This level of continuing verification may be surprisingto some, but it may make more sense inlight of two facts. First, U.S. Navy users havesubstantial experience with new technology duringnaval exercises and tend to be sensibly wary.Second, the declutter system made verificationvery easy, so that users could remain engagedand continue to evaluate tracks <strong>for</strong> themselvessimply by selecting tracks and viewing their data.This continued verification limited the chanceof a misevaluated track failing to be attended, asindicated by the occasional response to a borderlinethreat track.An interesting compromise between highandmedium-threshold declutter might be a twoleveldecluttering that codes significant and borderlinethreats differently from each other andfrom low threats. This design is reminiscent ofmultilevel alerts (Sorkin, Kantowitz, & Kantowitz,1988; St. John & Manes, 2002) and fuzzysignal detection (Parasuraman, Masalonis, &Hancock, 2000). Such a display would still clearlyidentify significant threats but also providesupport <strong>for</strong> more conservative per<strong>for</strong>mance byidentifying borderline threats as well. The dangeris that the different codings must remain easilydiscriminable, or users will be unable to efficientlyfocus their attention.It is interesting and important to considerhow these results might change, and where theoptimal threshold might lie, as the numbers ofsignificant, borderline, and low-threat tracks andthe reliability of the algorithm change – <strong>for</strong> example,by placing the algorithm in a differentscenario context. Here, we found that settingthe declutter threshold to match the definition ofsignificant threat was better than setting thethreshold lower. If the number of significantthreats increased, then the burden of closelyDownloaded from hfs.sagepub.com by HFES General on June 15, 2012
HEURISTIC AUTOMATION FOR DECLUTTERING 523monitoring them would increase, but the benefitof identifying them against the backgroundof lower threat tracks ought to remain. If thenumber of low threats increased, then the occasionalburden of scanning the decluttered tracks<strong>for</strong> hidden threats would increase somewhat,but once again, the benefit of identifying thesignificant threats ought to remain. If, however,the number of borderline threats increased orif the reliability of the algorithm decreased, thenthe burden of scanning the decluttered tracks<strong>for</strong> hidden threats would rise rapidly. The clearidentification of the obvious threats, however,should continue to provide important responsetime benefits in comparison with the baselineno-declutter display. We are currently planningto systematically vary these parameters in acontrolled laboratory version of this monitoringtask and to observe how the costs and benefitsplay out.Another limit on the generalization of thesefindings is the short-term nature of the scenarios.In practice, users stand watch <strong>for</strong> hours ata time, over periods of weeks and months, andsignificant threats are typically few and far between.Whether these differences in task durationand threat frequency would change theresults of the study are unknown. Users whoguard against automation bias in the short termmight be lulled into complacency over the longterm. Future research and development of thedeclutter concept will need to take this possibilityinto account. For instance, it may be possibleto implement design features to help guardagainst this potential hazard. One such possibility,which resonated with participants duringtheir interviews, would be to adapt the declutterthreshold to suit the situation. This adaptationcould be controlled by the system based on per<strong>for</strong>manceor task variables (e.g., Parasuraman,Mouloua, & Molloy, 1996), user physiologyvariables (e.g., Mikulka, Scerbo, & Freeman,2002), or by the users themselves (see Kaber &Endsley, 2004, <strong>for</strong> a recent review). For instance,users could set the threshold low duringrelatively benign situations in order to see anypotential threats, and they could set the thresholdhigh during more tense situations in orderto focus on the more significant threats.Finally, although the current experiment wasdesigned to demonstrate the basic benefits ofdecluttering, there are, in fact, numerous ways inwhich the declutter interface may be improved.The most important suggestion from participantswas, in our view, to better indicate changes inthreat and declutter status. During the experiment,threat level increases that changed a trackfrom nonthreatening to significantly threateningproduced a relatively salient change in visibility:from a dimmed, decluttered symbol to a fullyvisible symbol. However, these relatively largevisibility changes still led to fairly long responsetimes. It seems likely that in many cases, participantsdid not actually observe the status andsymbol changes but found the already-changedtracks during their normal scanning around thedisplay. Research in change blindness (see Rensink,2002) shows that even salient changes ina display may be difficult to observe unless theyhappen to be directly attended at the moment ofchange. Causing the track symbols to flash followinga status change might effectively drawusers’ attention, although perhaps at the priceof distracting users from other critical tasks. Analternative concept, in the vein of “negotiatedinterruptions” (McFarlane, 2002), is a “changehistory” tool (Smallman & St. John, 2003) thatpreserves a record of important changes on atactical display and improves users’ ability to remainapprised of important changes without undulydistracting them.CONCLUSIONSThe current experiment shows, within in thecontext of a realistic monitoring task, that declutteringless important tracks, by dimmingtheir symbols, can produce important per<strong>for</strong>mancebenefits. It further shows that even relativelysimple heuristic automation <strong>for</strong> identifyingpotential threats and assisting display searchcan prove quite effective when it is designed tosupport and guide users, rather than to replacethem, and when the verification process is easyand built into the normal tasking of the user.ACKNOWLEDGMENTSThe authors would like to thank subjectmatter experts Gene Averett, especially <strong>for</strong> hisassistance in creating the scenarios used in theexperiment, and Ronald Moore. This researchDownloaded from hfs.sagepub.com by HFES General on June 15, 2012
524 Fall 2005 – Human Factorswas sponsored by the Office of Naval Researchand the Space and Naval Warfare System Center,San Diego.REFERENCESBaddeley, A. D. (1972). Selective attention and per<strong>for</strong>mance indangerous environments. British Journal of Psychology, 63,537–546.Department of Defense. (1999). Department of defense, interfacestandard, common warfighting symbology (MIL-STD-2525B).Washington, DC: Department of Defense, Defense In<strong>for</strong>mationSystems Agency. Available at http://symbology.disa.mil/Fisher, D. L., Coury, B. G., Tengs, T. O., & Duffy, S. A. (1989).Minimizing the time to search visual displays: The role of highlighting.Human Factors, 31, 167–182.Hart, S. G., & Staveland, L. E. (1988). Development of a multidimensionalworkload rating scale: Results of empirical andtheoretical research. In P. A. Hancock & N. Meshkati (Eds.),Human mental workload (pp. 139–183). Amsterdam: Elsevier.Hollands, J. G., & Merikle, P. M. (1987). Menu organization anduser expertise in in<strong>for</strong>mation search tasks. Human Factors, 29,577–586.Johnson, W. W., Liao, M., & Granada, S. (2002). Effects of symbolbrightness cueing on attention during a visual search of a cockpitdisplay of traffic in<strong>for</strong>mation. In Proceedings of the HumanFactors and Ergonomics Society 46th Annual Meeting (pp.1599–1603). Santa Monica, CA: Human Factors and ErgonomicsSociety.Kaber, D. B., & Endsley, M. R. (2004). The effects of level ofautomation and adaptive automation on human per<strong>for</strong>mance,situation awareness and workload in a dynamic control task.Theoretical Issues in Ergonomics, 5, 113–153.Kaempf, G. L., Wolf, S., & Miller, T. E. (1993). Decision makingin the AEGIS combat in<strong>for</strong>mation center. In Proceedings of theHuman Factors and Ergonomics Society 37th Annual Meeting(pp. 1107–1111). Santa Monica, CA: Human Factors andErgonomics Society.Lee, J. D., & Moray, N. (1994). Trust, self-confidence, and operators’adaptation to automation. International Journal of Human-Computer Studies, 40, 153–184.Lee, J. D., & See, K. A. (2004). Trust in automation: Designing <strong>for</strong>appropriate reliance. Human Factors, 46, 50–80.Liebhaber, M. J. (2001). Description and evaluation of an airdefense threat assessment algorithm (Tech. Rep.). San Diego,CA: Pacific Science & Engineering Group.Liebhaber, M. J., Kobus, D. A., & Feher, B. A. (2002). Studies ofU.S. Navy air defense threat assessment: Cues, in<strong>for</strong>mationorder, and impact of conflicting data (Tech. Rep. SSC-1888).San Diego, CA: Space and Naval Warfare Systems Center.Marshall, S. P., Christensen, S. E., & McAllister, J. A. (1996). Cognitivedifferences in tactical decision making. In Proceedings ofthe 1996 Command and Control Research and TechnologySymposium (pp. 122–132). Washington, DC: Department ofDefense, Command and Control Research Program.McFarlane, D. C. (2002). Comparison of four primary methods <strong>for</strong>coordinating the interruption of people in human-computerinteraction. Human-Computer Interaction, 17, 63–139.Mikulka, P. J., Scerbo, M. W., & Freeman, F. G. (2002). Effects of abiocybernetic system on vigilance per<strong>for</strong>mance. Human Factors,44, 654–664.Morrison, J. G., Kelly, R. T., & Hutchins, S. G. (1996). Impact ofnaturalistic decision support on tactical situation awareness. InProceedings of the Human Factors and Ergonomics Society 40thAnnual Meeting (pp. 199–203). Santa Monica, CA: HumanFactors and Ergonomics Society.National Aeronautics and Space Administration. (n.d.). Task LoadIndex [TLX] Version 1.0, user’s manual. Available at http://iac.dtic.mil/hsiac/Products.htm#TLXNugent, W. A. (1996). Comparison of variable coded symbology toa conventional tactical situation display method. In Proceedingsof the Human Factors and Ergonomics Society 40th AnnualMeeting (pp. 1174–1178). Santa Monica, CA: Human Factorsand Ergonomics Society.Osga, G., & Keating, R. (1994). Usability study of variable codingmethods <strong>for</strong> tactical in<strong>for</strong>mation display visual filtering (Tech.Rep. NOSC-2628). San Diego, CA: Naval Command, Controland Ocean Surveillance Center, Research, Development, Test,and Evaluation Division.Parasuraman, R., Masalonis, A. J., & Hancock, P. A. (2000). Fuzzysignal detection theory: Basic postulates and <strong>for</strong>mulas <strong>for</strong> analyzinghuman and machine per<strong>for</strong>mance. Human Factors, 42,636–659.Parasuraman, R., Mouloua, M., & Molloy, R. (1996). Effects ofadaptive task allocation on monitoring of automated systems.Human Factors, 38, 665–679.Parasuraman, R., & Riley, V. (1997). Humans and automation:Use, misuse, disuse, abuse. Human Factors, 39, 230–253.Parasuraman, R., Sheridan, T. B., & Wickens, C. D. (2000). Amodel <strong>for</strong> types and levels of human interaction with automation.IEEE Transactions on Systems, Man, and Cybernetics –Part A: Systems and Humans, 30, 286–297.Posner, M. I. (1980). Orienting of attention. Quarterly Journal ofExperimental Psychology, 32, 3–25.Rensink, R. A. (2002). Change detection. Annual Review of Psychology,53, 245–277.Schultz, E. E., Nichols, D. A., & Curran, P. S. (1985). <strong>Decluttering</strong>methods <strong>for</strong> high density computer-generated graphic displays.In Proceedings of the Human Factors Society 29th AnnualMeeting (pp. 300–303). Santa Monica, CA: Human Factorsand Ergonomics Society.Smallman, H. S., & St. John, M. (2003). CHEX (Change HistoryEXplicit): New HCI concepts <strong>for</strong> change awareness. In Proceedingsof the Human Factors and Ergonomics Society 46thAnnual Meeting (pp. 528–532). Santa Monica, CA: HumanFactors and Ergonomics Society.Sorkin, R. D., Kantowitz, B. H., & Kantowitz, S. C. (1988). Likelihoodalarm displays. Human Factors, 30, 445–459.St. John, M., Feher, B. A., & Morrison, J. G. (2002). Evaluatingalternative symbologies <strong>for</strong> decluttering geographical displays(Tech. Rep. SSC-1890). San Diego, CA: Space and NavalWarfare System Center.St. John, M., & Manes, D. I. (2002). Making unreliable automationuseful. In Proceedings of the Human Factors and ErgonomicsSociety 46th Annual Meeting (pp. 332–336). Santa Monica,CA: Human Factors and Ergonomics Society.St. John, M., Manes, D. I., Smallman, H. S., Feher, B. A., & Morrison,J. G. (2004). An intelligent threat assessment tool <strong>for</strong>decluttering naval air defense displays (Tech. Rep. SSC-1915).San Diego, CA: Space and Naval Warfare System Center.St. John, M., Oonk, H. M., & Osga, G. A. (2000). Designing displays<strong>for</strong> command and control supervision: Contextualizingalerts and “trust but verify” automation. In Proceedings of theXIVth Triennial Congress of the International ErgonomicsAssociation and 44th Annual Meeting of the Human Factorsand Ergonomics Society (pp. 6.646–6.649). Santa Monica, CA:Human Factors and Ergonomics Society.Treisman, A. M., & Gelade, G. (1980). A feature-integration theoryof attention. Cognitive Psychology, 12, 97–136.Van Orden, K. F., DiVita, J., & Shim, M. J. (1993). Redundant useof luminance and flashing with shape and color as highlightingcodes in symbolic displays. Human Factors, 35, 195–204.Yeh, M., & Wickens, C. D. (2001a). Attentional filtering in thedesign of electronic map displays: A comparison of color coding,intensity coding, and decluttering techniques. Human Factors,43, 543–562.Yeh, M., & Wickens, C. D. (2001b). Display signaling in augmentedreality: Effects of cue reliability and image realism on attentionallocation and trust calibration. Human Factors, 43, 355–365.Mark St. John is director of the Cognitive SystemsDivision at Pacific Science & Engineering Group,Inc. He received his Ph.D. in cognitive psychologyin 1990 at Carnegie-Mellon University.Downloaded from hfs.sagepub.com by HFES General on June 15, 2012
HEURISTIC AUTOMATION FOR DECLUTTERING 525Harvey S. Smallman is a senior scientist at PacificScience & Engineering Group, Inc. He received hisPh.D. in experimental psychology in 1993 at theUniversity of Cali<strong>for</strong>nia, San Diego.Daniel I. Manes is a senior human factors engineer atPacific Science & Engineering Group, Inc. He receivedhis M.S.E. in industrial and operations engineeringin 1997 at the University of Michigan, Ann Arbor.Bela A. Feher is a senior scientist at the Space andNaval Warfare System Center, San Diego. He receivedhis Ph.D. in social psychology in 1970 at Wayne StateUniversity.Jeffrey G. Morrison is a senior scientist at the Spaceand Naval Warfare System Center, San Diego. Hereceived his Ph.D. in psychology in 1992 at theGeorgia Institute of Technology.Date received: December 31, 2003Date accepted: November 5, 2004Downloaded from hfs.sagepub.com by HFES General on June 15, 2012