Establishing an Upper-Bound for the Benefits of NextGen Trajectory ...
Establishing an Upper-Bound for the Benefits of NextGen Trajectory ...
Establishing an Upper-Bound for the Benefits of NextGen Trajectory ...

Create successful ePaper yourself
Turn your PDF publications into a flip-book with our unique Google optimized e-Paper software.
<strong>Establishing</strong> <strong>an</strong> <strong>Upper</strong>-<strong>Bound</strong> <strong>for</strong> <strong>the</strong> <strong>Benefits</strong> <strong>of</strong><strong>NextGen</strong> <strong>Trajectory</strong>-Based OperationsGuillermo Calderón-Meza (Ph.D. C<strong>an</strong>didate)Research Assist<strong>an</strong>tCenter <strong>for</strong> Air Tr<strong>an</strong>sportation Systems ResearchGeorge Mason UniversityFairfax, Virginia, 22030, USAEmail: gcaldero@gmu.eduL<strong>an</strong>ce Sherry (Ph.D)DirectorCenter <strong>for</strong> Air Tr<strong>an</strong>sportation Systems ResearchGeorge Mason UniversityFairfax, Virginia, 22030, USAEmail: lsherry@gmu.eduAbstract—<strong>NextGen</strong> enabling technologies <strong>an</strong>d operational initiativesseek to increase <strong>the</strong> effective-capacity <strong>of</strong> <strong>the</strong> NationalAirspace System. Concepts-<strong>of</strong>-operations, such as <strong>Trajectory</strong>-Based Operations, will allow flights increased flexibility in <strong>the</strong>ir4-D trajectories as <strong>the</strong>y traverse Center airspace. Shifting trajectoriesin this way c<strong>an</strong> minimize <strong>the</strong> airlines operating costs(i.e., dist<strong>an</strong>ce flown), shift <strong>the</strong> geography <strong>of</strong> Air Traffic Control(ATC) workload (i.e., sectors used), shift <strong>the</strong> time-intensity <strong>of</strong>ATC workload (i.e., flights counts per sector).This paper describes <strong>the</strong> results <strong>of</strong> <strong>an</strong> <strong>an</strong>alysis <strong>of</strong> one day<strong>of</strong> operations in <strong>the</strong> NAS using traditional navigation aid-basedairway routes compared to direct, i.e., Great Circle Dist<strong>an</strong>ce,routes. The results yield: (i) a total <strong>of</strong> 598,724.8 nm (average30.1 nm per flight) savings generated by flying direct routes, (ii)a redistribution <strong>of</strong> flights across sectors resulting in a reduction<strong>of</strong> 11% in <strong>the</strong> total time <strong>the</strong> flights in a sector are in excess <strong>of</strong><strong>the</strong> Monitor Alert Parameters <strong>for</strong> that sector, (iii) a reduction inATC workload reflected by a 47% drop in <strong>the</strong> number <strong>of</strong> flightsrequiring conflict resolution. These results indicate upper bound<strong>of</strong> benefit opportunities <strong>for</strong> both ATC <strong>an</strong>d <strong>the</strong> airlines based on<strong>the</strong> introduction <strong>of</strong> flexible routing structures in <strong>NextGen</strong>.Index Terms—<strong>NextGen</strong>, evaluation, conflicts, FACET, dist<strong>an</strong>ceflown, delays.I. INTRODUCTION<strong>NextGen</strong> [1] enabling technologies <strong>an</strong>d operational initiativesseek to increase <strong>the</strong> effective-capacity <strong>of</strong> <strong>the</strong> NationalAirspace System (NAS) by opening up unused airspace, increasing<strong>the</strong> availability <strong>of</strong> airspace in all wea<strong>the</strong>r conditions,<strong>an</strong>d increasing <strong>the</strong> utilization <strong>of</strong> existing airspace by reducingspacing between flights on <strong>the</strong> same routes.Concepts <strong>of</strong> operations, such as <strong>Trajectory</strong>-based Operations(TBO), will allow flights increased flexibility in <strong>the</strong>ir4-D trajectories as <strong>the</strong>y traverse center airspace. Whereas<strong>the</strong> airlines may benefit from reduced dist<strong>an</strong>ce flown, <strong>the</strong>adjustment <strong>of</strong> <strong>the</strong> 4-D trajectories will shift <strong>the</strong> geographicdistribution <strong>of</strong> flights across Air Traffic Control (ATC) sectors,as well as <strong>the</strong> distribution <strong>of</strong> inst<strong>an</strong>t<strong>an</strong>eous flight counts inindividual sectors. Several related concepts are identified as<strong>Trajectory</strong>-Based Operations 1 : 1) Continuous Decent Arrivals(CDA)) that smooth <strong>the</strong> tr<strong>an</strong>sition from top-<strong>of</strong>-decent to nearidle speed. These include Tailored Arrivals that use technology(automation tools <strong>an</strong>d data communications) to provide a preferredtrajectory path <strong>an</strong>d tr<strong>an</strong>sfer it to <strong>the</strong> flight m<strong>an</strong>agementsystem on <strong>the</strong> aircraft. 2) 3D Path Arrival M<strong>an</strong>agement thatdesigns fuel-efficient routes to decrease controller <strong>an</strong>d pilotworkloads. 3) 4D <strong>Trajectory</strong>-Based M<strong>an</strong>agement that defines3-dimensional flight paths based on points in time (<strong>the</strong> 4-D) from gate-to-gate. 4) Required Navigation Per<strong>for</strong>m<strong>an</strong>cein which navigation per<strong>for</strong>m<strong>an</strong>ce requirements <strong>for</strong> operationwithin <strong>an</strong> airspace define <strong>the</strong> trajectories. 5) Pre-negotiatedroutes 2 that are agreed be<strong>for</strong>e take <strong>of</strong>f. In this paper, only <strong>the</strong>third definition is considered.This paper <strong>an</strong>alyzes <strong>the</strong> potential upper bound <strong>of</strong> impact <strong>of</strong><strong>the</strong> shifting trajectories to minimize <strong>the</strong> airlines operating costs(i.e., dist<strong>an</strong>ce flown), <strong>the</strong> geographic workload (i.e., sectorsused), <strong>an</strong>d <strong>the</strong> time workload (i.e., flights counts per sector) <strong>for</strong>Air Traffic Control (ATC). Similar studies have been carriedout to evaluate <strong>the</strong> impact <strong>of</strong> this ch<strong>an</strong>ge <strong>an</strong>d o<strong>the</strong>r ch<strong>an</strong>gesproposed by <strong>NextGen</strong>. Barnett [2] evaluates <strong>the</strong> impact insafety caused by using direct routes instead <strong>of</strong> airways. Thestudy concludes that using direct routes diminishes <strong>the</strong> risk <strong>of</strong>en-route collision. These results are valid only if certain rules<strong>for</strong> TFM remain in effect after <strong>the</strong> ch<strong>an</strong>ge. A caveat <strong>of</strong> <strong>the</strong>study is that <strong>the</strong> results will depend on <strong>the</strong> capacity <strong>of</strong> <strong>the</strong>technology <strong>an</strong>d hum<strong>an</strong>s to match <strong>the</strong> current per<strong>for</strong>m<strong>an</strong>ce <strong>of</strong><strong>the</strong> ATC. Agogino <strong>an</strong>d Tumer [3] evaluate policies intendedto optimize per<strong>for</strong>m<strong>an</strong>ce <strong>of</strong> <strong>the</strong> TFM. The metrics used arecongestion <strong>an</strong>d delays. The study evaluates several ATC algorithmsas well as <strong>the</strong> use <strong>of</strong> multi-agent technology. Thealgorithms achieve signific<strong>an</strong>t improvements in per<strong>for</strong>m<strong>an</strong>cecompared to previous algorithms <strong>an</strong>d <strong>the</strong> current practices.Magill [4] also <strong>an</strong>alyzes <strong>the</strong> ch<strong>an</strong>ge from airway routes todirect routes. The study uses <strong>the</strong> number <strong>of</strong> conflicts (calledinteractions in this case) as <strong>an</strong> approximate metric <strong>of</strong> <strong>the</strong> ATCworkload. The study modifies <strong>the</strong> separation rules as well as<strong>the</strong> type <strong>of</strong> routes. The paper concludes that <strong>the</strong> reduction<strong>of</strong> traffic density due to <strong>the</strong> use <strong>of</strong> direct routes is <strong>the</strong> mostsignific<strong>an</strong>t factor in <strong>the</strong> reduction <strong>of</strong> workload <strong>for</strong> <strong>the</strong> ATC.1 Available at http://www.afceaboston.com/documents/events/cnsatm2009/Briefings/Tuesday%20Briefs/Tuesday%20Afternoon/ Track%202/2%20TBO%20Presentation G eneHaym<strong>an</strong>.pdfonApril2, 2 See <strong>the</strong> FAA web site2010<strong>for</strong> more details about TBO
The Future ATM Concept Evaluation Tool (FACET 3 ) [5]was used <strong>for</strong> this experiment that included 19,900 domesticflights between 287 airports (4,170 O/D pairs). The experimentconsisted <strong>of</strong> two scenarios: (i) flights followed Great CircleDist<strong>an</strong>ce (GCD) routes from TRACON to TRACON, <strong>an</strong>d (ii)flights followed traditional navigation aid-based airway routes.The flights in each scenario used <strong>the</strong> same cruise flight levels<strong>an</strong>d cruise speeds. The results are summarized below:(i) Great Circle Dist<strong>an</strong>ce routes generated a total <strong>of</strong>598,724.8 nm (average 30.1 nm per flight) savings inreduced dist<strong>an</strong>ce flown.(ii) Great Circle Dist<strong>an</strong>ce routes resulted in a redistribution<strong>of</strong> ATC workload reducing <strong>the</strong> time sectors were above<strong>the</strong>ir Monitor Alert Threshold (MAP) from 32% to 21%.(iii) Great Circle Dist<strong>an</strong>ce routes resulted in reduced ATCworkload reducing <strong>the</strong> number <strong>of</strong> flights with conflictingtrajectories by 47%.These results establish <strong>an</strong> upper bound on <strong>the</strong> benefits tobe derived by <strong>Trajectory</strong>-based Operations. The result is awin-win scenario <strong>for</strong> both <strong>the</strong> airlines <strong>an</strong>d air traffic control.The use <strong>of</strong> Great Circle Dist<strong>an</strong>ce routes geographically redistributed<strong>the</strong> flights reducing workload in <strong>the</strong> most congestedsectors <strong>an</strong>d well as signific<strong>an</strong>tly reducing conflicts in flighttrajectories. It should also be noted that <strong>the</strong> use <strong>of</strong> Great CircleDist<strong>an</strong>ce routes did not alleviate <strong>the</strong> flight delays resultingfrom over-scheduled departure <strong>an</strong>d arrivals.This paper is org<strong>an</strong>ized as follows: Section 2 describes<strong>the</strong> design <strong>of</strong> <strong>the</strong> experiment, <strong>the</strong> simulation used <strong>for</strong> <strong>the</strong>experiment, <strong>an</strong>d <strong>the</strong> configuration <strong>an</strong>d parameters used in <strong>the</strong>experiment, Section 3 describes <strong>the</strong> results <strong>of</strong> <strong>the</strong> experiment,<strong>an</strong>d Section 4 provides conclusions, implications <strong>of</strong> <strong>the</strong>seresults, <strong>an</strong>d future work.II. METHOD AND DESIGN OF THE EXPERIMENTThis section describes <strong>the</strong> design <strong>of</strong> <strong>the</strong> experiment <strong>an</strong>d <strong>the</strong>simulation environment used.The experiment was conducted using <strong>the</strong> Future ATMConcept Evaluation Tool (FACET) [5]. The tool has beenused in previous studies [3], [6], [7] to evaluate new TrafficFlow M<strong>an</strong>agement (TFM) concepts in <strong>the</strong> NAS. FACET <strong>of</strong>fersm<strong>an</strong>y options like <strong>the</strong> possibility connecting to real-time datasources <strong>for</strong> wea<strong>the</strong>r <strong>an</strong>d traffic, real-time conflict detection<strong>an</strong>d resolution, batch processing <strong>of</strong> input data (as <strong>an</strong> optionto real-time streams), <strong>an</strong>d a Java API 4 . In <strong>the</strong> absences <strong>of</strong>r<strong>an</strong>dom inputs (like wea<strong>the</strong>r phenomena) <strong>the</strong> simulation isdeterministic. The results will be <strong>the</strong> same regardless <strong>of</strong> <strong>the</strong>number <strong>of</strong> executions.O<strong>the</strong>r metrics <strong>of</strong> <strong>the</strong> system, like number <strong>of</strong> sectors orcenters flown, dist<strong>an</strong>ce flown, <strong>an</strong>d number <strong>of</strong> conflicts, c<strong>an</strong>be obtained from <strong>the</strong> API or from <strong>the</strong> GUI 5 .3 See www.aviationsystemsdivision.arc.nasa.gov/research/modeling/facet.shtml4 API: Application Program Interface.5 GUI: Graphical User Interface.A. The input files <strong>for</strong> FACETThe main input to FACET is <strong>the</strong> flight schedule, flight tracks<strong>an</strong>d cruise flight-levels. FACET accepts several <strong>for</strong>mats <strong>for</strong><strong>the</strong>se input files known as ASDI, TRX. To achieve <strong>the</strong> goals<strong>of</strong> this experiment, a TRX input file was generated based onactual historical data from <strong>the</strong> Airline On Time Per<strong>for</strong>m<strong>an</strong>ceData data provided by Bureau <strong>of</strong> Tr<strong>an</strong>sportation Statistics(BTS). The procedure <strong>for</strong> generating <strong>the</strong> TRX file is describedbellow:First, <strong>the</strong> sample TRX files that come with FACET wereparsed <strong>an</strong>d <strong>the</strong> O/D pairs <strong>an</strong>d corresponding flight pl<strong>an</strong>s wereextracted <strong>an</strong>d exported to a database.Second, <strong>the</strong> BTS Airline On-Time Per<strong>for</strong>m<strong>an</strong>ce (AOTP)data was queried to obtain a single day <strong>of</strong> domestic operations.The query extracted <strong>the</strong> O/D pair, <strong>the</strong> coordinates <strong>for</strong><strong>the</strong> airports (taken from a proprietary table), <strong>the</strong> scheduleddeparture <strong>an</strong>d arrival times, <strong>the</strong> flight <strong>an</strong>d tail numbers, <strong>an</strong>d<strong>the</strong> aircraft type (taken from a proprietary table related to OnTime by tail number). The results <strong>of</strong> this query are sorted,ascending, by scheduled departure time.For each record returned by <strong>the</strong> query <strong>the</strong> great circledist<strong>an</strong>ce <strong>of</strong> <strong>the</strong> O/D pair, <strong>the</strong> expected flight time (that is <strong>the</strong>difference <strong>of</strong> <strong>the</strong> scheduled departure <strong>an</strong>d arrival times bothconverted to GMT), <strong>the</strong> required ground speed (<strong>an</strong>d integernumber <strong>of</strong> knots), <strong>the</strong> heading (<strong>an</strong> integer number computedfrom <strong>the</strong> coordinates <strong>of</strong> <strong>the</strong> airports assuming 0 degrees <strong>for</strong>North heading, <strong>an</strong>d 90 degrees <strong>for</strong> West heading), <strong>an</strong>d <strong>the</strong>flight level (a uni<strong>for</strong>mly distributed r<strong>an</strong>dom integer numberfrom 200 to 450), <strong>an</strong>d <strong>the</strong> flight pl<strong>an</strong> (taken r<strong>an</strong>domly fromavailable pl<strong>an</strong>s <strong>for</strong> <strong>the</strong> O/D pair). The coordinates <strong>of</strong> <strong>the</strong>airports are converted into integer numbers with <strong>the</strong> <strong>for</strong>mat[+|-]DMS where D st<strong>an</strong>ds <strong>for</strong> degrees (two or three digits), Mst<strong>an</strong>ds <strong>for</strong> minutes (two digits), <strong>an</strong>d S st<strong>an</strong>ds <strong>for</strong> seconds (twodigits). FACET requires western longitudes to be negative.Third, <strong>for</strong> each group <strong>of</strong> records with <strong>the</strong> same GMT scheduleddeparture time one “TRACKTIME” record is written toa text file. The value <strong>of</strong> <strong>the</strong> TRACKTIME record is <strong>the</strong> GMTscheduled departure datetime converted into <strong>the</strong> number <strong>of</strong> seconds from J<strong>an</strong>uary 1,1970 GMT. After this TRACKTIME record, <strong>the</strong> individual“TRACK” records <strong>for</strong> <strong>the</strong> flights are written using <strong>the</strong> datacomputed in <strong>the</strong> second step. The process repeats until <strong>the</strong>reare no more records from <strong>the</strong> query. An input file generatedthis way does not track <strong>the</strong> flights through <strong>the</strong> NationalAirspace System. It only describes every flight with a singlerecord. So this file c<strong>an</strong> be used <strong>for</strong> simulation purposes only,not <strong>for</strong> playback in FACET.The file used in this experiment contains 19,900 domestic(USA) flights scheduled to departure from Friday July 27 2007at 05:30:00 GMT to Saturday July 28 2007 at 09:20:00 GMT.The actual l<strong>an</strong>ding datetime <strong>of</strong> <strong>the</strong> last flight differs between scenarios because flightscould be delayed or <strong>the</strong>y could fly different dist<strong>an</strong>ces.
B. Design <strong>of</strong> ExperimentThe goal <strong>of</strong> this experiment is to evaluate <strong>the</strong> effect <strong>of</strong>ch<strong>an</strong>ging from <strong>the</strong> current airway routes, i.e., flight pl<strong>an</strong>s,to Great Circle Dist<strong>an</strong>ce routes, i.e., direct routes, as it isproposed by <strong>NextGen</strong>.This paper presents <strong>an</strong>d compares <strong>the</strong> results <strong>of</strong> one experimentdivided into two scenarios (see Table IV). The firstscenario simulates one day <strong>of</strong> NAS operations in which all <strong>the</strong>flights use airway routes, i.e., flight pl<strong>an</strong>s, as it is done todayin <strong>the</strong> NAS. The second scenario simulates <strong>the</strong> same day <strong>of</strong>operations, but flights follow Great Circle Dist<strong>an</strong>ces routes,i.e., direct routes, between <strong>the</strong> origin <strong>an</strong>d <strong>the</strong> destination.The outcomes <strong>of</strong> interest <strong>for</strong> each scenario are <strong>the</strong> totalnumber <strong>of</strong> centers <strong>an</strong>d sectors, <strong>an</strong>d <strong>the</strong> dist<strong>an</strong>ce flown by <strong>the</strong>flights, <strong>the</strong> total number <strong>of</strong> conflicts detected, <strong>an</strong>d <strong>the</strong> flightdelays generated in <strong>the</strong> OEP-35 6 airports. The benefits <strong>an</strong>dcosts <strong>for</strong> <strong>the</strong> airlines, controllers, <strong>an</strong>d <strong>the</strong> environment c<strong>an</strong> becomputed using <strong>the</strong>se outcomes.The dist<strong>an</strong>ces flown are compared using a paired two-tailt-test. The paired t-test applies since <strong>the</strong> simulator (FACET)uses <strong>the</strong> same input file in both scenarios, so each flight in onescenario c<strong>an</strong> be compared to its similar in <strong>the</strong> o<strong>the</strong>r scenario.However, it was observed that some flights do not appear bothscenarios, even if <strong>the</strong> input file is <strong>the</strong> same. The reasons <strong>for</strong>this fact are still not completely understood. The reasons <strong>for</strong>this fact are still not completely understood. But, only flightsthat appear in both scenarios are used in <strong>the</strong> t-test.The comparison <strong>of</strong> <strong>the</strong> total number <strong>of</strong> conflicts is only done<strong>for</strong> a single pair <strong>of</strong> numbers, so no statistical test is applied inthis case.The distribution <strong>of</strong> <strong>the</strong> sectors load is multi-dimensional.There is spatial distribution <strong>an</strong>d temporal distribution. In thispaper mainly <strong>the</strong> temporal distribution will be <strong>an</strong>alyzed, leaving<strong>the</strong> spatial distribution <strong>for</strong> future work. The two scenariosare compared using <strong>the</strong> percentage <strong>of</strong> time in which at leastone sector contains a number <strong>of</strong> flights that is on or over <strong>the</strong>sectors Monitor Alert Parameter (MAP) value, i.e., it is overloaded.To get <strong>an</strong> idea <strong>of</strong> <strong>the</strong> distribution, also <strong>the</strong> percentage<strong>of</strong> time in which at least one sector is at or over 80% <strong>of</strong> itsMAP is compared between scenarios.No external disturb<strong>an</strong>ces are included during <strong>the</strong> simulations,i.e., <strong>the</strong>re are no restrictions due to wea<strong>the</strong>r, congestion,push-back delays, or o<strong>the</strong>r stochastic events. So, <strong>the</strong> simulationsare deterministic. The only limitation that is imposed in<strong>the</strong> arrival capacity <strong>of</strong> <strong>the</strong> EOP-35 airports, which is set to <strong>the</strong>VFR departure <strong>an</strong>d arrival rates <strong>for</strong> <strong>the</strong> whole day (see Table I).Even with VFR rates, this limitation generates ground delaysvia Ground Delay Programs (GDP), but <strong>the</strong>ir effect is notstrong because <strong>the</strong> airports are not signific<strong>an</strong>tly over-scheduledin <strong>the</strong> scenario input file used <strong>for</strong> <strong>the</strong> experiment. However, <strong>the</strong>ground delays are compared using <strong>the</strong> total minutes <strong>of</strong> delays<strong>an</strong>d <strong>the</strong> average minutes in <strong>the</strong> OEP-35 airports which are <strong>the</strong>only ones restricted using GDPs.6 OEP: Operational Evolution Partnership Pl<strong>an</strong>.TABLE IDEFAULT VFR AIRPORT ARRIVAL RATES (AAR) FOR THE OEP-35AIRPORTS USED IN THE SIMULATIONAirportname(ICAO)Airport ArrivalRate(Moves per hour)Airportname(ICAO)Airport ArrivalRate(Moves per hour)KATL 80 KLGA 40KBOS 60 KMCO 52KBWI 40 KMDW 32KCLE 40 KMEM 80KCLT 60 KMIA 68KCVG 72 KMSP 52KDCA 44 KORD 80KDEN 120 KPDX 36KDFW 120 KPHL 52KDTW 60 KPHX 72KEWR 40 KPIT 80KFLL 44 KSAN 28KHNL 40 KSEA 36KIAH 72 KSFO 60KJFK 44 KSLC 44KLAS 52 KSTL 52KLAX 84 KTPA 28C. FACET settings used in experimentIn this experiment, FACET takes its input from batch files,<strong>an</strong>d <strong>the</strong> outputs are taken from <strong>the</strong> simulation via <strong>the</strong> API. Theinput file was loaded using <strong>the</strong> loadDirectRouteSimAsynch <strong>an</strong>d<strong>the</strong> loadFlightPl<strong>an</strong>SimAsynch functions <strong>of</strong> <strong>the</strong> API. With <strong>the</strong>first function, FACET sets itself to use Great Circle Dist<strong>an</strong>ceroutes, i.e., direct routes. With <strong>the</strong> second function, FACETuses <strong>the</strong> airways routes, i.e., flight pl<strong>an</strong>s, provided in <strong>the</strong> inputfile. Both functions accept <strong>the</strong> same number <strong>an</strong>d types <strong>of</strong>arguments. The trajectory update interval is set to 60. Theintegration time step is set to 60.0. And <strong>the</strong> additional updatedelay is set to 0.2.The API provides <strong>an</strong> interface (ConflictInterface) withfunctions to enable (setEnabled) <strong>an</strong>d configure (setConflict-DetectionParameters) <strong>the</strong> conflict detection functionality. Theparameters are as follows. The center index is set to -1,i.e., all <strong>the</strong> centers. The surveill<strong>an</strong>ce zone is 120 nm. Thelookahead time is 0. The horizontal separation is 6 nm.The vertical separation below f1290 is 1000 ft. The verticalseparation above f1290 is 1000 ft. Also, <strong>the</strong> detected conflictsare displayed during <strong>the</strong> simulation.The arrival rates (AAR) <strong>of</strong> <strong>the</strong> airports are infinite by defaultin FACET. For this experiment, <strong>the</strong> capacities are limited usingFACET’s GDP functionality. The OEP-35 airports are assigneda maximum capacity in <strong>the</strong> <strong>for</strong>m <strong>of</strong> <strong>an</strong> arrival delay GDP from<strong>the</strong> 0:00 to 24:00 (see Table I). With <strong>the</strong>se limits in <strong>the</strong> capacity<strong>of</strong> <strong>the</strong> airports, FACET starts recording delay statistics during<strong>the</strong> simulations.A total <strong>of</strong> 35 hours <strong>an</strong>d 55 minutes (2,155 minutes) <strong>of</strong>operations are simulated. All o<strong>the</strong>r parameters <strong>of</strong> FACET areleft to <strong>the</strong>ir default values.An external Java program, using <strong>the</strong> FACET API, measures<strong>the</strong> dist<strong>an</strong>ce traveled as follows. At each simulation time step(one minute) <strong>the</strong> dist<strong>an</strong>ce flown by each flight is updated basedon <strong>the</strong> previous <strong>an</strong>d current coordinates. The computation <strong>of</strong>
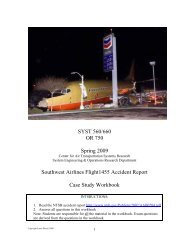
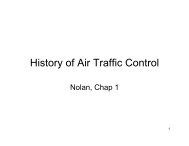
Frequency60005154500038864000300027312556Airway routesGCD routesMinimum 7.3 nm 14.6 nmAverage 642.4 nm 612.3 nmMedi<strong>an</strong> 518.3 nm 489.2 nmMode 98.6 nm 60.4 nmMaximum 2,497.4 nm 2,485.1 nmSD 473.3 nm 466.3 nmSum 12,783,583.0 nm 12,184,854.0 nm20792000Flight using airway routesFlights using GCD routes9821000812562335 336 284165180100 300 500 700 900 1100 1300 1500 1700 1900 2100 2300 2500Dist<strong>an</strong>ce flown when using airway / direct routes (nm)Frequency20000180001600014000120001000080006000400017951MinimumAverageMedi<strong>an</strong>ModeMaximumSDSum-7.9 nm30.1 nm17.3 nm0.0 nm1,498.5 nm60.7 nm598,724.8 nmFig. 1. Comparison <strong>of</strong> histograms <strong>of</strong> <strong>the</strong> dist<strong>an</strong>ces flown using airways <strong>an</strong>ddirect routesdist<strong>an</strong>ce is done with <strong>the</strong> utils.getGCDist<strong>an</strong>ceNM function <strong>of</strong>FACETs API. The external program also records <strong>the</strong> totalnumber <strong>of</strong> flights in each sector, including all <strong>the</strong> sector levels,i.e., low, high, <strong>an</strong>d super. Dist<strong>an</strong>ces <strong>an</strong>d sector loads are writteninto text files <strong>for</strong> fur<strong>the</strong>r <strong>an</strong>alyses.A. Dist<strong>an</strong>ces flownIII. RESULTSFigure 1 compares <strong>the</strong> histogram <strong>of</strong> <strong>the</strong> dist<strong>an</strong>ce flown whenusing airways to <strong>the</strong> histogram <strong>of</strong> <strong>the</strong> dist<strong>an</strong>ce flown whenusing direct routes. The figure also includes <strong>the</strong> descriptivestatistics <strong>for</strong> <strong>the</strong> scenarios. When using airways, most <strong>of</strong><strong>the</strong> flights travel less th<strong>an</strong> 1,000 nm, with a peak <strong>of</strong> flightsbetween 200 <strong>an</strong>d 400 nm. Short flights, i.e., less th<strong>an</strong> 200nm are frequent, but not a majority in this input file. Thereis a long tail in <strong>the</strong> distribution, but <strong>the</strong> actual number <strong>of</strong>flights is low compared to <strong>the</strong> o<strong>the</strong>r dist<strong>an</strong>ces. The flights withlonger dist<strong>an</strong>ces correspond to flights from Alaska or o<strong>the</strong>r USterritories not directly in <strong>the</strong> continent.When using direct routes, most <strong>of</strong> <strong>the</strong> flights travel less th<strong>an</strong>1,000 nm, with a peak <strong>of</strong> flights between 200 <strong>an</strong>d 400 nm.Short flights, i.e., less th<strong>an</strong> 200 nm are more frequent th<strong>an</strong>when using airways. This is <strong>an</strong> immediate benefit <strong>of</strong> usingdirect routes: shorter flown dist<strong>an</strong>ces. The comparison <strong>of</strong> <strong>the</strong>tails shows that <strong>the</strong>ir frequencies are similar.The distribution <strong>for</strong> <strong>the</strong> scenario <strong>of</strong> <strong>the</strong> direct routes isshifted toward <strong>the</strong> shorter dist<strong>an</strong>ces. This is evident in that<strong>the</strong> average, medi<strong>an</strong>, <strong>an</strong>d mode are smaller in this scenarioth<strong>an</strong> <strong>the</strong>y are in <strong>the</strong> airways scenario. The st<strong>an</strong>dard deviationis also smaller indicating that <strong>the</strong> distribution is less dispersein this scenario.The figure shows that <strong>the</strong> input file used in this experimentsis dominated by short to mid dist<strong>an</strong>ce dist<strong>an</strong>ce flights. Thisreflects that <strong>the</strong> input file comes from a database that containsonly data <strong>for</strong> actual domestic flights in <strong>the</strong> US. The greaterch<strong>an</strong>ges in <strong>the</strong> frequencies are observed in <strong>the</strong> flights from 0to 200 nm, <strong>an</strong>d from 800 to 1,000 nm. This suggests that <strong>the</strong>benefits <strong>of</strong> using direct routes are clearer in short flights or intr<strong>an</strong>s-continental flights.Figure 2 shows <strong>the</strong> distribution <strong>of</strong> <strong>the</strong> differences <strong>of</strong> dist<strong>an</strong>ceflown by corresponding flights in both scenarios, i.e., it is a20000Fig. 2.1093616110 46 10 21 6 18 14 4 5 0 1 2 3-50 50 150 250 350 450 550 650 750 850 950 1050 1150 1250 1350 1450Difference in <strong>the</strong> dist<strong>an</strong>ce flown (nm)Histogram <strong>of</strong> <strong>the</strong> flight-by-flight difference in <strong>the</strong> dist<strong>an</strong>ce flownTABLE IINUMBER OF MINUTES WITH AT LEAST ONE SECTOR SATURATED OR ONTHE VERGE OF SATURATIONNumber <strong>of</strong> minutes with at leastScenarioone sector on or above(% <strong>of</strong> <strong>the</strong> total 2,114 minutes)MAP 80% <strong>of</strong> MAPFlights using airway routes 689 (32%) 944 (44%)Flights using direct routes 456 (21%) 917 (43%)paired comparison <strong>of</strong> dist<strong>an</strong>ces. The figure also includes <strong>the</strong>descriptive statistics <strong>for</strong> <strong>the</strong> distribution. The 1,093 (5.5%) <strong>of</strong><strong>the</strong> differences in <strong>the</strong> dist<strong>an</strong>ce flown are negative indicatingthat <strong>the</strong> direct routes are longer th<strong>an</strong> <strong>the</strong> airway routes. Thisis ma<strong>the</strong>matically incorrect. This is due to errors in <strong>the</strong>measurement <strong>of</strong> <strong>the</strong> dist<strong>an</strong>ce during <strong>the</strong> simulation. Noticethat <strong>the</strong> minimum difference is -7.9 nm, <strong>an</strong>d <strong>the</strong> bin <strong>of</strong> <strong>the</strong>histogram goes from -100 to 0 nm, so <strong>the</strong> negative differencesare in this 7.9 nm r<strong>an</strong>ge. The peak <strong>of</strong> <strong>the</strong> histogram occurswhen <strong>the</strong> difference is between 0 <strong>an</strong>d 100 nm, 90% <strong>of</strong> <strong>the</strong>differences are in this r<strong>an</strong>ge.A paired two-tail t-test shows that <strong>the</strong> me<strong>an</strong> <strong>of</strong> <strong>the</strong> differencebetween <strong>the</strong> dist<strong>an</strong>ces flown by corresponding flights in <strong>the</strong>two scenarios is signific<strong>an</strong>tly different th<strong>an</strong> zero (M=30.1,SD = 60.7, N = 19,900), t = 69.9647 <strong>an</strong>d <strong>the</strong> two-tail p =0.000. A 95% confidence interval about <strong>the</strong> me<strong>an</strong> is (29.2,30.9). This average reduction in <strong>the</strong> dist<strong>an</strong>ce flown addsto 598,724.8 nm saved when using direct routes instead <strong>of</strong>airways. The reduction in dist<strong>an</strong>ce flown benefits <strong>the</strong> airlines<strong>an</strong>d <strong>the</strong> environment, through a reduction in fuel burned, i.e.,less pollution <strong>an</strong>d lower costs.B. Sectors over MAPA metric <strong>for</strong> <strong>the</strong> load <strong>of</strong> sectors is a function <strong>of</strong> time, space,<strong>the</strong> number <strong>of</strong> flights, <strong>an</strong>d routes <strong>of</strong> <strong>the</strong> flights. The number <strong>of</strong>flights did not ch<strong>an</strong>ge between scenarios in this experiment.The routes are expected to ch<strong>an</strong>ge signific<strong>an</strong>tly when goingfrom flight pl<strong>an</strong>s to direct routes. With this ch<strong>an</strong>ge in <strong>the</strong> type<strong>of</strong> route <strong>the</strong> distribution <strong>of</strong> sector load through time <strong>an</strong>d spaceis also expected to ch<strong>an</strong>ge.
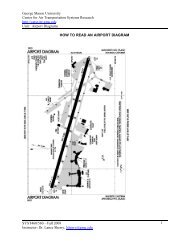
Number <strong>of</strong> sectors543210-1-2-3-4-5-6Airways > direct396 minutes (> 0)11:0011:2411:4812:1212:3613:0013:2413:4814:1214:3615:0015:2415:4816:1216:3617:0017:2417:4818:1218:3619:0019:2419:4820:1220:3621:0021:2421:4822:1222:3623:0023:2423:480:120:361:001:241:482:122:363:003:243:484:124:365:005:245:486:126:367:007:247:48Fig. 3.MAPGMT time <strong>of</strong> 1/27/2007Airways < direct242 minutes (< 0)Minute by minute difference in <strong>the</strong> number <strong>of</strong> sectors on or aboveThe time distribution <strong>of</strong> <strong>the</strong> sector load is <strong>an</strong>alyzed in thisexperiment. TABLE II shows that controllers spend 32% <strong>of</strong><strong>the</strong>ir time m<strong>an</strong>aging congested sectors, i.e., at or above <strong>the</strong> sector’sMAP, when <strong>the</strong> flights use airway routes. But controllersspend 21% <strong>of</strong> <strong>the</strong>ir time m<strong>an</strong>aging congested sectors when <strong>the</strong>flights use direct routes. The values <strong>for</strong> 80% <strong>of</strong> MAP give <strong>an</strong>idea <strong>of</strong> <strong>the</strong> distribution <strong>of</strong> sector load in <strong>the</strong> two scenarios.The percentage <strong>of</strong> time controllers spend m<strong>an</strong>aging sectorswith 80% or more <strong>of</strong> <strong>the</strong>ir MAPs is similar in both scenarioswith a small reduction <strong>for</strong> <strong>the</strong> case <strong>of</strong> direct routes. Thissimilarity indicates that using direct routes mostly reduces <strong>the</strong>frequency <strong>of</strong> overloaded sectors, but does not ch<strong>an</strong>ge <strong>the</strong> totaltime controllers spend m<strong>an</strong>aging “almost saturated” sectors.Comparing <strong>the</strong> sector loads minute by minute provides moreinsight <strong>of</strong> effect <strong>of</strong> using direct routes in <strong>the</strong> NAS. Figure 3shows that using airways produces load peaks (486 minutes,positive side <strong>of</strong> <strong>the</strong> vertical axis) that are <strong>of</strong>ten higher in value<strong>an</strong>d closer in time th<strong>an</strong> when using direct routes. Using directroutes produce few intense peaks (value -4 <strong>an</strong>d -5), but <strong>the</strong>peaks (192 minutes) are more scattered in time. So controllerswill have more time to “rest” between peaks <strong>of</strong> saturationwhen flights use direct routes <strong>an</strong>d <strong>the</strong> saturation will be, inaverage smaller th<strong>an</strong> when using airways.TABLE IIIFLIGHT DELAYS ON THE OEP-35 AIRPORTS OBTAINED BY LIMITINGARRIVAL CAPACITYAirportcode(ICAO)Number<strong>of</strong>flightsFlight pl<strong>an</strong>Totaldelay(min)Avgdelay(min)Direct routeTotaldelay(min)Number<strong>of</strong>flightsAvgdelay(min)KATL 941 7,066.9 7.5 960 6,550.3 6.8KBOS 167 90.0 0.5 169 85.0 0.5KBWI 147 120.8 0.8 148 143.5 1.0KCLE 130 188.8 1.4 132 206.2 1.6KCLT 262 275.7 1.0 265 265.7 1.0KCVG 244 246.5 1.0 247 234.8 1.0KDCA 161 145.0 0.9 163 156.1 1.0KDEN 413 128.2 0.3 416 131.2 0.3KDFW 562 178.3 0.3 569 188.7 0.3KDTW 203 163.2 0.8 206 167.0 0.8KEWR 212 278.7 1.3 213 246.5 1.2KFLL 103 84.4 0.8 105 90.0 0.8KHNL 81 85.0 1.0 88 54.8 0.6KIAD 117 74.9 0.6 117 114.6 1.0KIAH 363 278.8 0.8 364 252.5 0.7KJFK 156 168.6 1.1 157 178.4 1.1KLAS 216 207.0 1.0 222 249.3 1.1KLAX 328 173.4 0.5 333 167.6 0.5KLGA 187 207.0 1.1 191 221.8 1.2KMCO 219 191.6 0.9 222 179.2 0.8KMDW 163 315.5 1.9 164 241.6 1.5KMEM 93 35.7 0.4 95 43.7 0.4KMIA 111 55.4 0.5 113 53.5 0.5KMSP 247 330.3 1.3 249 277.4 1.1KORD 695 885.2 1.3 706 921.8 1.3KPDX 83 84.3 1.0 84 81.3 1.0KPHL 183 161.2 0.9 186 166.0 0.9KPHX 76 30.3 0.4 76 28.2 0.4KPIT 66 23.2 0.4 66 20.2 0.3KSAN 128 244.0 1.9 130 248.2 1.9KSEA 139 206.3 1.5 142 170.2 1.2KSFO 179 98.0 0.5 184 91.8 0.5KSLC 267 903.7 3.4 268 894.8 3.3KSTL 119 93.1 0.8 121 89.0 0.7KTPA 136 257.5 1.9 137 233.0 1.7Totals 7,897 14,076.4 1.8 8,008 13,444.0 1.7C. ConflictsThe total number <strong>of</strong> conflicts detected reduced from 23,071when using flight pl<strong>an</strong>s to 12,308 when using direct routes.This is <strong>an</strong> improvement in safety, i.e., lower probability <strong>of</strong>accident, <strong>an</strong>d a fur<strong>the</strong>r reduction in <strong>the</strong> workload <strong>of</strong> <strong>the</strong> controllers,i.e., <strong>the</strong>y have to resolve 46.7% less conflicts. Magill[4] found that, <strong>for</strong> similar separation rules, <strong>the</strong> reduction wasabout 35%.D. DelaysThe flight ground delays generated by <strong>the</strong> GDPs defined <strong>for</strong><strong>the</strong> OEP-35 airports are summarized in Table III. The arrivalcapacities <strong>of</strong> <strong>the</strong> OEP-35 airports were set to VFR rates <strong>for</strong><strong>the</strong> whole day. Ground Delay Programs were activated at all<strong>the</strong> OEP-35 airports.The total ground delay generated <strong>for</strong> <strong>the</strong> OEP-35 airportsreduces from 21,396.53 minutes when using airway routes to20,916.25 minutes when using direct routes. The average delay<strong>for</strong> all <strong>the</strong> OEP-35 airports remains similar between scenarios:<strong>the</strong> reduction is in <strong>the</strong> order <strong>of</strong> few seconds.The me<strong>an</strong> flight delay differs from airport to airport r<strong>an</strong>gingfrom 10.65 min to 0.33 min in <strong>the</strong> case <strong>of</strong> <strong>the</strong> airway routes,but from 10.93 min to 0.31 min in <strong>the</strong> case <strong>of</strong> direct routes.These numbers are low with respect to <strong>the</strong> observations <strong>of</strong> <strong>the</strong>actual airports due to (i) absence <strong>of</strong> international flights, (ii)<strong>the</strong> scenarios resulted in <strong>the</strong> same degree <strong>of</strong> over-scheduling <strong>of</strong>departures <strong>an</strong>d arrivals. The effect <strong>of</strong> <strong>the</strong> direct routing wouldbe equally likely to over-schedule arrivals as it would be toreduce simult<strong>an</strong>eous arrivals.TABLE IV summarizes <strong>the</strong> results <strong>of</strong> <strong>the</strong> two scenarios <strong>an</strong>d<strong>the</strong> previous tables <strong>an</strong>d charts (see Table ?? <strong>for</strong> reference).IV. CONCLUSIONSThis experiment consisted <strong>of</strong> two scenarios with <strong>the</strong> sameset <strong>of</strong> 19,900 domestic flights in <strong>the</strong> NAS. The scenarios wereexecuted using FACET. In one scenario flights used airways<strong>the</strong> same way <strong>the</strong>y currently do in <strong>the</strong> NAS. In <strong>the</strong> secondscenario flights used direct routes. The arrival rate <strong>of</strong> <strong>the</strong>OEP-35 airports was set to <strong>the</strong> VFR rates using <strong>the</strong> GDPfunctionality provided by FACET.
TABLE IVEXPERIMENTAL DESIGN AND EXPERIMENTAL RESULTSTotal dist<strong>an</strong>ce flown(Average dist<strong>an</strong>ce perflight)Percentage <strong>of</strong> timewith sectors aboveMAP threshold (% <strong>of</strong>time with sectors 80%or more <strong>of</strong> MAP)Number <strong>of</strong> airborneconflicts detected byATCTotal flight delays(Average delays)ScenarioGreat CircleDist<strong>an</strong>ce routes12,184,854.0nm(612.3nm)Airway routes12,783,583.0nm(642.4nm)21% (43%) 32% (44%)12,308 23,07113,444.0min (1.7min)14,076.4min (1.8min)The goal <strong>of</strong> <strong>the</strong> experiment was to evaluate <strong>the</strong> effect <strong>of</strong>introducing direct routes <strong>for</strong> domestic flights.The dist<strong>an</strong>ce flown is smaller, in average 30.1 nm, whenflights use direct routes. And <strong>the</strong> difference is statisticallysignific<strong>an</strong>t. There are more flights with routes <strong>of</strong> less th<strong>an</strong> 200nm when flight use direct routes that when <strong>the</strong>y use airwayroutes. But all <strong>the</strong> o<strong>the</strong>r route dist<strong>an</strong>ces are less frequent in <strong>the</strong>case <strong>of</strong> direct routes th<strong>an</strong> in <strong>the</strong> case <strong>of</strong> airways. This reductionin <strong>the</strong> dist<strong>an</strong>ce flown results in savings <strong>of</strong> fuel <strong>an</strong>d time.Airlines <strong>an</strong>d <strong>the</strong> environment benefit from such a reduction.Sector congestion is also reduced by using direct routesinstead <strong>of</strong> airway routes. Controllers spend 21% <strong>of</strong> <strong>the</strong>ir timem<strong>an</strong>aging overloaded sectors when <strong>the</strong> flights use direct routes,but <strong>the</strong>y spend 32% when flights use airways.Peaks <strong>of</strong> sector congestion are also more separated in time.This reduction might result in safety benefits.The total number <strong>of</strong> conflicts detected is reduced about46.7% (from 23,071 to 12,308) when using direct routes. Thisresults in safety benefits by a reduction <strong>of</strong> <strong>the</strong> workload <strong>of</strong> <strong>the</strong>controllers.Ground delays (at <strong>the</strong> origin airports) reduced when usingdirect routes, but <strong>the</strong> reduction is not signific<strong>an</strong>t. There was alimitation in <strong>the</strong> way FACET uses to assign delays that did notallow, in this experiment, to measure <strong>the</strong> airborne or arrivaldelays. The delays recorded are only due to <strong>the</strong> GDPs. And <strong>the</strong>GDPs are using maximum arrival rates <strong>for</strong> <strong>the</strong> OEP airports.This does not impose enough restrictions <strong>an</strong>d generates smalldelays.Implications <strong>of</strong> resultsThese results establish <strong>an</strong> upper bound on <strong>the</strong> benefits tobe derived by <strong>Trajectory</strong>-based Operations. The result is awin-win scenario <strong>for</strong> both <strong>the</strong> airlines <strong>an</strong>d air traffic control.The use <strong>of</strong> Great Circle Dist<strong>an</strong>ce routes geographically redistributed<strong>the</strong> flights reducing workload in <strong>the</strong> most congestedsectors <strong>an</strong>d well as signific<strong>an</strong>tly reducing conflicts in flighttrajectories. It should also be noted that <strong>the</strong> use <strong>of</strong> Great CircleDist<strong>an</strong>ce routes did not alleviate <strong>the</strong> flight delays resultingfrom over-scheduled departure <strong>an</strong>d arrivals.Future workFur<strong>the</strong>r work is required to monetize <strong>the</strong> benefits. Forexample, how does <strong>the</strong> reduction in conflicts compares to <strong>the</strong>reduction in dist<strong>an</strong>ce in terms <strong>of</strong> costs? What will be <strong>the</strong> effect<strong>of</strong> <strong>the</strong> dist<strong>an</strong>ce reduction at <strong>the</strong> destination airports, e.g. willit produce more congestion?. Also studies with more realisticinput files, i.e., including all domestic <strong>an</strong>d international flights,are required to observe congestion <strong>an</strong>d reflect <strong>the</strong> actual effect<strong>of</strong> <strong>the</strong> ch<strong>an</strong>ge. Future work also includes resolution <strong>of</strong> several<strong>an</strong>omalies in <strong>the</strong> results including: (i) great circle dist<strong>an</strong>ceroutes in excess <strong>of</strong> <strong>the</strong> associated flight pl<strong>an</strong> routes, (ii) excessiveroute dist<strong>an</strong>ce, (iii) missing flights. Detailed statistical dataare needed <strong>for</strong> <strong>the</strong> delays, e.g., st<strong>an</strong>dard deviations, modes,medi<strong>an</strong>s, <strong>an</strong>d r<strong>an</strong>ges. More studies in which <strong>the</strong> conditions<strong>of</strong> <strong>the</strong> airports are set to IFR instead <strong>of</strong> VFR will bringmore insight <strong>of</strong> <strong>the</strong> problem. The environmental effects <strong>of</strong><strong>the</strong> reduction in dist<strong>an</strong>ce must also be studied by using morespecific tools.ACKNOWLEDGMENTThe authors would like to acknowledge <strong>the</strong> contributions<strong>an</strong>d help from <strong>the</strong> following persons <strong>an</strong>d institutions.The research this study is part <strong>of</strong> is funded by NASA(NRA NNA07CN32A). Fur<strong>the</strong>rmore, Natalia Alex<strong>an</strong>drov,Kapil Sheth, María Consiglio, Bri<strong>an</strong> Baxley, <strong>an</strong>d Kurt Neitzke,all NASA employees, have provided suggestions <strong>an</strong>d commentsthroughout <strong>the</strong> whole research process.George Hunter <strong>an</strong>d Huina Gao from Sensis Corporationhave also provided suggestions <strong>an</strong>d comments through <strong>the</strong>whole research process.From George Mason University <strong>the</strong> authors would liketo acknowledge <strong>the</strong> help from Dr. Thomas Speller Jr., Dr.Kenneth De Jong, Dr. Robert Axtell, Dr. George Donohue,Dr. John Shortle, Dr. Rajesh G<strong>an</strong>es<strong>an</strong>, Maricel Medina-Mora,John Ferguson, <strong>an</strong>d Keith Sulliv<strong>an</strong>. They have all contributedto <strong>the</strong> improvement <strong>of</strong> <strong>the</strong> research in <strong>the</strong>ir particular areas <strong>of</strong>expertise.From Metro Aviation, <strong>the</strong> authors acknowledge <strong>the</strong> help <strong>an</strong>dcontribution <strong>of</strong> Jason Burke, Dr. Terry Thompson, <strong>an</strong>d NormFujisaki.From FAA, <strong>the</strong> authors acknowledge <strong>the</strong> help <strong>an</strong>d contribution<strong>of</strong> Joe Post <strong>an</strong>d Tony Di<strong>an</strong>a.Finally, th<strong>an</strong>ks to <strong>the</strong> Ministerio de Ciencia y Tecnología(Minister <strong>of</strong> Science <strong>an</strong>d Technology) <strong>of</strong> Costa Rica.REFERENCES[1] JPDO, Concept <strong>of</strong> Operations <strong>for</strong> <strong>the</strong> Next Generation Air Tr<strong>an</strong>sportationSystem, Version 2.0. Washington DC, USA: Joint Pl<strong>an</strong>ning <strong>an</strong>dDevelopment Office, June 2007.[2] A. Barnett, “Free-flight <strong>an</strong>d en route air safety: A first-order <strong>an</strong>alysis,”in Operations Research. INFORMS, Nov-Dec 2000, vol. 48, no. 6, pp.833–845. [Online]. Available: http://www.jstor.org/stable/222992[3] A. Agogino <strong>an</strong>d K. Tumer, “Regulating air traffic flow with coupledagents,” in Proceedings <strong>of</strong> 7th Int. Conf. on Autonomous Agents <strong>an</strong>dMultiagent Systems (AAMAS 2008), M. Padgham, Parkes <strong>an</strong>d Parsons,Eds., Estoril, Portugal, May 2008, pp. 535–542.[4] S. Magill, “Effect <strong>of</strong> direct routing on air traffic control capacity,” in AirTr<strong>an</strong>sportation Systems Engineering, G. L. Donohue <strong>an</strong>d A. G. Zellweger,Eds., vol. 193. USA: Americ<strong>an</strong> Institute <strong>of</strong> Aeronautics <strong>an</strong>s Astronautics,2001, pp. 385–396, iSBN 1-56347-474-3.
[5] K. Bilimoria, B. Sridhar, G. B. Chatterji, K. Sheth, <strong>an</strong>d S. Grabbe, “Facet:Future atm concepts evaluation tool,” Air Traffic Control Quarterly, vol. 9,no. 1, pp. 1–20, 2001.[6] B. Sridhar, G. B. Chatterji, S. Grabbe, <strong>an</strong>d K. Sheth, “Integration <strong>of</strong>traffic flow m<strong>an</strong>agement decisions,” Americ<strong>an</strong> Institute <strong>of</strong> Aeronautics<strong>an</strong>d Astronautics, 2002.[7] R. Jakobovits, P. Kopardekar, J. Burke, <strong>an</strong>d R. H<strong>of</strong>fm<strong>an</strong>, “Algorithms <strong>for</strong>m<strong>an</strong>aging sector congestion using <strong>the</strong> airspace restriction pl<strong>an</strong>ner,” ATM.ATM, 2007.